1 Concept
Clustering techniques are widely used in many applications for identifying pattern (i.e clusters) in a data set. However clusters can be found in a data set by chance due to clustering noise or sampling error.
This article describes the R package pvclust (Suzuki et al., 2004) which uses bootstrap resampling techniques to compute p-value for each clusters.
2 Algoritm
- Generated thousands of bootstrap samples by randomly sampling elements of the data
- Compute hierarchical clustering on each bootstrap copy
- For each cluster:
- compute the bootstrap probability (BP) value which corresponds to the frequency that the cluster is identified in bootstrap copies.
- Compute the approximately unbiased (AU) probability values (p-values) by multiscale bootstrap resampling
Clusters with AU > = 95% are considered to be strongly supported by data.
3 Required R packages
- Install pvclust:
install.packages("pvclust")- Load pvclust:
library(pvclust)4 Data preparation
Well use lung dataset [in pvclust package]. It contains the gene expression profile of 916 genes of 73 lung tissues including 67 tumors. Columns are samples and rows are genes.
library(pvclust)
# Load the data
data("lung")
head(lung[, 1:4])
## fetal_lung 232-97_SCC 232-97_node 68-96_Adeno
## IMAGE:196992 -0.40 4.28 3.68 -1.35
## IMAGE:587847 -2.22 5.21 4.75 -0.91
## IMAGE:1049185 -1.35 -0.84 -2.88 3.35
## IMAGE:135221 0.68 0.56 -0.45 -0.20
## IMAGE:298560 NA 4.14 3.58 -0.40
## IMAGE:119882 -3.23 -2.84 -2.72 -0.83# Dimension of the data
dim(lung)## [1] 916 73Well use only a subset of the dataset for the clustering analysis. The R function sample() can be used to extract a random subset of 30 samples:
set.seed(123)
ss <- sample(1:73, 30) # extract 20 samples out of
df <- lung[, ss]
5 Compute p-value for hierarchical clustering
5.1 Description of pvclust() function
The function pvclust() can be used as follow:
pvclust(data, method.hclust = "average",
        method.dist = "correlation", nboot = 1000)
Note that, the computation time can be strongly decreased using parallel computation version called parPvclust(). (Read ?parPvclust() for more information.)
parPvclust(cl=NULL, data, method.hclust = "average",
           method.dist = "correlation", nboot = 1000,
iseed = NULL)- data: numeric data matrix or data frame.
- method.hclust: the agglomerative method used in hierarchical clustering. Possible values are one of average, ward, single, complete, mcquitty, median or centroid. The default is average. See method argument in ?hclust.
- method.dist: the distance measure to be used. Possible values are one of correlation, uncentered, abscor or those which are allowed for method argument in dist() function, such euclidean and manhattan.
- nboot: the number of bootstrap replications. The default is 1000.
- iseed: an integrer for random seeds. Use iseed argument to achieve reproducible results.
The function pvclust() returns an object of class pvclust containing many elements including hclust which contains hierarchical clustering result for the original data generated by the function hclust().
5.2 Usage of pvclust() function
pvclust() performs clustering on the columns of the dataset, which correspond to samples in our case. If you want to perform the clustering on the variables (here, genes) you have to transpose the dataset using the function t().
The R code below computes pvclust() using 10 as the number of bootstrap replications (for speed):
library(pvclust)
set.seed(123)
res.pv <- pvclust(df, method.dist="cor",
                  method.hclust="average", nboot = 10)
# Default plot
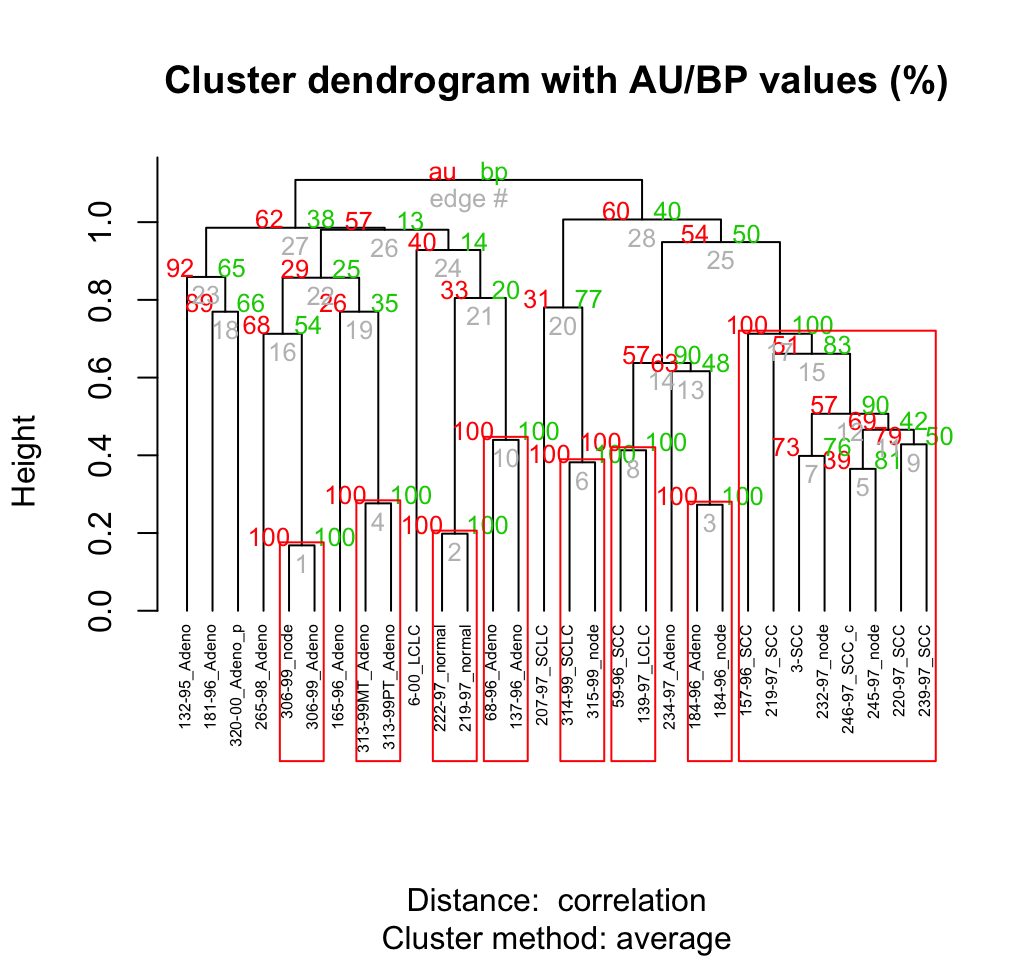
plot(res.pv, hang = -1, cex = 0.5)
pvrect(res.pv)
Values on the dendrogram are AU p-values (Red, left), BP values (green, right), and cluster labels (grey, bottom). Clusters with AU > = 95% are indicated by the rectangles and are considered to be strongly supported by data.
Parrallel computation can be applied as follow:
# Create a parallel socket cluster
library(parallel)
cl <- makeCluster(2, type = "PSOCK")
# parallel version of pvclust
res.pv <- parPvclust(cl, df, nboot=1000)
stopCluster(cl)
6 Infos
This analysis has been performed using R software (ver. 3.2.1)
- Suzuki, R. and Shimodaira, H. An application of multiscale bootstrap resampling to hierarchical clustering of microarray data: How accurate are these clusters?. The Fifteenth International Conference on Genome Informatics 2004, P034.
- Suzuki R1, Shimodaira H. Pvclust: an R package for assessing the uncertainty in hierarchical clustering. Bioinformatics. 2006 Jun 15;22(12):1540-2. Epub 2006 Apr 4.