This R tutorial describes how to create an area plot using R software and ggplot2 package. Well see also, how to color under density curve using geom_area.
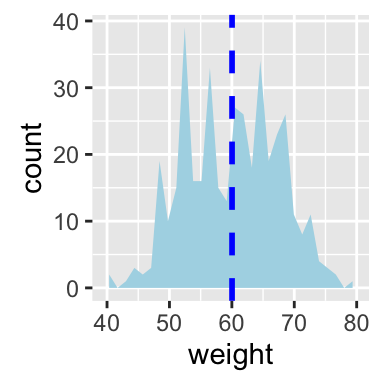
The function geom_area() is used. You can also add a line for the mean using the function geom_vline.

Prepare the data
This data will be used for the examples below :
set.seed(1234)

df <- data.frame(
  sex=factor(rep(c("F", "M"), each=200)),
  weight=round(c(rnorm(200, mean=55, sd=5),
                 rnorm(200, mean=65, sd=5)))
  )

head(df)
## sex weight
## 1 F 49
## 2 F 56
## 3 F 60
## 4 F 43
## 5 F 57
## 6 F 58Basic area plots
library(ggplot2)
p <- ggplot(df, aes(x=weight))

# Basic area plot
p + geom_area(stat = "bin")

# y axis as density value
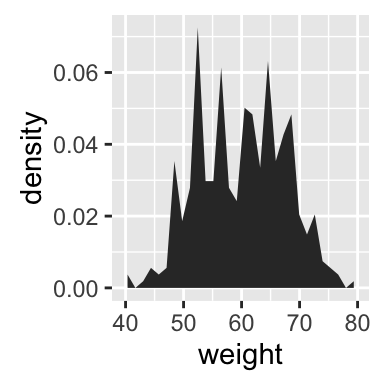
p + geom_area(aes(y = ..density..), stat = "bin")

# Add mean line
p + geom_area(stat = "bin", fill = "lightblue")+
  geom_vline(aes(xintercept=mean(weight)),
            color="blue", linetype="dashed", size=1)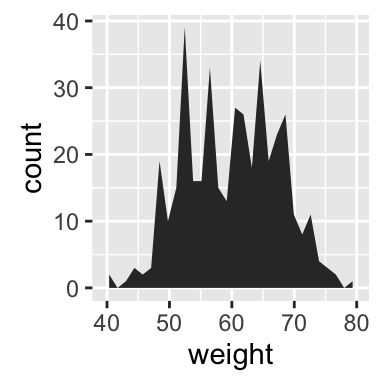
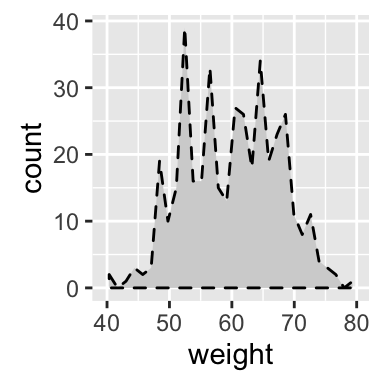
Change line types and colors
# Change line color and fill color
p + geom_area(stat ="bin", color="darkblue",
              fill="lightblue")

# Change line type
p + geom_area(stat = "bin", color= "black",
              fill="lightgrey", linetype="dashed")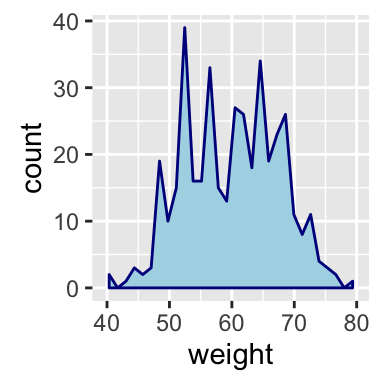
Read more on ggplot2 line types : ggplot2 line types
Change colors by groups
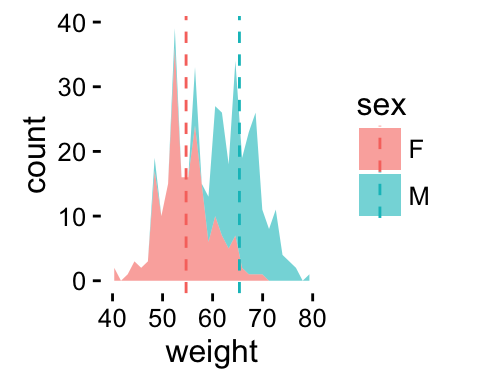
Calculate the mean of each group :
library(plyr)
mu <- ddply(df, "sex", summarise, grp.mean=mean(weight))
head(mu)
## sex grp.mean
## 1 F 54.70
## 2 M 65.36Change fill colors
Area plot fill colors can be automatically controlled by the levels of sex :
# Change area plot fill colors by groups
ggplot(df, aes(x=weight, fill=sex)) +
  geom_area(stat ="bin")

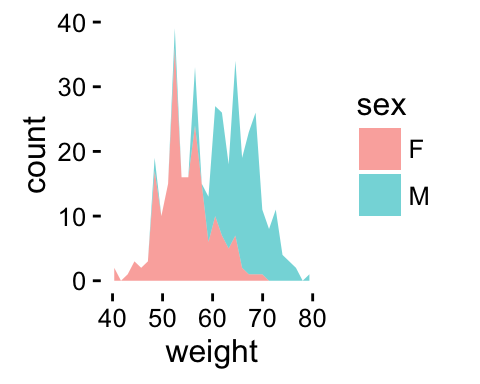
# Use semi-transparent fill
p<-ggplot(df, aes(x=weight, fill=sex)) +
  geom_area(stat ="bin", alpha=0.6) +
  theme_classic()
p

# Add mean lines
p+geom_vline(data=mu, aes(xintercept=grp.mean, color=sex),
             linetype="dashed")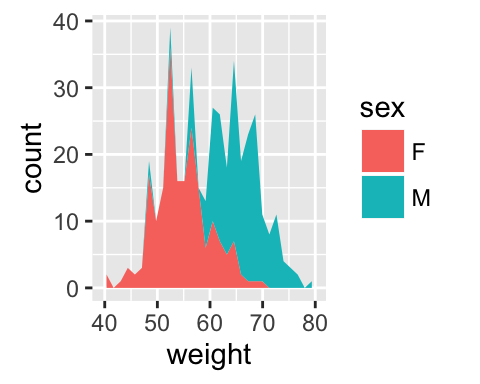
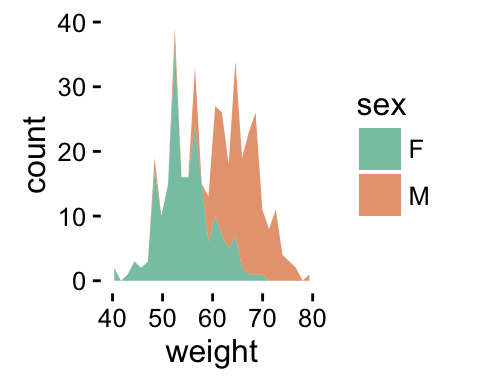
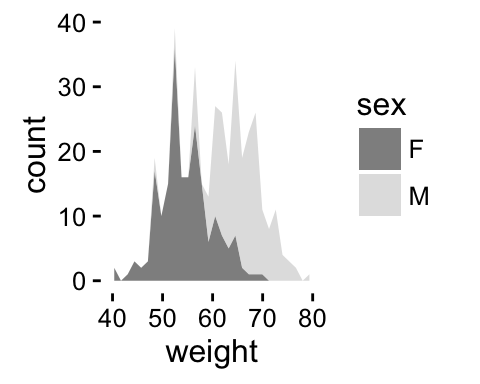
It is also possible to change manually the area plot fill colors using the functions :
- scale_fill_manual() : to use custom colors
- scale_fill_brewer() : to use color palettes from RColorBrewer package
- scale_fill_grey() : to use grey color palettes
# Use custom color palettes
p+scale_fill_manual(values=c("#999999", "#E69F00"))

# use brewer color palettes
p+scale_fill_brewer(palette="Dark2")

# Use grey scale
p + scale_fill_grey()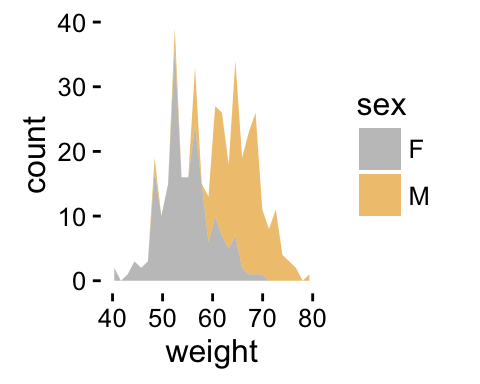
Read more on ggplot2 colors here : ggplot2 colors
Change the legend position
p + theme(legend.position="top")

p + theme(legend.position="bottom")

p + theme(legend.position="none") # Remove legend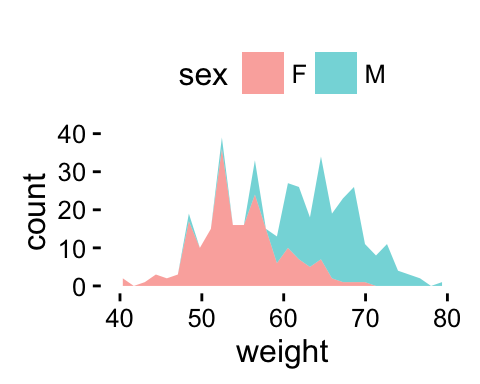
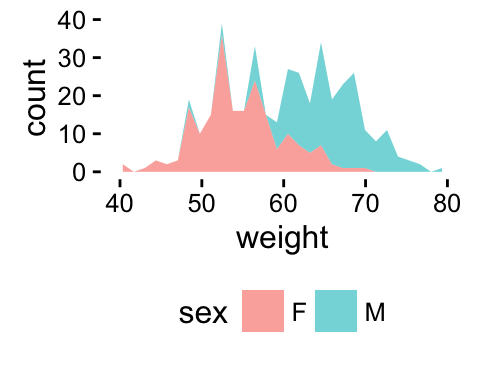
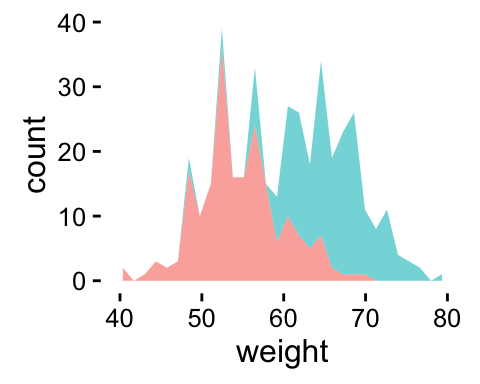
The allowed values for the arguments legend.position are : left,top, right, bottom.
Read more on ggplot legends : ggplot2 legends
Use facets
Split the plot in multiple panels :
p<-ggplot(df, aes(x=weight))+
  geom_area(stat ="bin")+facet_grid(sex ~ .)
p

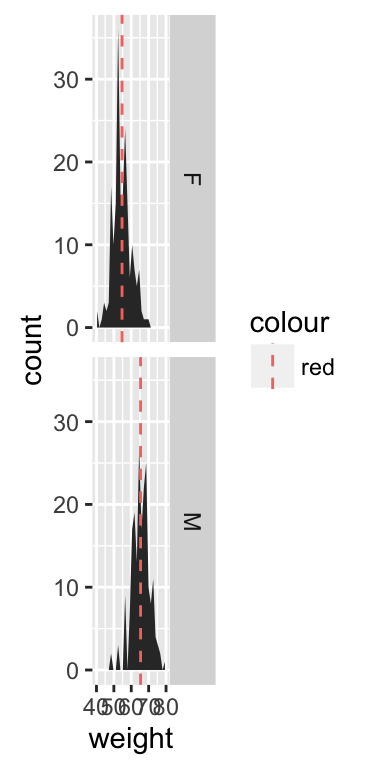
# Add mean lines
p+geom_vline(data=mu, aes(xintercept=grp.mean, color="red"),
             linetype="dashed")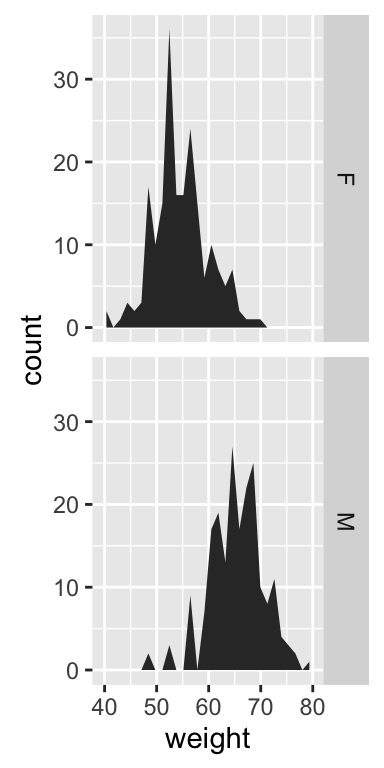
Read more on facets : ggplot2 facets
Contrasting bar plot and area plot
An area plot is the continuous analog of a stacked bar chart. In the following example, well use diamonds data set [in ggplot2 package]:
# Load the data
data("diamonds")
p <- ggplot(diamonds, aes(x = price, fill = cut))
head(diamonds)
## carat cut color clarity depth table price x y z
## 1 0.23 Ideal E SI2 61.5 55 326 3.95 3.98 2.43
## 2 0.21 Premium E SI1 59.8 61 326 3.89 3.84 2.31
## 3 0.23 Good E VS1 56.9 65 327 4.05 4.07 2.31
## 4 0.29 Premium I VS2 62.4 58 334 4.20 4.23 2.63
## 5 0.31 Good J SI2 63.3 58 335 4.34 4.35 2.75
## 6 0.24 Very Good J VVS2 62.8 57 336 3.94 3.96 2.48# Bar plot
p + geom_bar()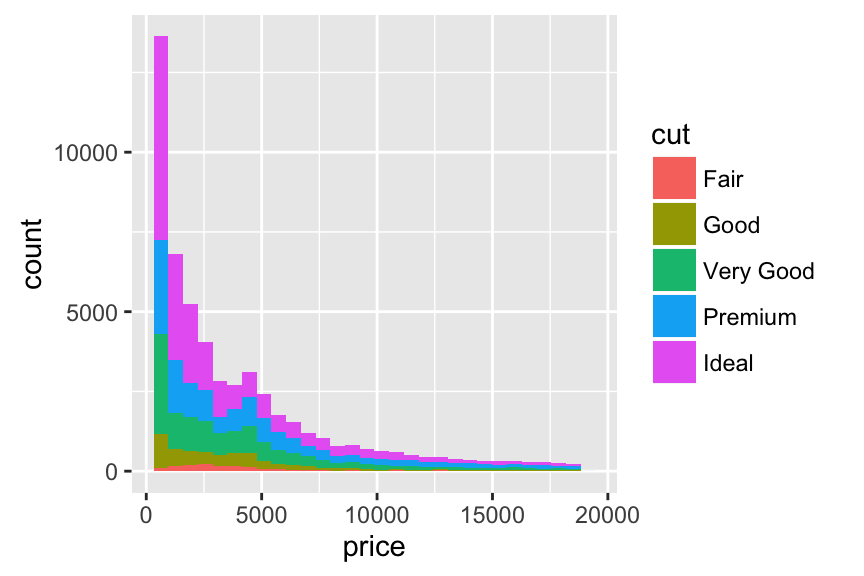
# Area plot
p + geom_area(stat = "bin") +
scale_fill_brewer(palette="Dark2") 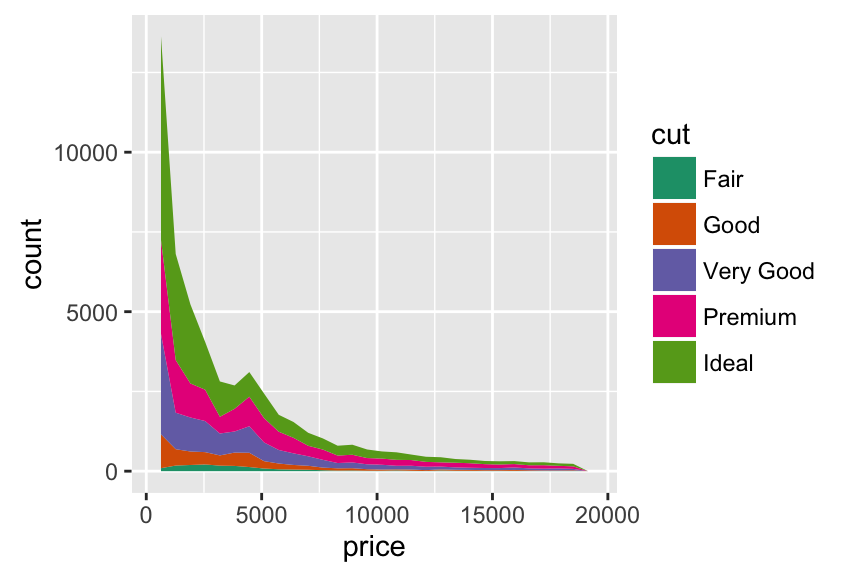
Coloring under density curve using geom_area
dat <- with(density(df$weight), data.frame(x, y))
ggplot(data = dat, mapping = aes(x = x, y = y)) +
    geom_line()+
    geom_area(mapping = aes(x = ifelse(x>65 & x< 70 , x, 0)), fill = "red") +
    xlim(30, 80)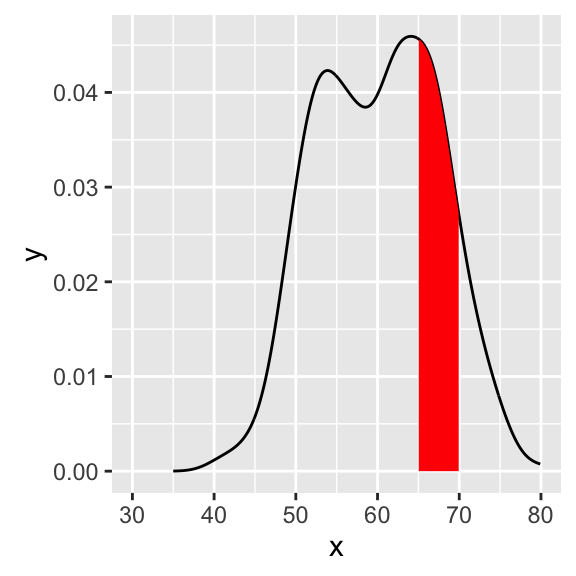
Infos
This analysis has been performed using R software (ver. 3.2.1) and ggplot2 (ver. 1.0.1)