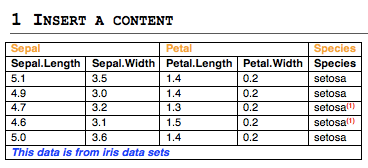
The ReporteRs package is used to create a Word document from R software. The function addFlexTable() can be used to add a simple or customized table into the document.
- The first step is to create a table using one of the functions below :
- FlexTable() to create a flexible table which can be easily formatted
- vanilla.table() which is shortcut to quickly produce a nice FlexTable
- The second step is to add the created table into the Word document using addFlexTable() function as follow :
# doc : docx object
# flextable : FlexTable object
addFlexTable(doc, flextable)
The aim of this R tutorial is to show you step by step, how to add simple and formatted table into a Word document.
In the following examples, well add the first 5 rows of iris data sets into the Word document.
data<-iris[1:5, ]
data
Sepal.Length Sepal.Width Petal.Length Petal.Width Species
1 5.1 3.5 1.4 0.2 setosa
2 4.9 3.0 1.4 0.2 setosa
3 4.7 3.2 1.3 0.2 setosa
4 4.6 3.1 1.5 0.2 setosa
5 5.0 3.6 1.4 0.2 setosaAdd a simple table
library(ReporteRs)

doc <- docx()
data<-iris[1:5, ]

# Add a first table : Default table
doc <- addTitle(doc, "Default table")
doc <- addFlexTable( doc, FlexTable(data))

doc <- addParagraph(doc, c("", "")) # 2 line breaks

# Add a second table, theme : vanilla table
doc <- addTitle(doc, "Vanilla table")
doc <- addFlexTable( doc, vanilla.table(data))

writeDoc(doc, file = "r-reporters-word-document-add-table.docx")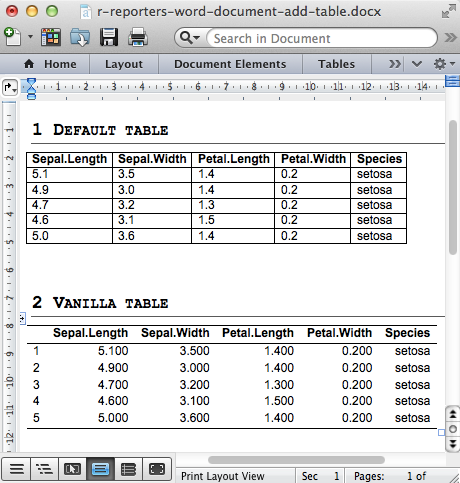
An optional argument of addFlextable() function is par.properties which value can be parRight(), parLeft(), parJustify() for the table alignments. It can be used as follow :
doc <- addFlexTable( doc, vanilla.table(data),
                     par.properties = parCenter())
Note also that, row names are not shown by default when FlexTable() function is used to create a table. To make row names visible use the function as follow :
doc <- addFlexTable( doc, FlexTable(data, row.names=TRUE))Add a formatted table
Change the background colors of rows and columns
You should know three functions to change the appearance of table rows and columns :
- setZebraStyle() : to color odd and even rows differently; for example, odd rows in gray color and even rows in white color.
- setRowsColors() : to change color of a particular table row
- setColumnsColors : to change the color of particular table columns
These functions can be used as follow :
library(ReporteRs)

doc <- docx()

data<-iris[1:5, ]

# Zebra striped tables
doc <- addTitle(doc, "Zebra striped tables")
MyFTable <- vanilla.table(data)
MyFTable <- setZebraStyle(MyFTable, odd = '#eeeeee', even = 'white')
doc <- addFlexTable( doc, MyFTable)

# Change columns and rows background colors
doc <- addTitle(doc, "Change columns and rows background colors")
MyFTable = FlexTable(data = data )
# i : row index; j : column index
MyFTable = setRowsColors(MyFTable, i=2:3, colors = 'lightblue')
MyFTable = setColumnsColors(MyFTable, j=3, colors = 'pink' )
doc <- addFlexTable(doc, MyFTable)

writeDoc(doc, file = "r-reporters-word-document-formatted-table1.docx")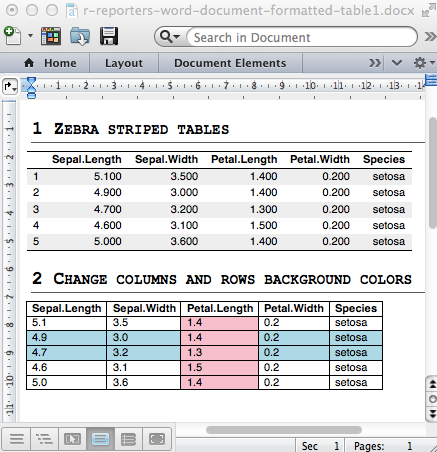
Note that, i and j are, respectively, the index of rows and column to change
Change cell background and text colors
We can change the background colors of some cells according to their values using the function setFlexTableBackgroundColors().
As an example, Well set up the background color of column 2 according to the value of the Sepal.Width variable (iris data sets) :
- Cells with Sepal.Width < 3.2 are colored in gray (#DDDDDD)
- Cells with Sepal.Width > = 3.2 are colored in orange
The text values of the table cells can be also customized as demonstrated in the example below :
library(ReporteRs)

doc <- docx()

data<-iris[1:5, ]

# Change the background colors of column 2 according to Sepal.Width
#++++++++++++++++++++++++++++
doc <- addTitle(doc, "Change the background color of cells")
MyFTable <- FlexTable(data)
MyFTable <- setFlexTableBackgroundColors(MyFTable, j = 2,
  colors = ifelse(data$Sepal.Width < 3.2, '#DDDDDD', 'orange'))

doc <- addFlexTable( doc, MyFTable)

# Format the text of some cells (column 3:4)
#++++++++++++++++++++++++++++
doc <- addTitle(doc, "Format cell text values")
MyFTable = FlexTable(data)
MyFTable[, 3:4] = textProperties(color = 'blue')
doc <- addFlexTable( doc, MyFTable)

writeDoc(doc, file = "r-reporters-word-document-format-cells.docx")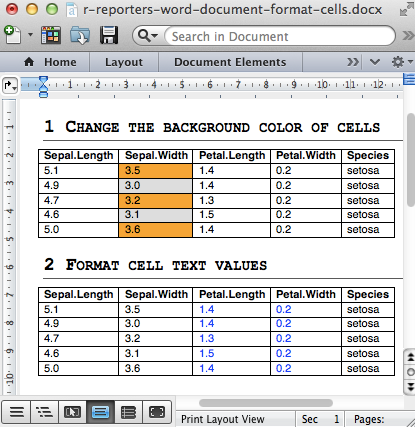
Analyze, format and export a correlation matrix into a Word document
library(ReporteRs)
doc <- docx()

data( mtcars )
cormatrix = cor(mtcars)

col =c("#B2182B", "#D6604D", "#F4A582", "#FDDBC7","#D1E5F0", "#92C5DE", "#4393C3", "#2166AC")

mycut = cut(cormatrix,
        breaks = c(-1,-0.75,-0.5,-0.25,0,0.25,0.5,0.75,1),
        include.lowest = TRUE, label = FALSE )

color_palettes = col[mycut]

corrFT = FlexTable( round(cormatrix, 2), add.rownames = TRUE )

corrFT = setFlexTableBackgroundColors(corrFT,
        j = seq_len(ncol(cormatrix)) + 1,
        colors = color_palettes )


corrFT = setFlexTableBorders( corrFT
        , inner.vertical = borderProperties( style = "dashed", color = "white" )
        , inner.horizontal = borderProperties( style = "dashed", color = "white"  )
        , outer.vertical = borderProperties( width = 2, color = "white"  )
        , outer.horizontal = borderProperties( width = 2, color = "white"  )
)

doc <- addFlexTable( doc, corrFT)

writeDoc(doc, file = "r-reporters-word-document-correlation.docx")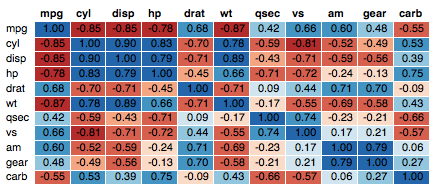
Powerpoint
A pptx object works the same but does not require any parProperties
Infos
This analysis has been performed using R (ver. 3.2.3).
