To reduce overplotting, the argument jitter is used in the functions fviz_pca_xx(), fviz_ca_xx() and fviz_mca_xx() available in the R package factoextra.
The argument jitter is a list containing the parameters what, width and height (i.e jitter = list(what, width, height)):
- what: the element to be jittered. Possible values are point or p; label or l; both or b.
- width: degree of jitter in x direction
- height: degree of jitter in y direction
Some examples of usage are described in the next sections.
Install required packages
- FactoMineR: for computing PCA (Principal Component Analysis), CA (Correspondence Analysis) and MCA (Multiple Correspondence Analysis)
- factoextra: for the visualization of FactoMineR results
FactoMineR and factoextra R packages can be installed as follow :
install.packages("FactoMineR")

# install.packages("devtools")
devtools::install_github("kassambara/factoextra")
Note that, for factoextra a version >= 1.0.3 is required for using the argument jitter. If its already installed on your computer, you should re-install it to have the most updated version.
Load FactoMineR and factoextra
library("FactoMineR")
library("factoextra")
Multiple Correspondence Analysis (MCA)
# Load data
data(poison)
poison.active <- poison[1:55, 5:15]
# Compute MCA
res.mca <- MCA(poison.active, graph = FALSE)
# Default plot
fviz_mca_ind(res.mca)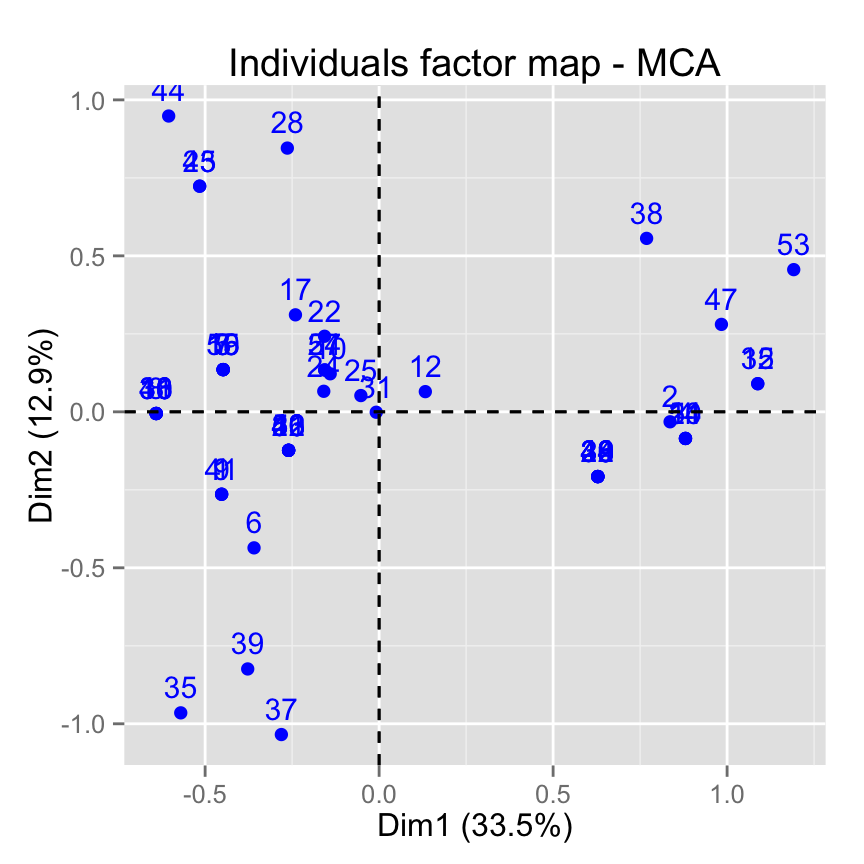
# Use jitter to reduce overplotting.
# Only labels are jittered
fviz_mca_ind(res.mca, jitter = list(what = "label",
                                    width = 0.1, height = 0.15))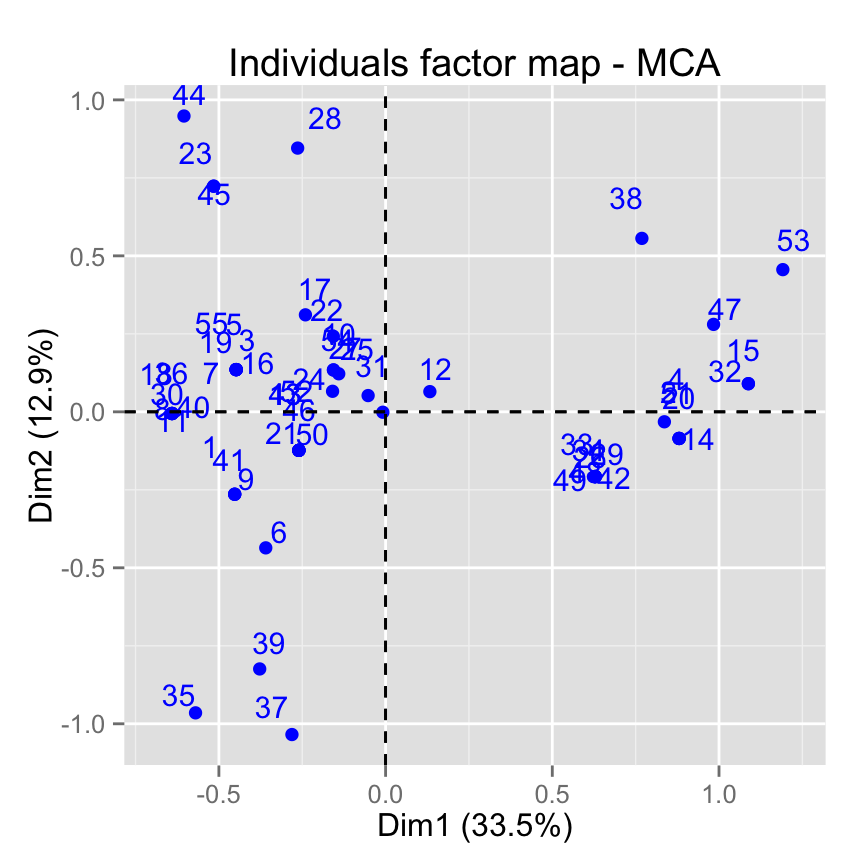
# Jitter both points and labels
fviz_mca_ind(res.mca, jitter = list(what = "both",
                                    width = 0.1, height = 0.15))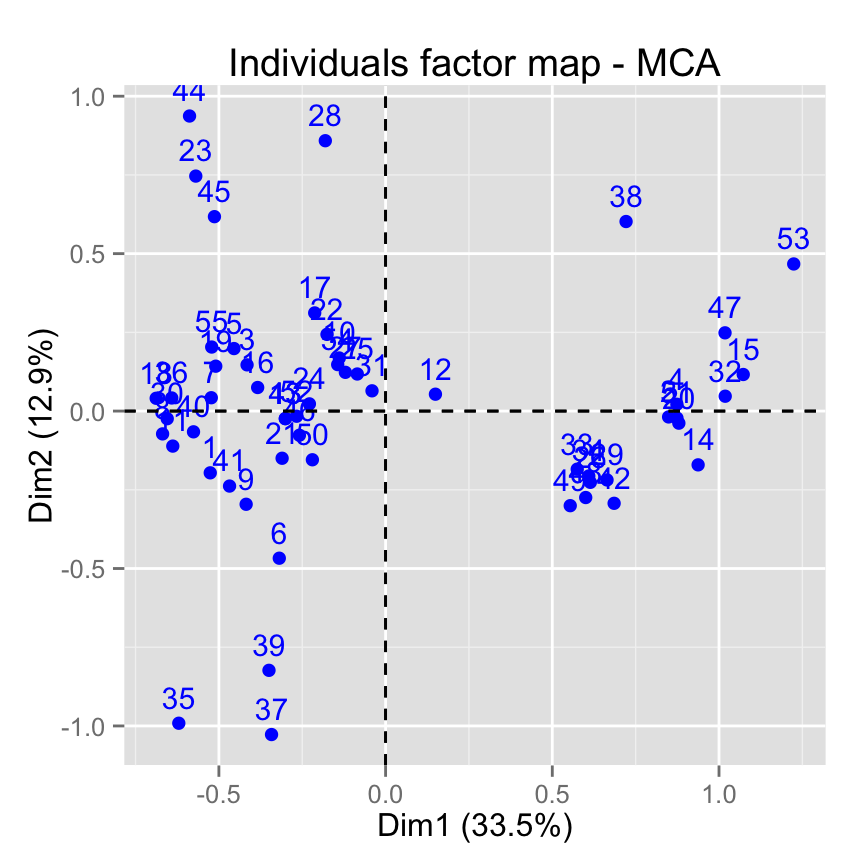
Simple Correspondence Analysis (CA)
# Load data
data("housetasks")
# Compute CA
res.ca <- CA(housetasks, graph = FALSE)
# Default biplot
fviz_ca_biplot(res.ca)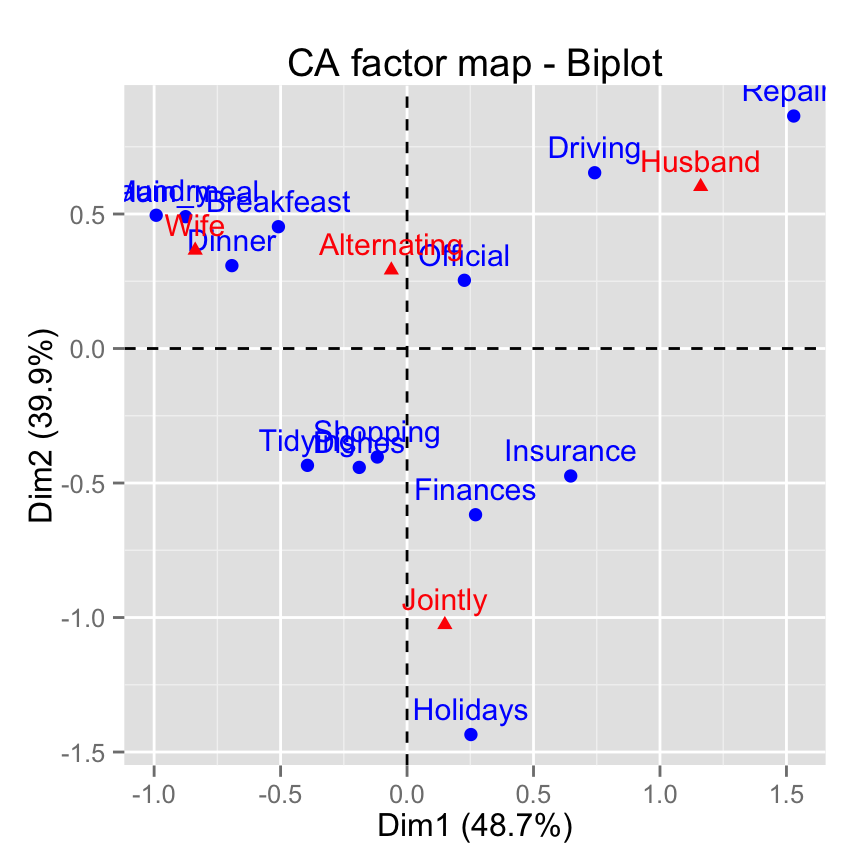
# Jitter in y direction
fviz_ca_biplot(res.ca, jitter = list(what = "label",
                                     width = 0.4, height = 0.3))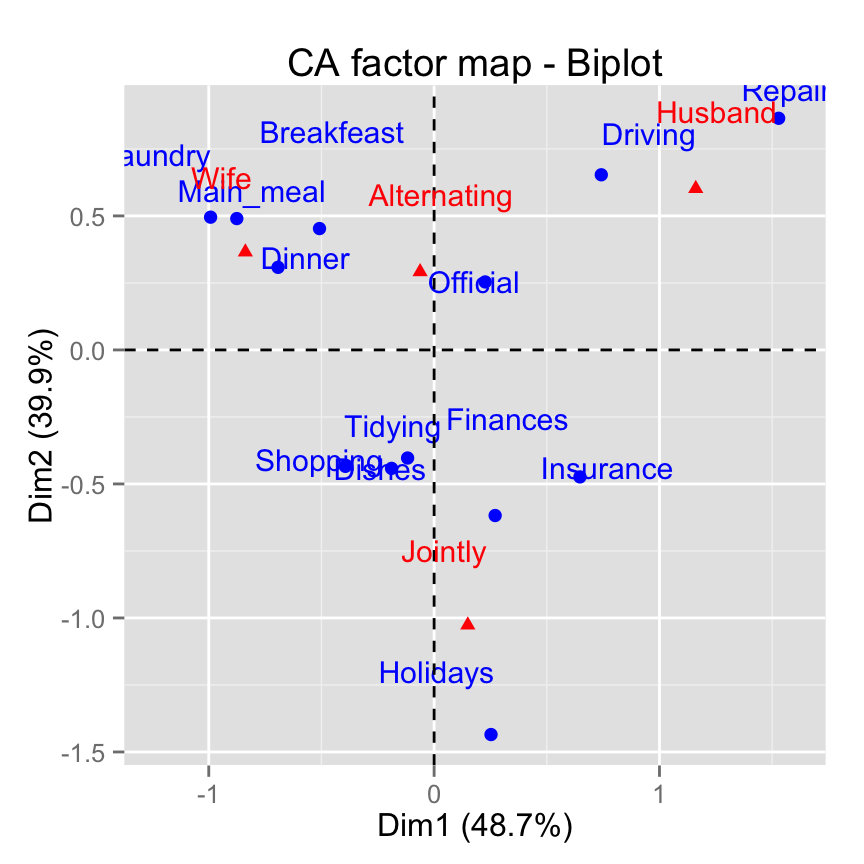
Principal Componet Analysis (PCA)
# Load data
data(decathlon2)
decathlon2.active <- decathlon2[1:23, 1:10]
# Compute PCA
res.pca <- PCA(decathlon2.active, graph = FALSE)
# Default biplot
fviz_pca_ind(res.pca)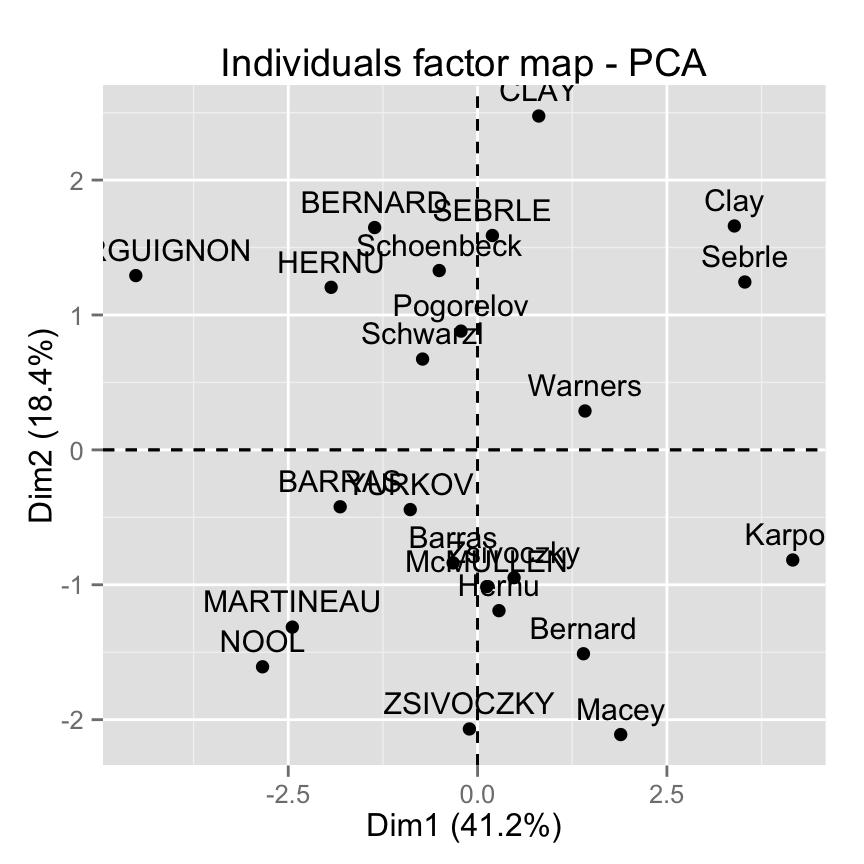
# Use jitter in x and y direction
fviz_pca_ind(res.pca, jitter = list(what = "label",
                                    width = 0.6, height = 0.6))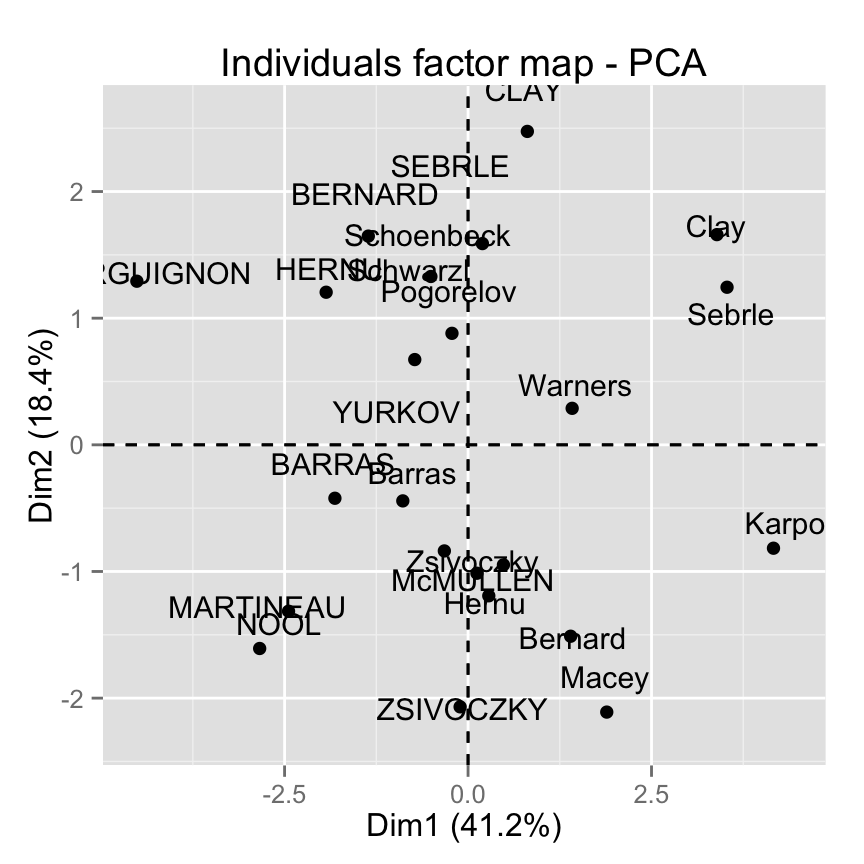
Infos
This analysis has been performed using R software (ver. 3.2.1), FactoMineR (ver. 1.30) and factoextra (ver. 1.0.2)