Previously, we described the essentials of R programming and provided quick start guides for importing data into R. Additionally, we described how to compute descriptive or summary statistics and correlation analysis using R software.
This chapter contains articles describing statistical tests to use for comparing means. These tests include:
- T-test
- Wilcoxon test
- ANOVA test and
- Kruskal-Wallis test
1 How this chapter is organized?
- Comparing one-sample mean to a standard known mean:
- Comparing the means of two independent groups:
- Comparing the means of paired samples:
- Comparing the means of more than two groups
- Analysis of variance (ANOVA, parametric):
- Kruskal-Wallis Test in R (non parametric alternative to one-way ANOVA)
Image may be NSFW.
Clik here to view.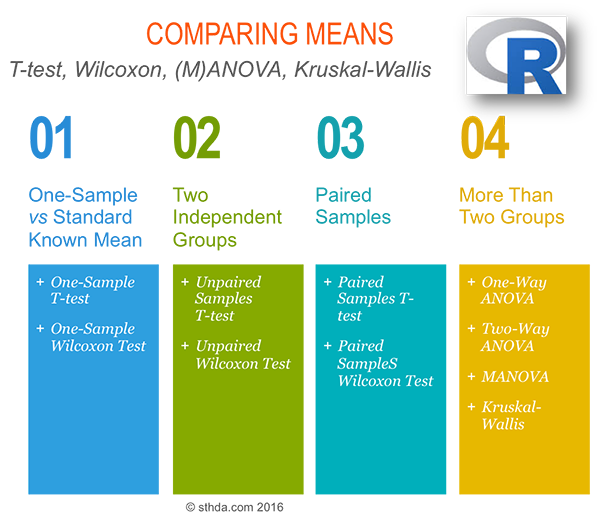
2 Comparing one-sample mean to a standard known mean
2.1 One-sample T-test (parametric)
- What is one-sample t-test?
- Research questions and statistical hypotheses
- Formula of one-sample t-test
- Visualize your data and compute one-sample t-test in R
- R function to compute one-sample t-test
- Visualize your data using box plots
- Preliminary test to check one-sample t-test assumptions
- Compute one-sample t-test
- Interpretation of the result
Image may be NSFW.
Clik here to view.
Read more: —>One-Sample T-test.
2.2 One-sample Wilcoxon test (non-parametric)
- What’s one-sample Wilcoxon signed rank test?
- Research questions and statistical hypotheses
- Visualize your data and compute one-sample Wilcoxon test in R
- R function to compute one-sample Wilcoxon test
- Visualize your data using box plots
- Compute one-sample Wilcoxon test
Image may be NSFW.
Clik here to view.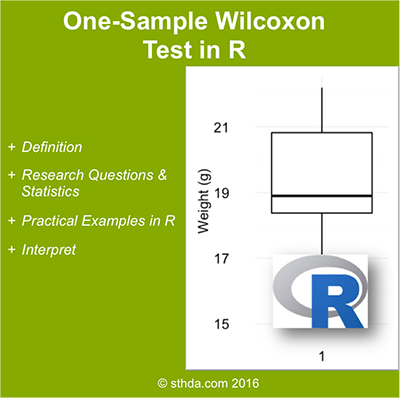
Read more: —>One-Sample Wilcoxon Test (non-parametric).
3 Comparing the means of two independent groups
3.1 Unpaired two samples t-test (parametric)
- What is unpaired two-samples t-test?
- Research questions and statistical hypotheses
- Formula of unpaired two-samples t-test
- Visualize your data and compute unpaired two-samples t-test in R
- R function to compute unpaired two-samples t-test
- Visualize your data using box plots
- Preliminary test to check independent t-test assumptions
- Compute unpaired two-samples t-test
- Interpretation of the result
Image may be NSFW.
Clik here to view.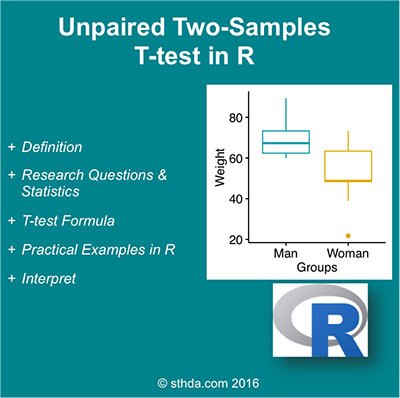
Read more: —>Unpaired Two Samples T-test (parametric).
3.2 Unpaired two-samples Wilcoxon test (non-parametric)
- R function to compute Wilcoxon test
- Visualize your data using box plots
- Compute unpaired two-samples Wilcoxon test
Image may be NSFW.
Clik here to view.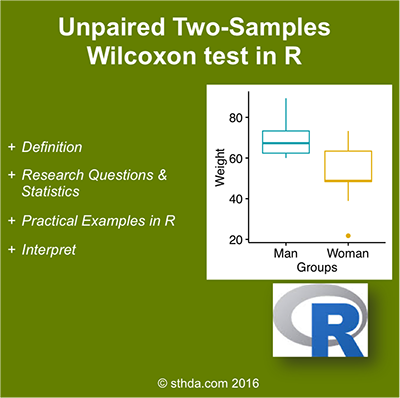
Read more: —>Unpaired Two-Samples Wilcoxon Test (non-parametric).
4 Comparing the means of paired samples
4.1 Paired samples t-test (parametric)
Image may be NSFW.
Clik here to view.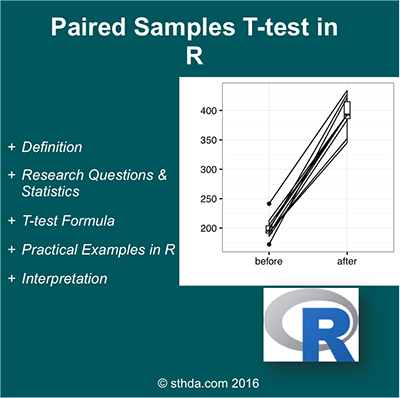
Read more: —>Paired Samples T-test (parametric).
4.2 Paired samples Wilcoxon test (non-parametric)
Image may be NSFW.
Clik here to view.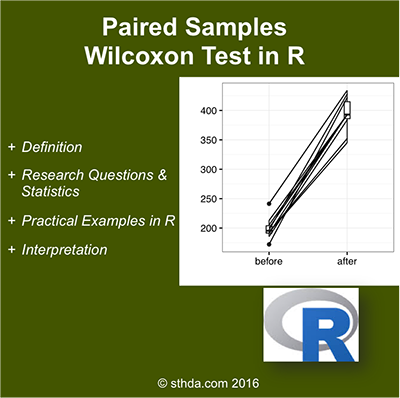
Read more: —>Paired Samples Wilcoxon Test (non-parametric).
5 Comparing the means of more than two groups
5.1 One-way ANOVA test
An extension of independent two-samples t-test for comparing means in a situation where there are more than two groups.
- What is one-way ANOVA test?
- Assumptions of ANOVA test
- How one-way ANOVA test works?
- Visualize your data and compute one-way ANOVA in R
- Visualize your data
- Compute one-way ANOVA test
- Interpret the result of one-way ANOVA tests
- Multiple pairwise-comparison between the means of groups
- Tukey multiple pairewise-comparisons
- Multiple comparisons using multcomp package
- Pairwise t-test
- Check ANOVA assumptions: test validity?
- Check the homogeneity of variance assumption
- Relaxing the homogeneity of variance assumption
- Check the normality assumption
- Non-parametric alternative to one-way ANOVA test
Image may be NSFW.
Clik here to view.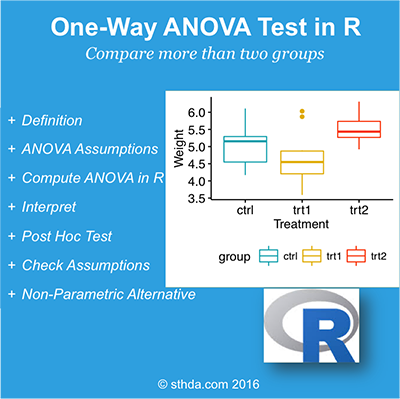
Read more: —>One-Way ANOVA Test in R.
5.2 Two-Way ANOVA test
- What is two-way ANOVA test?
- Two-way ANOVA test hypotheses
- Assumptions of two-way ANOVA test
- Compute two-way ANOVA test in R: balanced designs
- Visualize your data
- Compute two-way ANOVA test
- Interpret the results
- Compute some summary statistics
- Multiple pairwise-comparison between the means of groups
- Tukey multiple pairewise-comparisons
- Multiple comparisons using multcomp package
- Pairwise t-test
- Check ANOVA assumptions: test validity?
- Check the homogeneity of variance assumption
- Check the normality assumption
- Compute two-way ANOVA test in R for unbalanced designs
Image may be NSFW.
Clik here to view.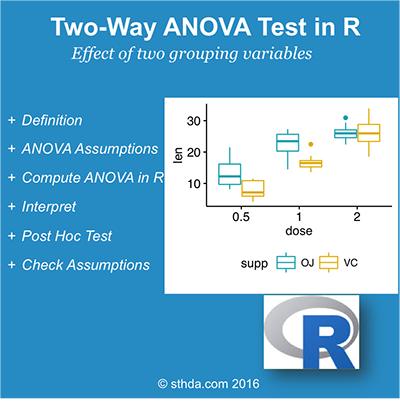
Read more: —>Two-Way ANOVA Test in R.
6 MANOVA test: Multivariate analysis of variance
- What is MANOVA test?
- Assumptions of MANOVA
- Interpretation of MANOVA
- Compute MANOVA in R
Image may be NSFW.
Clik here to view.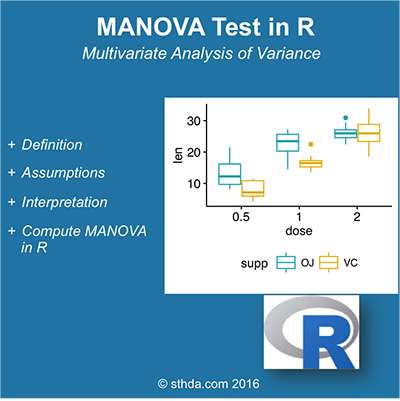
Read more: —>MANOVA Test in R: Multivariate Analysis of Variance.
7 Kruskal-Wallis test
- What is Kruskal-Wallis test?
- Visualize your data and compute Kruskal-Wallis test in R
- Visualize the data using box plots
- Compute Kruskal-Wallis test
- Multiple pairwise-comparison between groups
Image may be NSFW.
Clik here to view.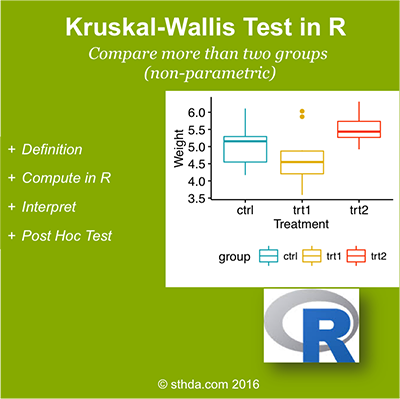
Read more: —>Kruskal-Wallis Test in R (non parametric alternative to one-way ANOVA).
8 See also
9 Infos
This analysis has been performed using R statistical software (ver. 3.2.4).