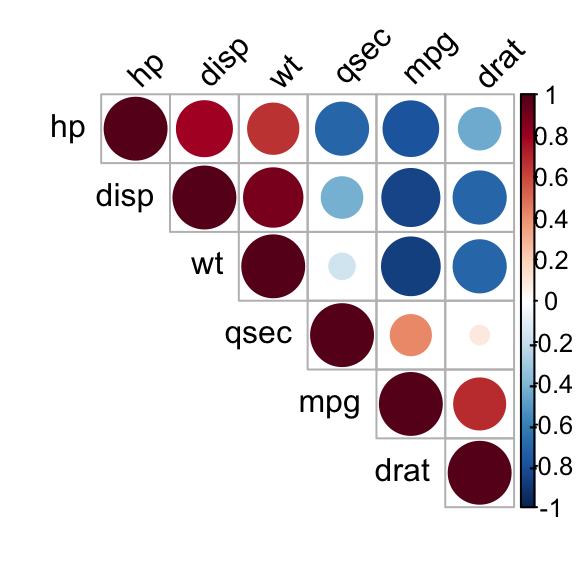
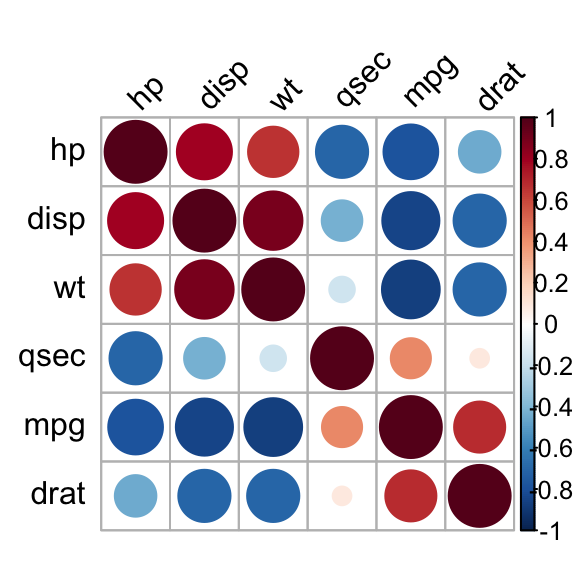
Correlation matrix analysis is very useful to study dependences or associations between variables. This article provides a custom R function, rquery.cormat(), for calculating and visualizing easily acorrelation matrix.The result is a list containing, the correlation coefficient tables and the p-values of the correlations. In the result, the variables are reordered according to the level of the correlation which can help to quickly identify the most associated variables. A graph is also generated to visualize the correlation matrix using a correlogram or a heatmap.
Prerequisites
The rquery.cormat function requires the installation of corrplot package. Before proceeding, install it using he following R code :
install.packages("corrplot")To use the rquery.cormat function, you can source it as follow :
source("http://www.sthda.com/upload/rquery_cormat.r")The R code of rquery.cormat function is provided at the end of this document.
Example of data
The mtcars data is used in the following examples :
mydata <- mtcars[, c(1,3,4,5,6,7)]
head(mydata)
mpg disp hp drat wt qsec
Mazda RX4 21.0 160 110 3.90 2.620 16.46
Mazda RX4 Wag 21.0 160 110 3.90 2.875 17.02
Datsun 710 22.8 108 93 3.85 2.320 18.61
Hornet 4 Drive 21.4 258 110 3.08 3.215 19.44
Hornet Sportabout 18.7 360 175 3.15 3.440 17.02
Valiant 18.1 225 105 2.76 3.460 20.22Computing the correlation matrix
rquery.cormat(mydata)$r
hp disp wt qsec mpg drat
hp 1
disp 0.79 1
wt 0.66 0.89 1
qsec -0.71 -0.43 -0.17 1
mpg -0.78 -0.85 -0.87 0.42 1
drat -0.45 -0.71 -0.71 0.091 0.68 1
$p
hp disp wt qsec mpg drat
hp 0
disp 7.1e-08 0
wt 4.1e-05 1.2e-11 0
qsec 5.8e-06 0.013 0.34 0
mpg 1.8e-07 9.4e-10 1.3e-10 0.017 0
drat 0.01 5.3e-06 4.8e-06 0.62 1.8e-05 0
$sym
hp disp wt qsec mpg drat
hp 1
disp , 1
wt , + 1
qsec , . 1
mpg , + + . 1
drat . , , , 1
attr(,"legend")
[1] 0 ' ' 0.3 '.' 0.6 ',' 0.8 '+' 0.9 '*' 0.95 'B' 1
Correlogram, Heatmap
The result of rquery.cormat function is a list containing the following components :
- r : The table of correlation coefficients
- p : Table of p-values corresponding to the significance levels of the correlations
sym : A representation of the correlation matrix in which coefficients are replaced by symbols according to the strength of the dependence. For more description, see this article: Visualize correlation matrix using symnum function
- In the generated graph, negative correlations are in blue and positive ones in red color.
Note that in the result above, only the lower triangle of the correlation matrix is shown by default. You can use the following R script to get the upper triangle or the full correlation matrix.
Upper triangle of the correlation matrix
rquery.cormat(mydata, type="upper")$r
hp disp wt qsec mpg drat
hp 1 0.79 0.66 -0.71 -0.78 -0.45
disp 1 0.89 -0.43 -0.85 -0.71
wt 1 -0.17 -0.87 -0.71
qsec 1 0.42 0.091
mpg 1 0.68
drat 1
$p
hp disp wt qsec mpg drat
hp 0 7.1e-08 4.1e-05 5.8e-06 1.8e-07 0.01
disp 0 1.2e-11 0.013 9.4e-10 5.3e-06
wt 0 0.34 1.3e-10 4.8e-06
qsec 0 0.017 0.62
mpg 0 1.8e-05
drat 0
$sym
hp disp wt qsec mpg drat
hp 1 , , , , .
disp 1 + . + ,
wt 1 + ,
qsec 1 .
mpg 1 ,
drat 1
attr(,"legend")
[1] 0 ' ' 0.3 '.' 0.6 ',' 0.8 '+' 0.9 '*' 0.95 'B' 1
Full correlation matrix
rquery.cormat(mydata, type="full")$r
hp disp wt qsec mpg drat
hp 1.00 0.79 0.66 -0.710 -0.78 -0.450
disp 0.79 1.00 0.89 -0.430 -0.85 -0.710
wt 0.66 0.89 1.00 -0.170 -0.87 -0.710
qsec -0.71 -0.43 -0.17 1.000 0.42 0.091
mpg -0.78 -0.85 -0.87 0.420 1.00 0.680
drat -0.45 -0.71 -0.71 0.091 0.68 1.000
$p
hp disp wt qsec mpg drat
hp 0.0e+00 7.1e-08 4.1e-05 5.8e-06 1.8e-07 1.0e-02
disp 7.1e-08 0.0e+00 1.2e-11 1.3e-02 9.4e-10 5.3e-06
wt 4.1e-05 1.2e-11 0.0e+00 3.4e-01 1.3e-10 4.8e-06
qsec 5.8e-06 1.3e-02 3.4e-01 0.0e+00 1.7e-02 6.2e-01
mpg 1.8e-07 9.4e-10 1.3e-10 1.7e-02 0.0e+00 1.8e-05
drat 1.0e-02 5.3e-06 4.8e-06 6.2e-01 1.8e-05 0.0e+00
$sym
hp disp wt qsec mpg drat
hp 1
disp , 1
wt , + 1
qsec , . 1
mpg , + + . 1
drat . , , , 1
attr(,"legend")
[1] 0 ' ' 0.3 '.' 0.6 ',' 0.8 '+' 0.9 '*' 0.95 'B' 1
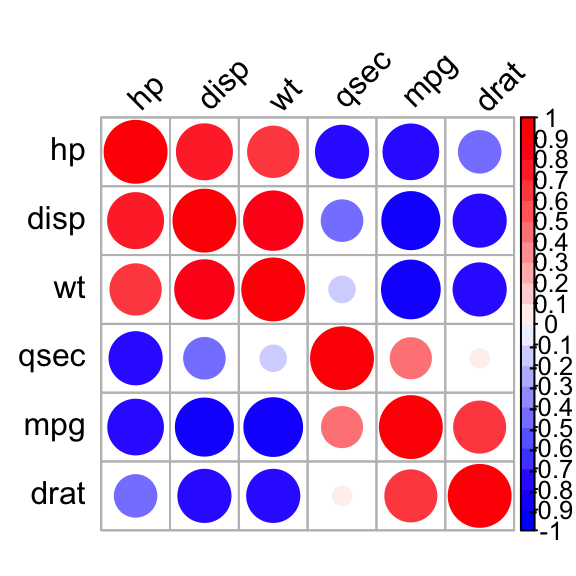
Change the colors of the correlogram
col<- colorRampPalette(c("blue", "white", "red"))(20)
cormat<-rquery.cormat(mydata, type="full", col=col)
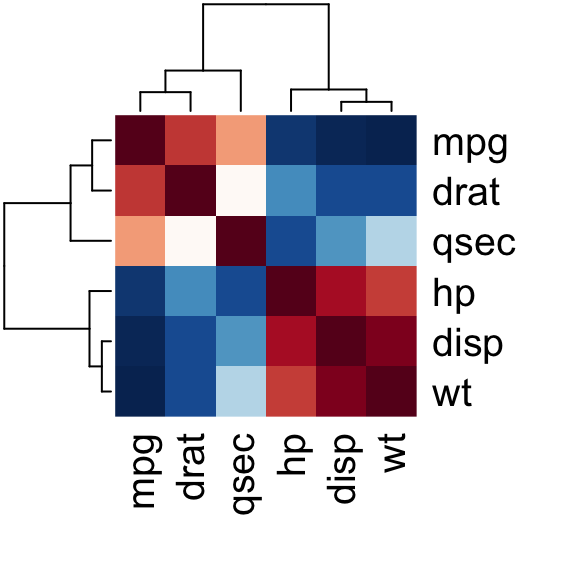
Draw a heatmap
cormat<-rquery.cormat(mydata, graphType="heatmap")
To calculate the correlation matrix without plotting the graph, you can use the following R script :
rquery.cormat(mydata, graph=FALSE)Format the correlation table
The R code below can be used to format the correlation matrix into a table of four columns containing :
- The names of rows/columns
- The correlation coefficients
- The p-values
For this end, use the argument : type=“flatten”
rquery.cormat(mydata, type="flatten", graph=FALSE)$r
row column cor p
1 hp disp 0.790 7.1e-08
2 hp wt 0.660 4.1e-05
3 disp wt 0.890 1.2e-11
4 hp qsec -0.710 5.8e-06
5 disp qsec -0.430 1.3e-02
6 wt qsec -0.170 3.4e-01
7 hp mpg -0.780 1.8e-07
8 disp mpg -0.850 9.4e-10
9 wt mpg -0.870 1.3e-10
10 qsec mpg 0.420 1.7e-02
11 hp drat -0.450 1.0e-02
12 disp drat -0.710 5.3e-06
13 wt drat -0.710 4.8e-06
14 qsec drat 0.091 6.2e-01
15 mpg drat 0.680 1.8e-05
$p
NULL
$sym
NULLDescription of rquery.cormat function
A simplified format of the function is :
rquery.cormat(x, type=c('lower', 'upper', 'full', 'flatten'),
              graph=TRUE, graphType=c("correlogram", "heatmap"),
              col=NULL, ...)
Description of the arguments:
- x : matrix of data values
- type : Possible values are “lower” (default), “upper”, “full” or “flatten”. It displays the lower or upper triangular of the matrix, full or flatten matrix.
- graph : if TRUE, a correlogram or heatmap is generated to visualize the correlation matrix.
- graphType : Type of graphs. Possible values are “correlogram” or “heatmap”.
- col: colors to use for the correlogram or the heatmap.
- … : Further arguments to be passed to cor() or cor.test() function.
R code of the rquery.cormat function:
#+++++++++++++++++++++++++
# Computing of correlation matrix
#+++++++++++++++++++++++++
# Required package : corrplot

# x : matrix
# type: possible values are "lower" (default), "upper", "full" or "flatten";
  #display lower or upper triangular of the matrix, full  or flatten matrix.
# graph : if TRUE, a correlogram or heatmap is plotted
# graphType : possible values are "correlogram" or "heatmap"
# col: colors to use for the correlogram
# ... : Further arguments to be passed to cor or cor.test function

# Result is a list including the following components :
  # r : correlation matrix, p :  p-values
  # sym : Symbolic number coding of the correlation matrix
rquery.cormat<-function(x,
                        type=c('lower', 'upper', 'full', 'flatten'),
                        graph=TRUE,
                        graphType=c("correlogram", "heatmap"),
                        col=NULL, ...)
{
  library(corrplot)
  # Helper functions
  #+++++++++++++++++
  # Compute the matrix of correlation p-values
  cor.pmat <- function(x, ...) {
    mat <- as.matrix(x)
    n <- ncol(mat)
    p.mat<- matrix(NA, n, n)
    diag(p.mat) <- 0
    for (i in 1:(n - 1)) {
      for (j in (i + 1):n) {
        tmp <- cor.test(mat[, i], mat[, j], ...)
        p.mat[i, j] <- p.mat[j, i] <- tmp$p.value
      }
    }
    colnames(p.mat) <- rownames(p.mat) <- colnames(mat)
    p.mat
  }
  # Get lower triangle of the matrix
  getLower.tri<-function(mat){
    upper<-mat
    upper[upper.tri(mat)]<-""
    mat<-as.data.frame(upper)
    mat
  }
  # Get upper triangle of the matrix
  getUpper.tri<-function(mat){
    lt<-mat
    lt[lower.tri(mat)]<-""
    mat<-as.data.frame(lt)
    mat
  }
  # Get flatten matrix
  flattenCorrMatrix <- function(cormat, pmat) {
    ut <- upper.tri(cormat)
    data.frame(
      row = rownames(cormat)[row(cormat)[ut]],
      column = rownames(cormat)[col(cormat)[ut]],
      cor  =(cormat)[ut],
      p = pmat[ut]
    )
  }
  # Define color
  if (is.null(col)) {
    col <- colorRampPalette(
            c("#67001F", "#B2182B", "#D6604D", "#F4A582",
              "#FDDBC7", "#FFFFFF", "#D1E5F0", "#92C5DE",
             "#4393C3", "#2166AC", "#053061"))(200)
    col<-rev(col)
  }

  # Correlation matrix
  cormat<-signif(cor(x, use = "complete.obs", ...),2)
  pmat<-signif(cor.pmat(x, ...),2)
  # Reorder correlation matrix
  ord<-corrMatOrder(cormat, order="hclust")
  cormat<-cormat[ord, ord]
  pmat<-pmat[ord, ord]
  # Replace correlation coeff by symbols
  sym<-symnum(cormat, abbr.colnames=FALSE)
  # Correlogram
  if(graph & graphType[1]=="correlogram"){
    corrplot(cormat, type=ifelse(type[1]=="flatten", "lower", type[1]),
             tl.col="black", tl.srt=45,col=col,...)
  }
  else if(graphType[1]=="heatmap")
    heatmap(cormat, col=col, symm=TRUE)
  # Get lower/upper triangle
  if(type[1]=="lower"){
    cormat<-getLower.tri(cormat)
    pmat<-getLower.tri(pmat)
  }
  else if(type[1]=="upper"){
    cormat<-getUpper.tri(cormat)
    pmat<-getUpper.tri(pmat)
    sym=t(sym)
  }
  else if(type[1]=="flatten"){
    cormat<-flattenCorrMatrix(cormat, pmat)
    pmat=NULL
    sym=NULL
  }
  list(r=cormat, p=pmat, sym=sym)
}
Infos
This analysis has been performed using R (ver. 3.2.4).