To add a text to a plot generated using ggplot2, the functions below can be used :
- geom_text()
- annotate()
- annotation_custom()
Create some data
df <- data.frame(x=1:3, y=1:3,
               name=c("Text1", "Text with \n 2 lines", "Text3"))
head(df)
## x y name
## 1 1 1 Text1
## 2 2 2 Text with \n 2 lines
## 3 3 3 Text3Text annotations using the function geom_text
library(ggplot2)

# Simple scatter plot
sp <- ggplot(data = df, aes(x, y, label=name)) +
  geom_point()+xlim(0,3.5)+ylim(0,3.5)

# Add texts
sp + geom_text()

# Change the size of the texts
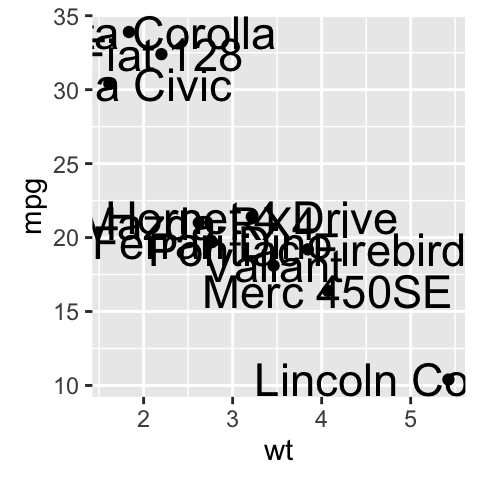
sp + geom_text(size=6)

# Change vertical and horizontal adjustement
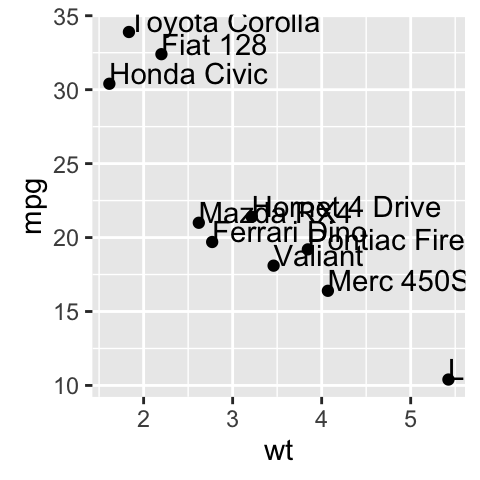
sp +  geom_text(hjust=0, vjust=0)

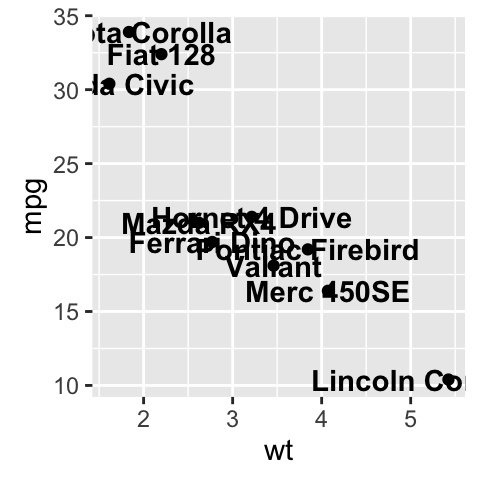
# Change fontface. Allowed values : 1(normal),
# 2(bold), 3(italic), 4(bold.italic)
sp + geom_text(aes(fontface=2))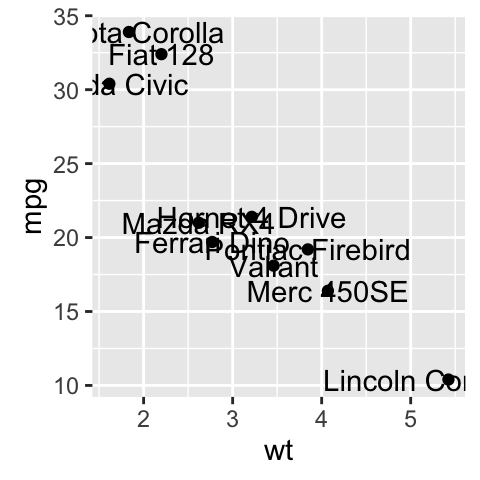
Change the text color and size by groups
Its possible to change the appearance of the texts using aesthetics (color, size, ) :
sp2 <- ggplot(mtcars, aes(x=wt, y=mpg, label=rownames(mtcars)))+
  geom_point()

# Color by groups
sp2 + geom_text(aes(color=factor(cyl)))
# Set the size of the text using a continuous variable
sp2 + geom_text(aes(size=wt))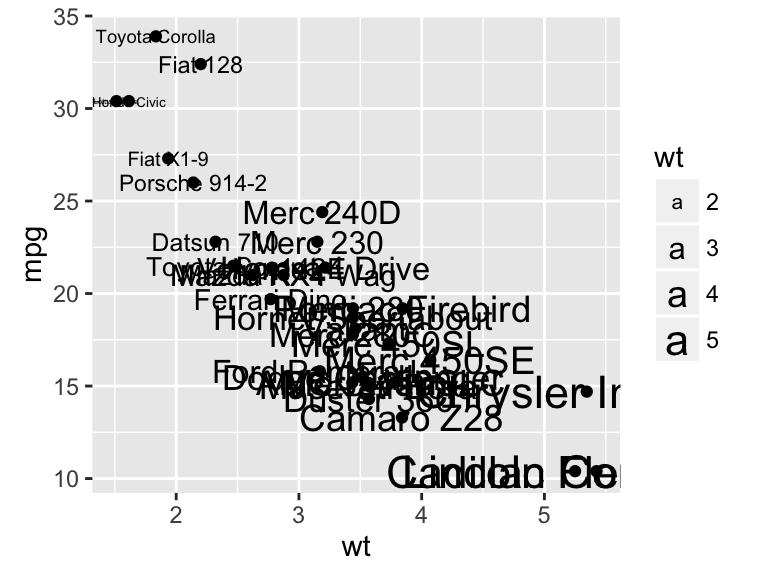
sp2 + geom_text(aes(size=wt)) + scale_size(range=c(3,6))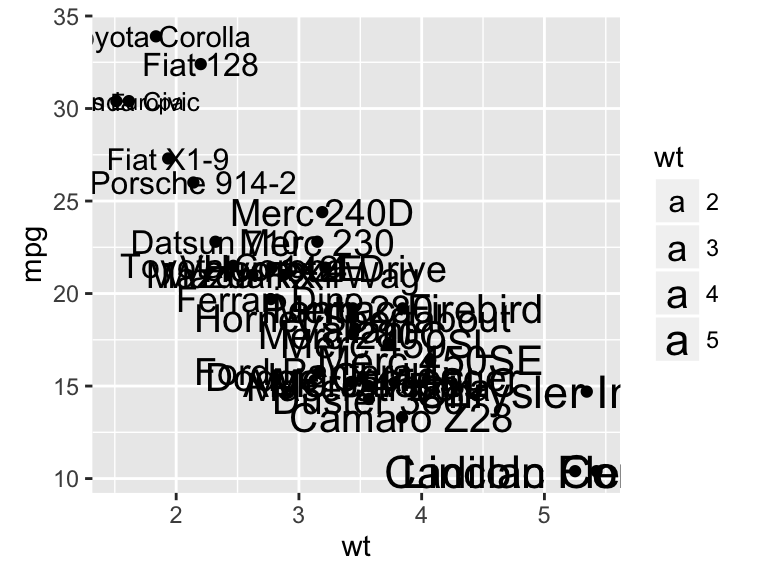
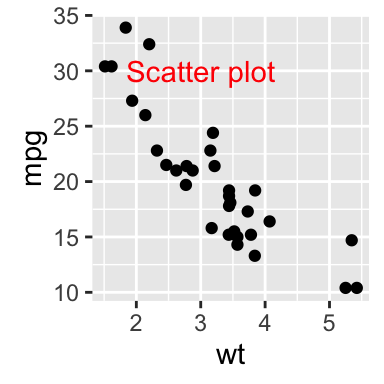
Add a text annotation at a particular coordinate
The functions geom_text() and annotate() can be used :
# Solution 1
sp2 + geom_text(x=3, y=30, label="Scatter plot")

# Solution 2
sp2 + annotate(geom="text", x=3, y=30, label="Scatter plot",
              color="red")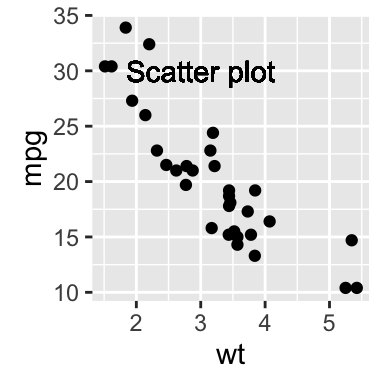
annotation_custom : Add a static text annotation in the top-right, top-left,
The functions annotation_custom() and textGrob() are used to add static annotations which are the same in every panel.The grid package is required :
library(grid)
# Create a text
grob <- grobTree(textGrob("Scatter plot", x=0.1,  y=0.95, hjust=0,
  gp=gpar(col="red", fontsize=13, fontface="italic")))
# Plot
sp2 + annotation_custom(grob)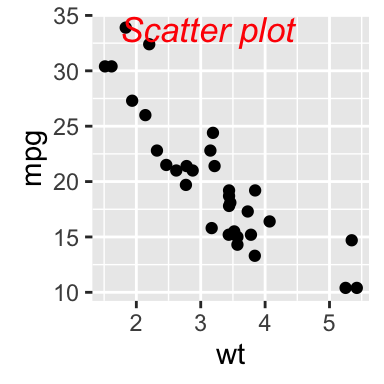
Facet : In the plot below, the annotation is at the same place (in each facet) even if the axis scales vary.
sp2 + annotation_custom(grob)+facet_wrap(~cyl, scales="free")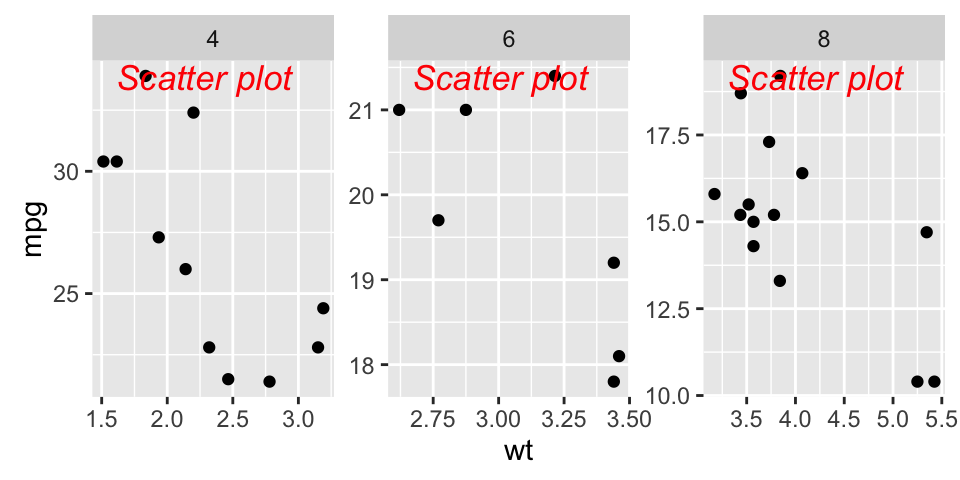
Infos
This analysis has been performed using R software (ver. 3.1.2) and ggplot2 (ver. )