Previously, we described the essentials of R programming and provided quick start guides for importing data into R as well as visualizing data using R base graphs.
This chapter describes how to create static and interactive three-dimension (3D) graphs. We provide also an R package named graph3d to easily build and customize, step by step, 3D graphs in R software.
How this chapter is organized?
- Static 3D Scatter Plots
- Interactive 3D Graphs
Simple 3D Scatter Plots: scatterplot3d Package
- Install and load scaterplot3d
- Prepare the data
- The function scatterplot3d()
- Basic 3D scatter plots
- Change the main title and axis labels
- Change the shape and the color of points
- Change point shapes by groups
- Change point colors by groups
- Change the global appearance of the graph
- Remove the box around the plot
- Add grids on scatterplot3d
- Add bars
- Modification of scatterplot3d output
- Add legends
- Add point labels
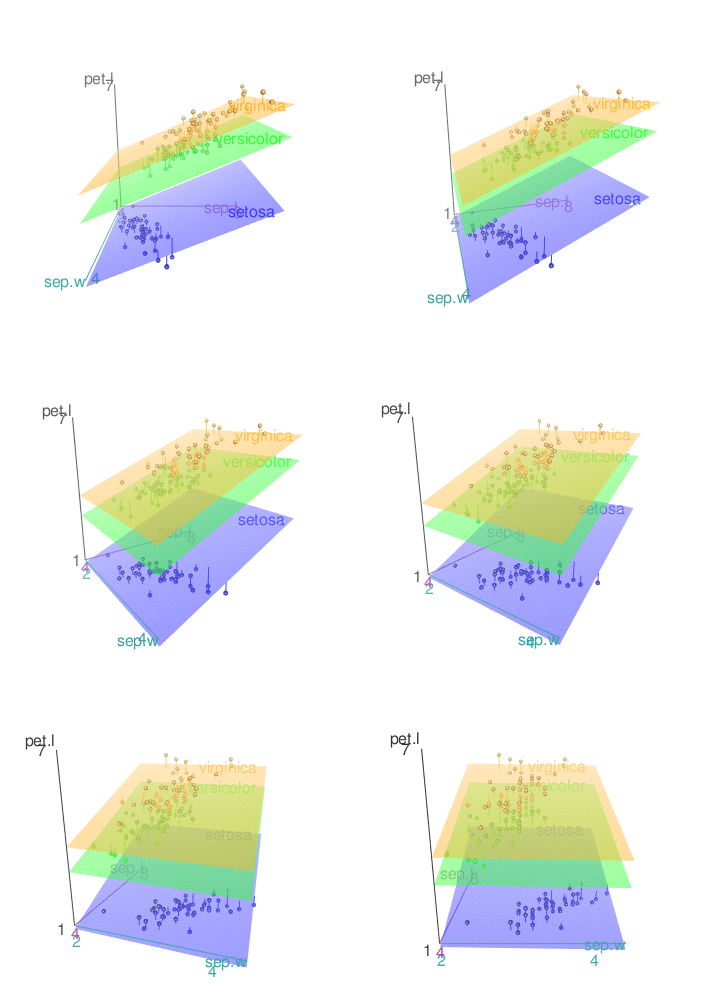
- Add regression plane and supplementary points

Read more: —>Simple 3D Scatter Plots: scatterplot3d Package.
Advanced 3D Graphs: plot3D Package
- Install and load plot3D package
- Prepare the data
- Scatter plots
- Basic scatter plot
- Change the type of the box around the plot
- Change the color by groups
- Change the position of the legend
- 3D viewing direction
- Titles and axis labels
- Tick marks and labels
- Add points and text to an existing plot
- Line plots
- Add confidence interval
- 3D fancy Scatter plot with small dots on basal plane
- Regression plane
- text3D: plot 3-dimensionnal texts
- text3D and scatter3D
- 3D Histogram
- scatter2D: 2D scatter plot
- text2D
- Interactive plot

Read more: —>Advanced 3D Graphs: plot3D Package.
Interactive 3D Scatter Plots
- Install and load required packages
- Prepare the data
- The function scatter3d
- Basic 3D scatter plots
- Plot the points by groups
- Default plot
- Remove the surfaces
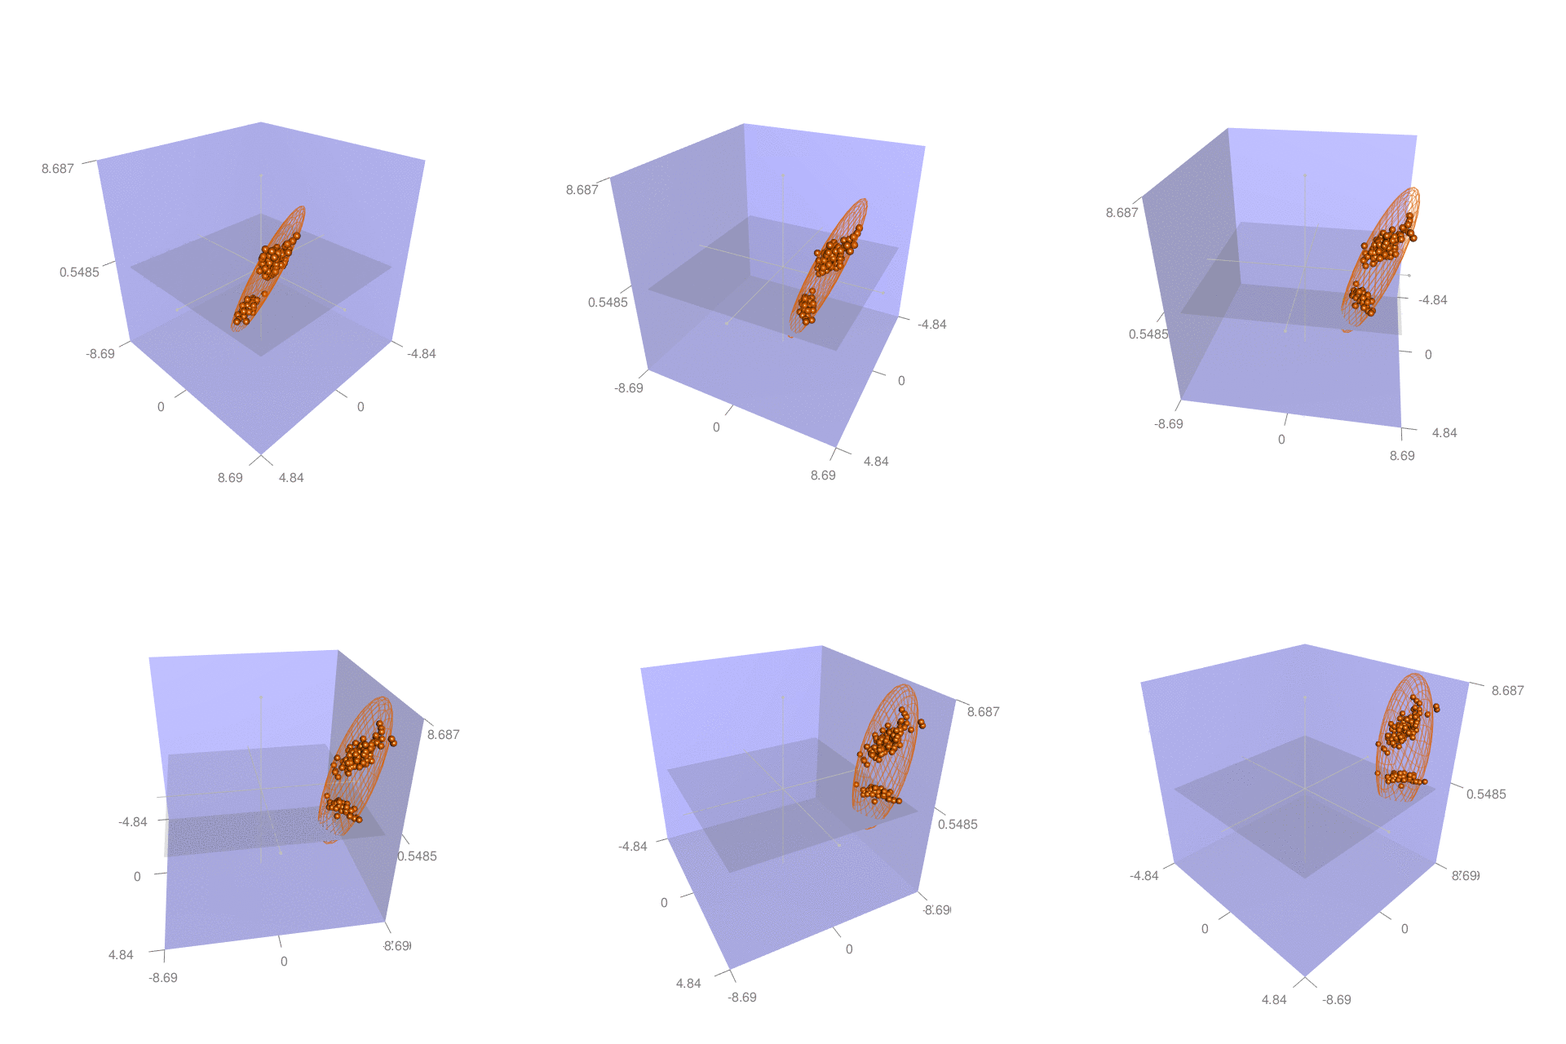
- Add concentration ellipsoids
- Change point colors by groups
- Axes
- Change axis labels
- Remove axis scales
- Change axis colors
- Add text labels for the points
- Export images

3d scatter plot rgl
Read more: —>Interactive 3D Scatter Plots.
Guide to RGL 3D Visualization System
- Install the RGL package
- Load the RGL package
- Prepare the data
- Start and close RGL device
- 3D scatter plot
- Basic graph
- Change the background and point colors
- Change the shape of points
- rgl_init(): A custom function to initialize RGL device
- Add a bounding box decoration
- Add axis lines and labels
- Set the aspect ratios of the x, y and z axes
- Change the color of points by groups
- Change the shape of points
- Add an ellipse of concentration
- Regression plane
- Create a movie of RGL scene
- Export images as png or pdf
- Export the plot into an interactive HTML file
- Select a rectangle in an RGL scene
- Identify points in a plot
- R3D Interface
- RGL functions
- Device management
- Shape functions
- Scene management
- Setup the environment
- Appearance setup
- Export screenshot
- Assign focus to an RGL window

RGL movie 3d
Read more —>Guide to RGL 3D Visualization System.
See also
Infos
This analysis has been performed using R statistical software (ver. 3.2.4).