Previously, we described the essentials of R programming and provided quick start guides for importing data into R.
This chapter describes how to plot data in R and make elegant data visualization.
How this chapter is organized?
Lattice Graphs
Lattice package is a powerful and elegant data visualization system that aims to improve on base R graphs.

- xyplot(): Scatter plot
- cloud(): 3D scatter plot
- Box plot, Dot plot, Strip plot
- Density plot and Histogram
Read more: —>Lattice Graphs.
Ggplot2
ggplot2 is a powerful and a flexible R package, implemented by Hadley Wickham, for producing elegant graphics.

- ggplots
- ggplot2 Graphical Parameters
- Main title, axis labels and legend title
- Legend position and appearance
- Change colors automatically and manually
- Point shapes, colors and size
- Add text annotations to a graph
- Line types
- Themes and background colors
- Axis scales and transformations
- Axis ticks: customize tick marks and labels, reorder and select items
- Add straight lines to a plot: horizontal, vertical and regression lines
- Rotate a plot: flip and reverse
- Faceting: split a plot into a matrix of panels
- Cheat Sheets
Read more: —>ggplot2 essentials.
3D Graphics

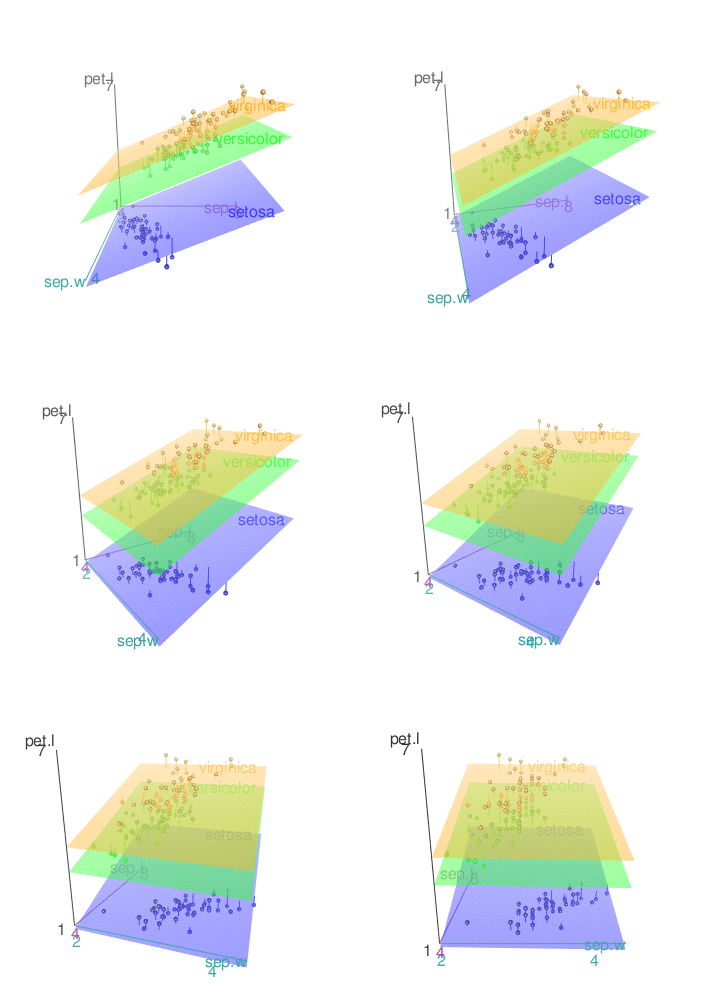
3d scatter plot rgl
- Static 3D Scatter Plots
- Interactive 3D Graphs
Read more: —>3D Graphics.
Infos
This analysis has been performed using R statistical software (ver. 3.2.4).
