Quantcast
Channel: Easy Guides
Viewing all 183 articles
Browse latest View live

ggplot2 - Easy way to mix multiple graphs on the same page - R software and data visualization

$
0
0


To arrange multiple ggplot2 graphs on the same page, the standard R functions - par() and layout() - cannot be used.

This R tutorial will show you, step by step, how to put several ggplots on a single page.

The functions grid.arrange()[in the package gridExtra] and plot_grid()[in the package cowplot], will be used.

Install and load required packages

Install and load the package gridExtra

install.packages("gridExtra")
library("gridExtra")

Install and load the package cowplot

cowplot can be installed as follow:

install.packages("cowplot")

OR

as follow using devtools package (devtools should be installed before using the code below):

devtools::install_github("wilkelab/cowplot")

Load cowplot:

library("cowplot")

Prepare some data

ToothGrowth data is used :

df <- ToothGrowth
# Convert the variable dose from a numeric to a factor variable
df$dose <- as.factor(df$dose)
head(df)
##    len supp dose
## 1  4.2   VC  0.5
## 2 11.5   VC  0.5
## 3  7.3   VC  0.5
## 4  5.8   VC  0.5
## 5  6.4   VC  0.5
## 6 10.0   VC  0.5

Cowplot: Publication-ready plots

The cowplot package is an extension to ggplot2 and it can be used to provide a publication-ready plots.

Basic plots

library(cowplot)
# Default plot
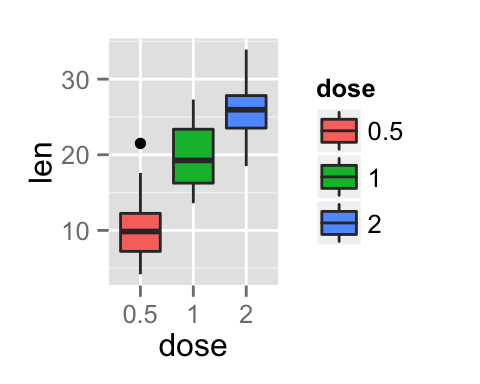
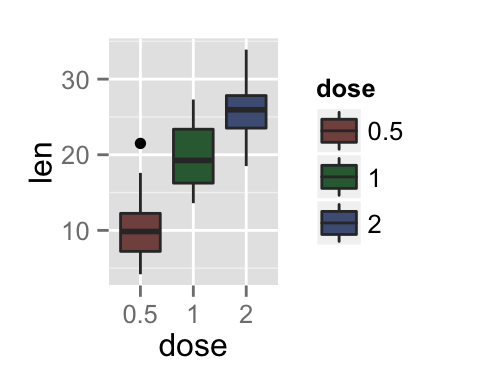
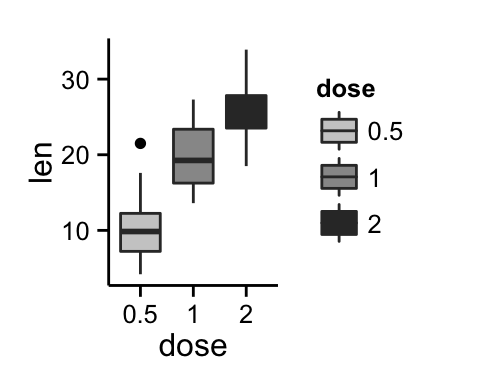
bp <- ggplot(df, aes(x=dose, y=len, color=dose)) +
  geom_boxplot() + 
  theme(legend.position = "none")
bp

# Add gridlines
bp + background_grid(major = "xy", minor = "none")
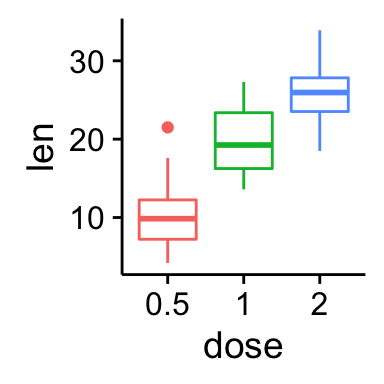
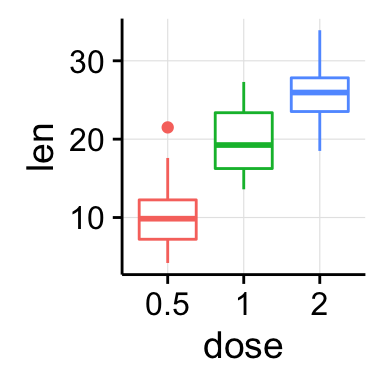
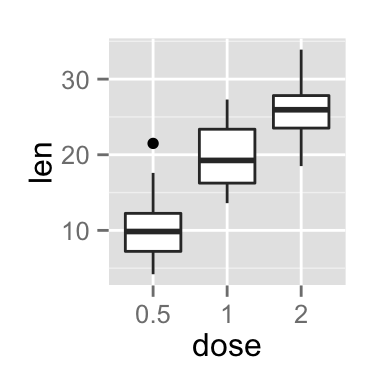
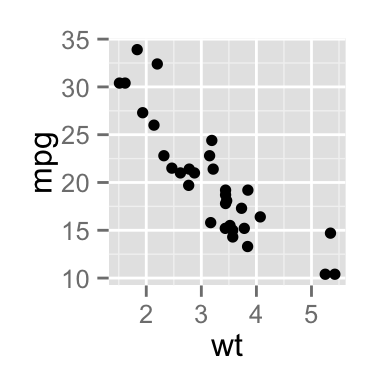
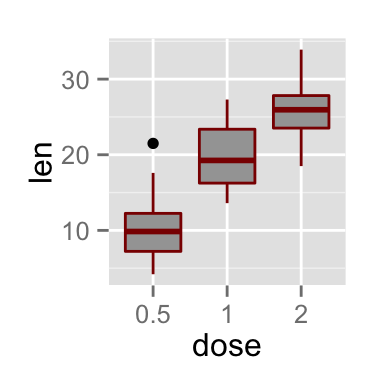
ggplot2 arrange multiple graphs on the same page, R software and data visualizationggplot2 arrange multiple graphs on the same page, R software and data visualization

Recall that, the function ggsave()[in ggplot2 package] can be used to save ggplots. However, when working with cowplot, the function save_plot() [in cowplot package] is preferred. It’s an alternative to ggsave with a better support for multi-figure plots.

save_plot("mpg.pdf", plot.mpg,
          base_aspect_ratio = 1.3 # make room for figure legend
          )

Arranging multiple graphs using cowplot

# Scatter plot
sp <- ggplot(mpg, aes(x = cty, y = hwy, colour = factor(cyl)))+ 
  geom_point(size=2.5)
sp

# Bar plot
bp <- ggplot(diamonds, aes(clarity, fill = cut)) +
  geom_bar() +
  theme(axis.text.x = element_text(angle=70, vjust=0.5))
bp
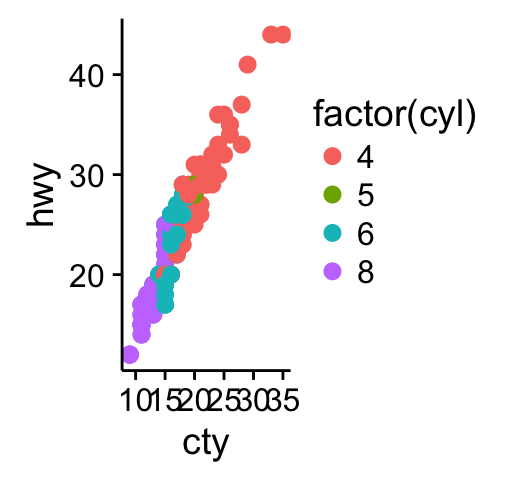
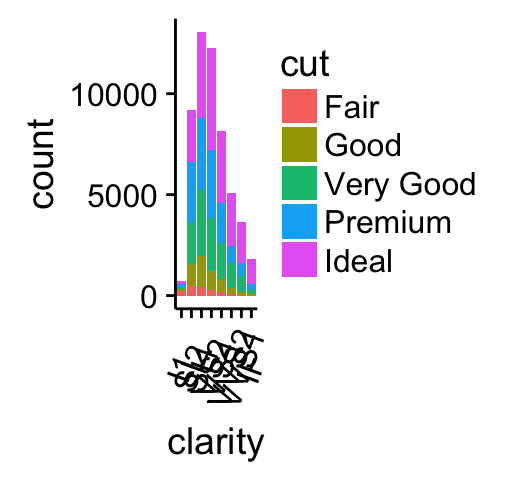
ggplot2 arrange multiple graphs on the same page, R software and data visualizationggplot2 arrange multiple graphs on the same page, R software and data visualization

Combine the two plots (the scatter plot and the bar plot):

plot_grid(sp, bp, labels=c("A", "B"), ncol = 2, nrow = 1)
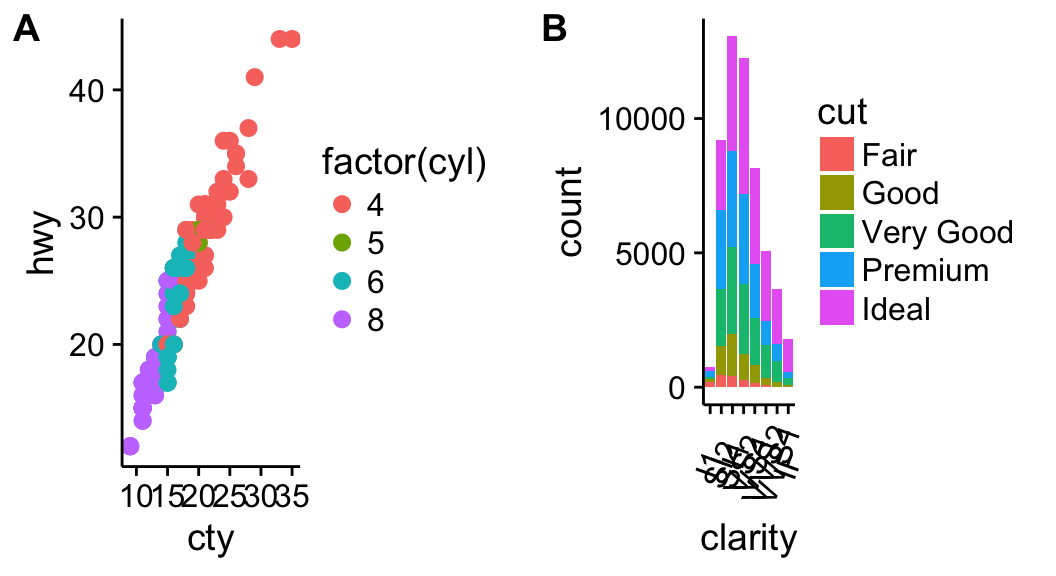
ggplot2 arrange multiple graphs on the same page, R software and data visualization

The function draw_plot() can be used to place graphs at particular locations with a particular sizes. The format of the function is:

draw_plot(plot, x = 0, y = 0, width = 1, height = 1)
  • plot: the plot to place (ggplot2 or a gtable)
  • x: The x location of the lower left corner of the plot.
  • y: The y location of the lower left corner of the plot.
  • width, height: the width and the height of the plot

The function ggdraw() is used to initialize an empty drawing canvas.

plot.iris <- ggplot(iris, aes(Sepal.Length, Sepal.Width)) + 
  geom_point() + facet_grid(. ~ Species) + stat_smooth(method = "lm") +
  background_grid(major = 'y', minor = "none") + # add thin horizontal lines 
  panel_border() # and a border around each panel
# plot.mpt and plot.diamonds were defined earlier
ggdraw() +
  draw_plot(plot.iris, 0, .5, 1, .5) +
  draw_plot(sp, 0, 0, .5, .5) +
  draw_plot(bp, .5, 0, .5, .5) +
  draw_plot_label(c("A", "B", "C"), c(0, 0, 0.5), c(1, 0.5, 0.5), size = 15)

ggplot2 arrange multiple graphs on the same page, R software and data visualization

grid.arrange: Create and arrange multiple plots

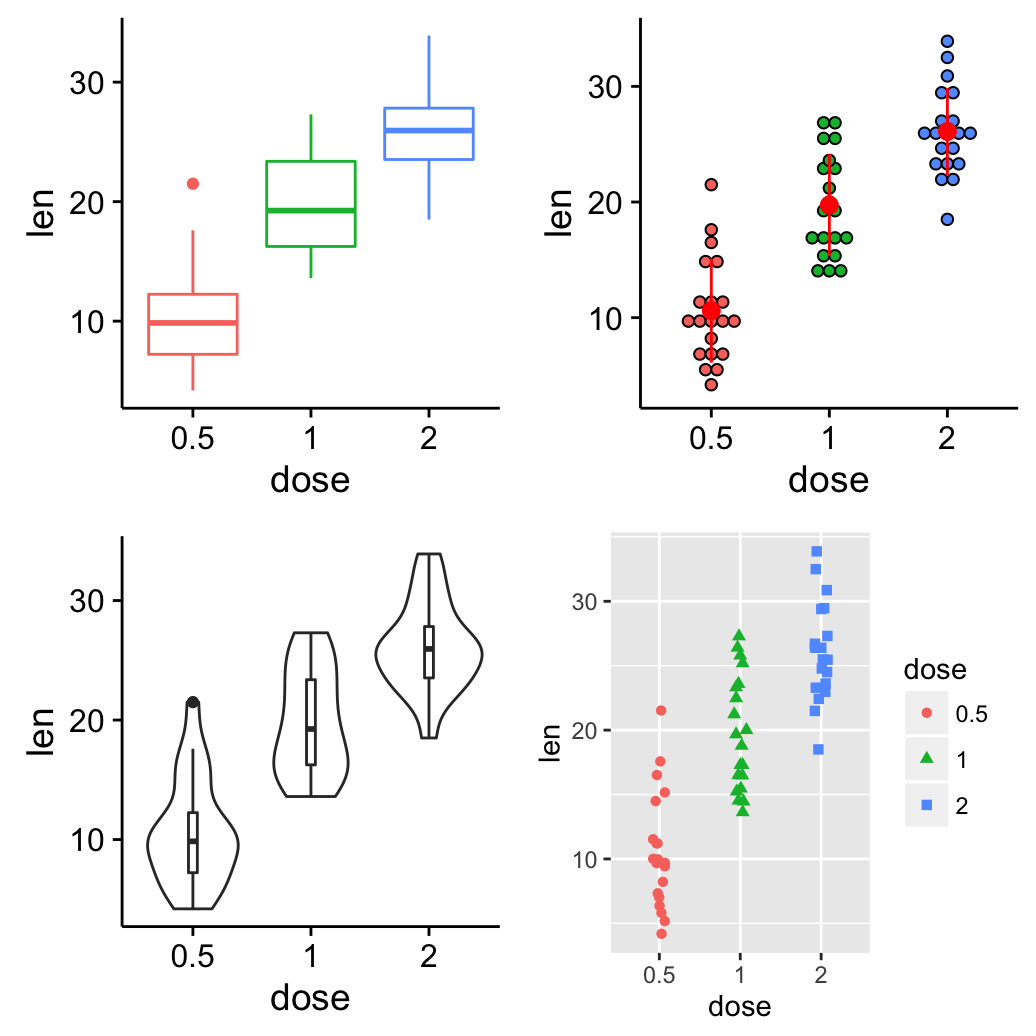
The R code below creates a box plot, a dot plot, a violin plot and a strip chart (jitter plot) :

library(ggplot2)
# Create a box plot
bp <- ggplot(df, aes(x=dose, y=len, color=dose)) +
  geom_boxplot() + 
  theme(legend.position = "none")

# Create a dot plot
# Add the mean point and the standard deviation
dp <- ggplot(df, aes(x=dose, y=len, fill=dose)) +
  geom_dotplot(binaxis='y', stackdir='center')+
  stat_summary(fun.data=mean_sdl, mult=1, 
                 geom="pointrange", color="red")+
   theme(legend.position = "none")

# Create a violin plot
vp <- ggplot(df, aes(x=dose, y=len)) +
  geom_violin()+
  geom_boxplot(width=0.1)

# Create a stripchart
sc <- ggplot(df, aes(x=dose, y=len, color=dose, shape=dose)) +
  geom_jitter(position=position_jitter(0.2))+
  theme(legend.position = "none") +
  theme_gray()

Combine the plots using the function grid.arrange() [in gridExtra] :

library(gridExtra)
grid.arrange(bp, dp, vp, sc, ncol=2, nrow =2)
ggplot2 arrange multiple graphs on the same page, R software and data visualization

grid.arrange() and arrangeGrob(): Change column/row span of a plot

Using the R code below:

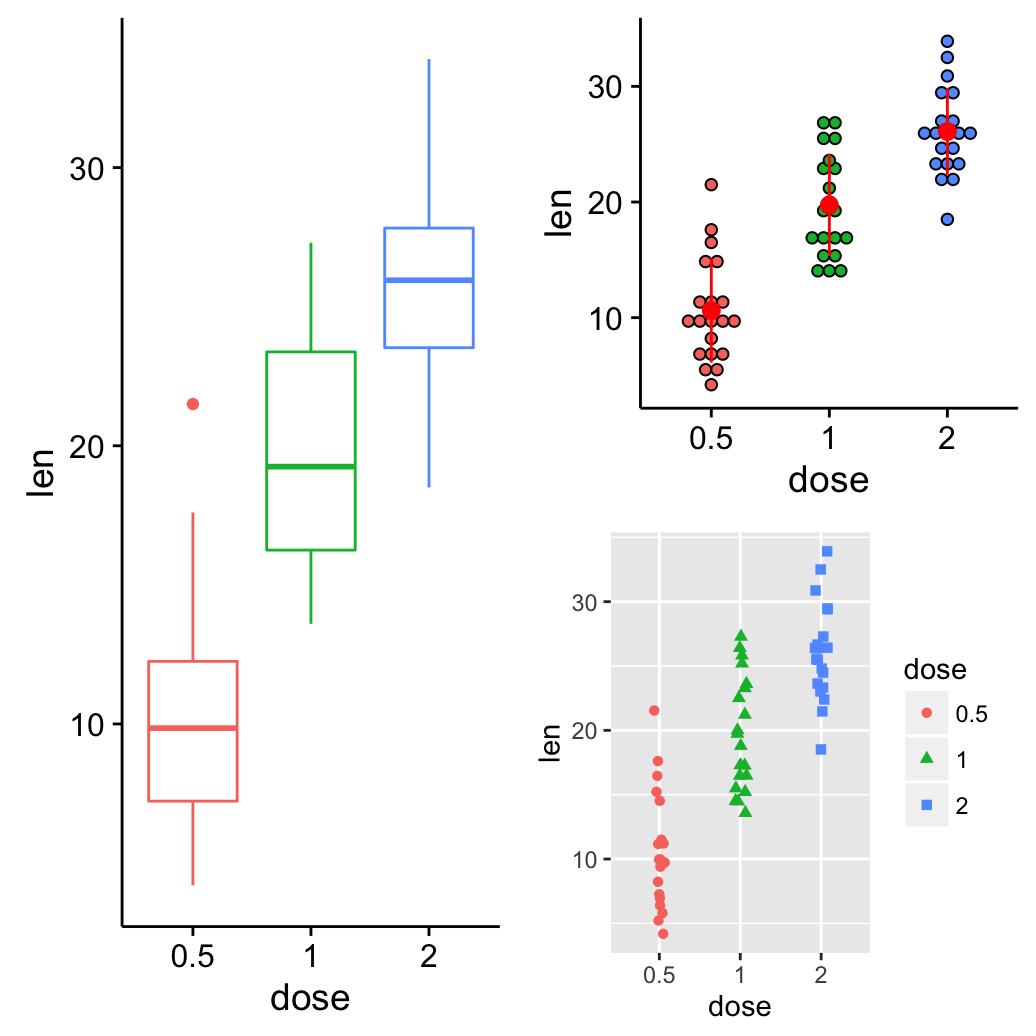
  • The box plot will live in the first column
  • The dot plot and the strip chart will live in the second column
grid.arrange(bp, arrangeGrob(dp, sc), ncol = 2)
ggplot2 arrange multiple graphs on the same page, R software and data visualization

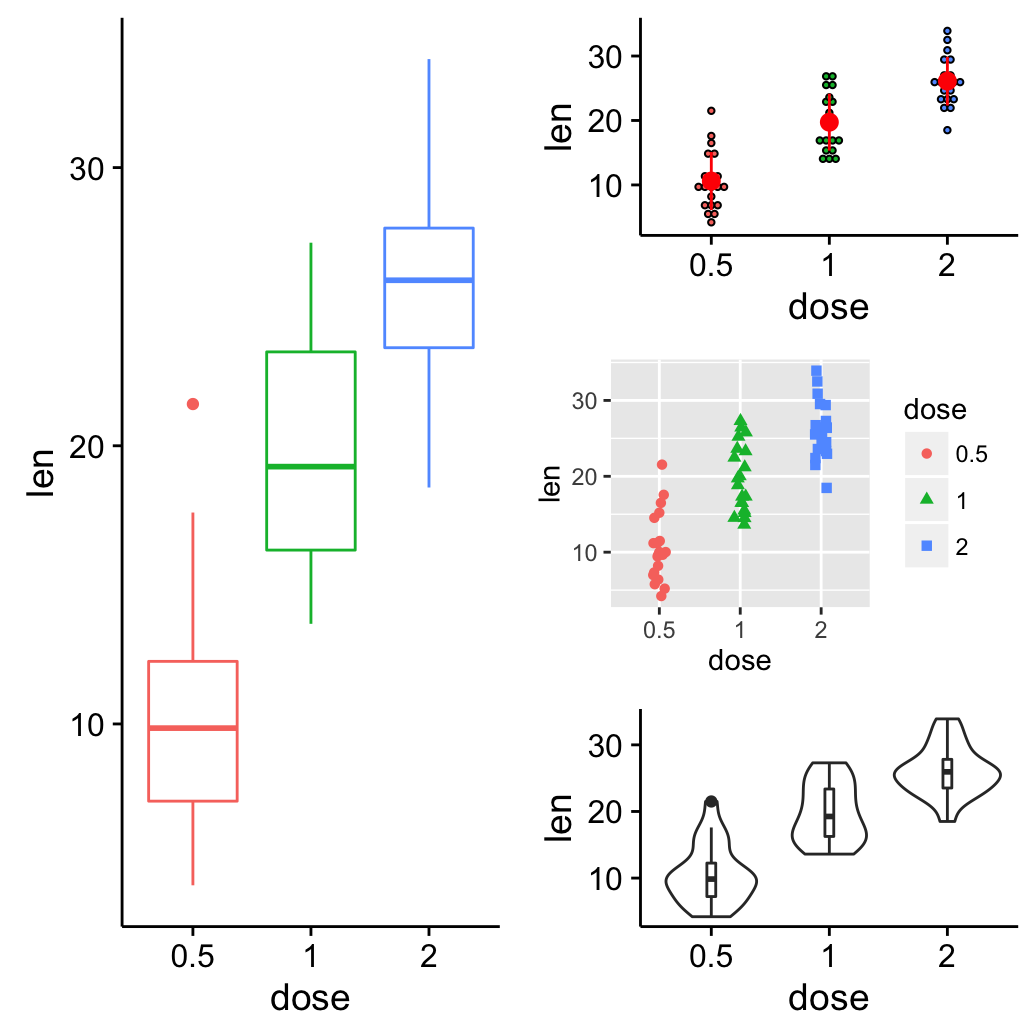
It’s also possible to use the argument layout_matrix in grid.arrange(). In the R code below layout_matrix is a 2X3 matrix (2 columns and three rows). The first column is all 1s, that’s where the first plot lives, spanning the three rows; second column contains plots 2, 3, 4, each occupying one row.

grid.arrange(bp, dp, sc, vp, ncol = 2, 
             layout_matrix = cbind(c(1,1,1), c(2,3,4)))
ggplot2 arrange multiple graphs on the same page, R software and data visualization

Add a common legend for multiple ggplot2 graphs

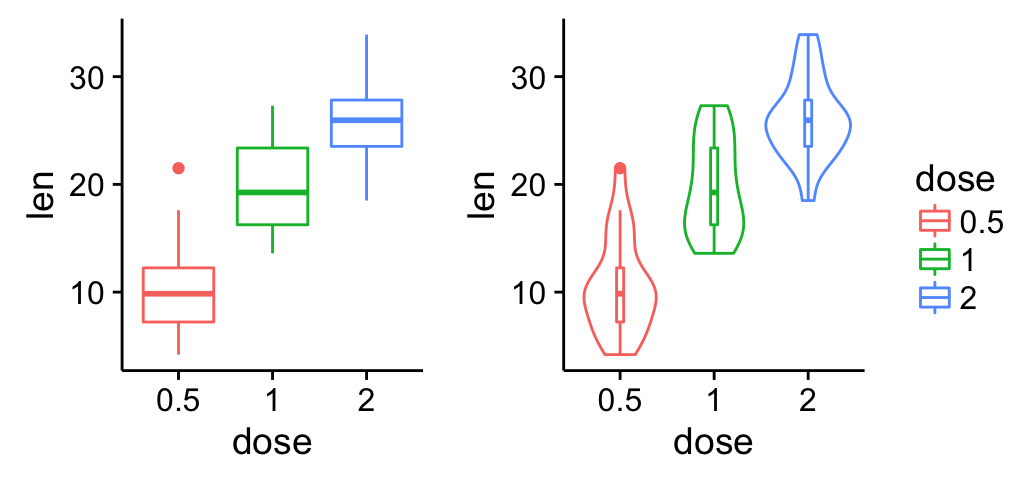
This can be done in four simple steps :

  1. Create the plots : p1, p2, ….
  2. Save the legend of the plot p1 as an external graphical element (called a “grob” in Grid terminology)
  3. Remove the legends from all plots
  4. Draw all the plots with only one legend in the right panel

To save the legend of a ggplot, the helper function below can be used :

library(gridExtra)
get_legend<-function(myggplot){
  tmp <- ggplot_gtable(ggplot_build(myggplot))
  leg <- which(sapply(tmp$grobs, function(x) x$name) == "guide-box")
  legend <- tmp$grobs[[leg]]
  return(legend)
}

(The function above is derived from this forum. )

# 1. Create the plots
#++++++++++++++++++++++++++++++++++
# Create a box plot
bp <- ggplot(df, aes(x=dose, y=len, color=dose)) +
  geom_boxplot()

# Create a violin plot
vp <- ggplot(df, aes(x=dose, y=len, color=dose)) +
  geom_violin()+
  geom_boxplot(width=0.1)+
  theme(legend.position="none")

# 2. Save the legend
#+++++++++++++++++++++++
legend <- get_legend(bp)

# 3. Remove the legend from the box plot
#+++++++++++++++++++++++
bp <- bp + theme(legend.position="none")

# 4. Arrange ggplot2 graphs with a specific width
grid.arrange(bp, vp, legend, ncol=3, widths=c(2.3, 2.3, 0.8))
ggplot2 arrange multiple graphs on the same page, R software and data visualization

Change legend position

# 1. Create the plots
#++++++++++++++++++++++++++++++++++
# Create a box plot with a top legend position
bp <- ggplot(df, aes(x=dose, y=len, color=dose)) +
  geom_boxplot()+theme(legend.position = "top")

# Create a violin plot
vp <- ggplot(df, aes(x=dose, y=len, color=dose)) +
  geom_violin()+
  geom_boxplot(width=0.1)+
  theme(legend.position="none")

# 2. Save the legend
#+++++++++++++++++++++++
legend <- get_legend(bp)

# 3. Remove the legend from the box plot
#+++++++++++++++++++++++
bp <- bp + theme(legend.position="none")

# 4. Create a blank plot
blankPlot <- ggplot()+geom_blank(aes(1,1)) + 
  cowplot::theme_nothing()

Change legend position by changing the order of plots using the following R code. Grids with four cells are created (2X2). The height of the legend zone is set to 0.2.

Top-left legend:

Top-left legendBlank plot
box plotViolin plot
# Top-left legend
grid.arrange(legend, blankPlot,  bp, vp,
             ncol=2, nrow = 2, 
             widths = c(2.7, 2.7), heights = c(0.2, 2.5))
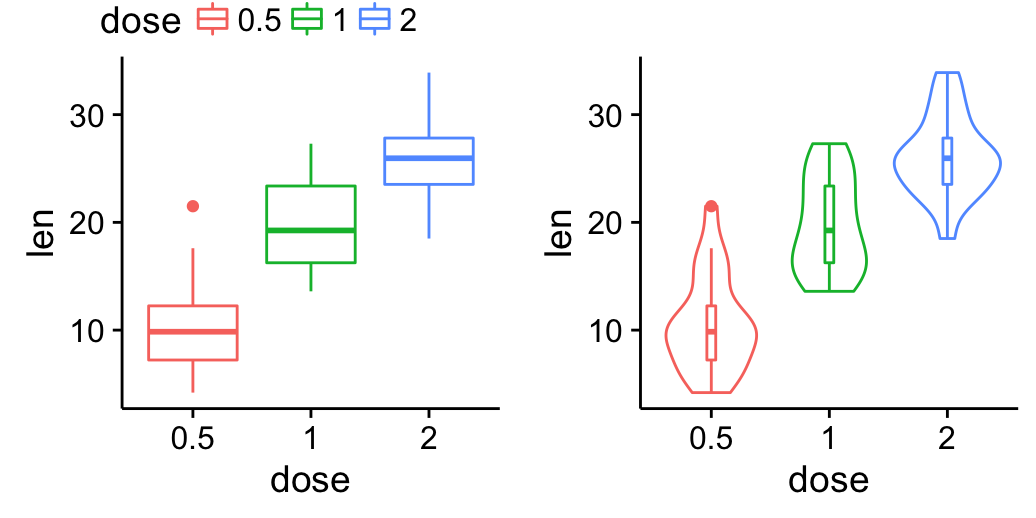
ggplot2 arrange multiple graphs on the same page, R software and data visualization

Top-right legend:

Blank plotTop right legend
box plotViolin plot
# Top-right
grid.arrange(blankPlot, legend,  bp, vp,
             ncol=2, nrow = 2, 
             widths = c(2.7, 2.7), heights = c(0.2, 2.5))
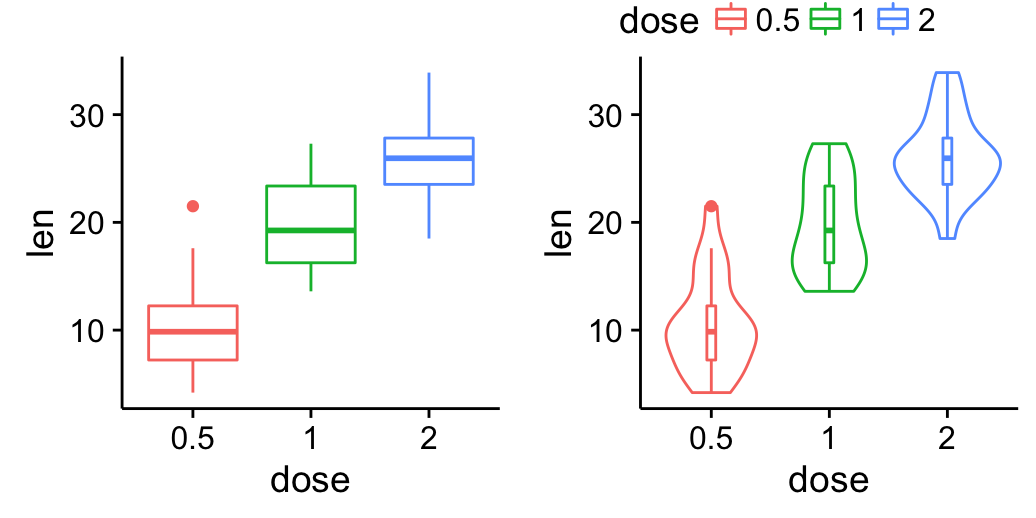
ggplot2 arrange multiple graphs on the same page, R software and data visualization

Bottom-right and bottom-left legend can be drawn as follow:

# Bottom-left legend
grid.arrange(bp, vp, legend, blankPlot,
             ncol=2, nrow = 2, 
             widths = c(2.7, 2.7), heights = c(2.5, 0.2))
# Bottom-right
grid.arrange( bp, vp, blankPlot, legend, 
             ncol=2, nrow = 2, 
             widths = c(2.7, 2.7), heights = c( 2.5, 0.2))

It’s also possible to use the argument layout_matrix to customize legend position. In the R code below, layout_matrix is a 2X2 matrix:

  • The first row (height = 2.5) is where the first plot (bp) and the second plot (vp) live
  • The second row (height = 0.2) is where the legend lives spanning 2 columns

Bottom-center legend:

grid.arrange(bp, vp, legend, ncol=2, nrow = 2, 
             layout_matrix = rbind(c(1,2), c(3,3)),
             widths = c(2.7, 2.7), heights = c(2.5, 0.2))
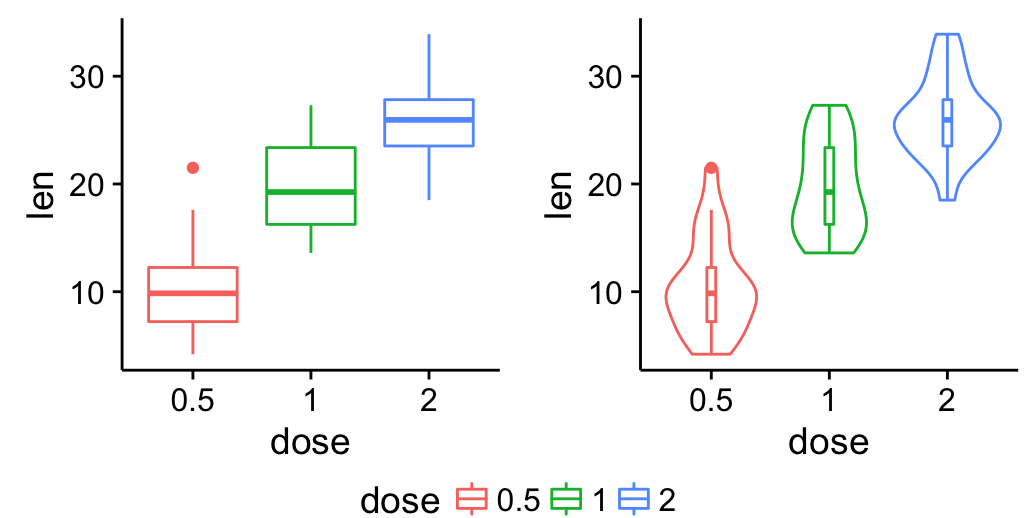
ggplot2 arrange multiple graphs on the same page, R software and data visualization

Top-center legend:

  • The legend (plot 1) lives in the first row (height = 0.2) spanning two columns
  • bp (plot 2) and vp (plot 3) live in the second row (height = 2.5)
grid.arrange(legend, bp, vp,  ncol=2, nrow = 2, 
             layout_matrix = rbind(c(1,1), c(2,3)),
             widths = c(2.7, 2.7), heights = c(0.2, 2.5))
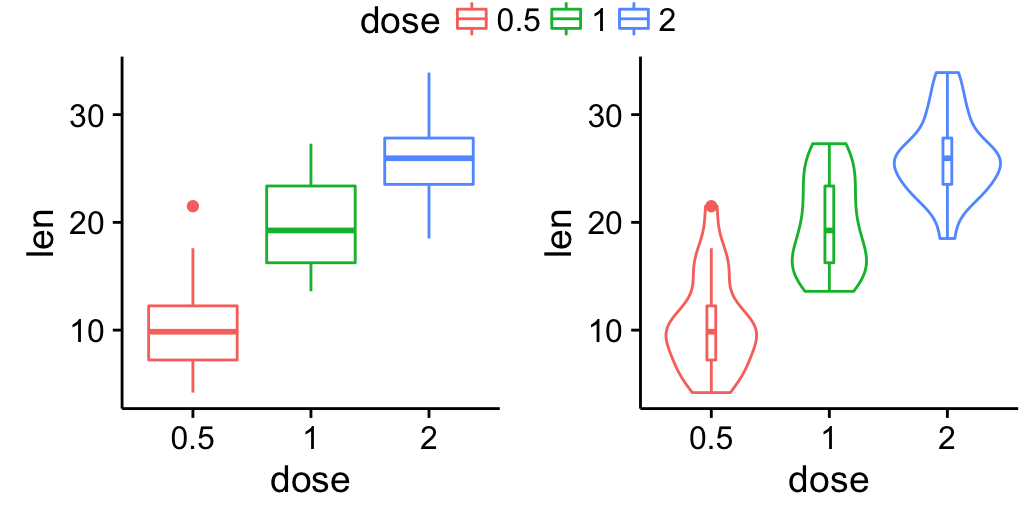
ggplot2 arrange multiple graphs on the same page, R software and data visualization

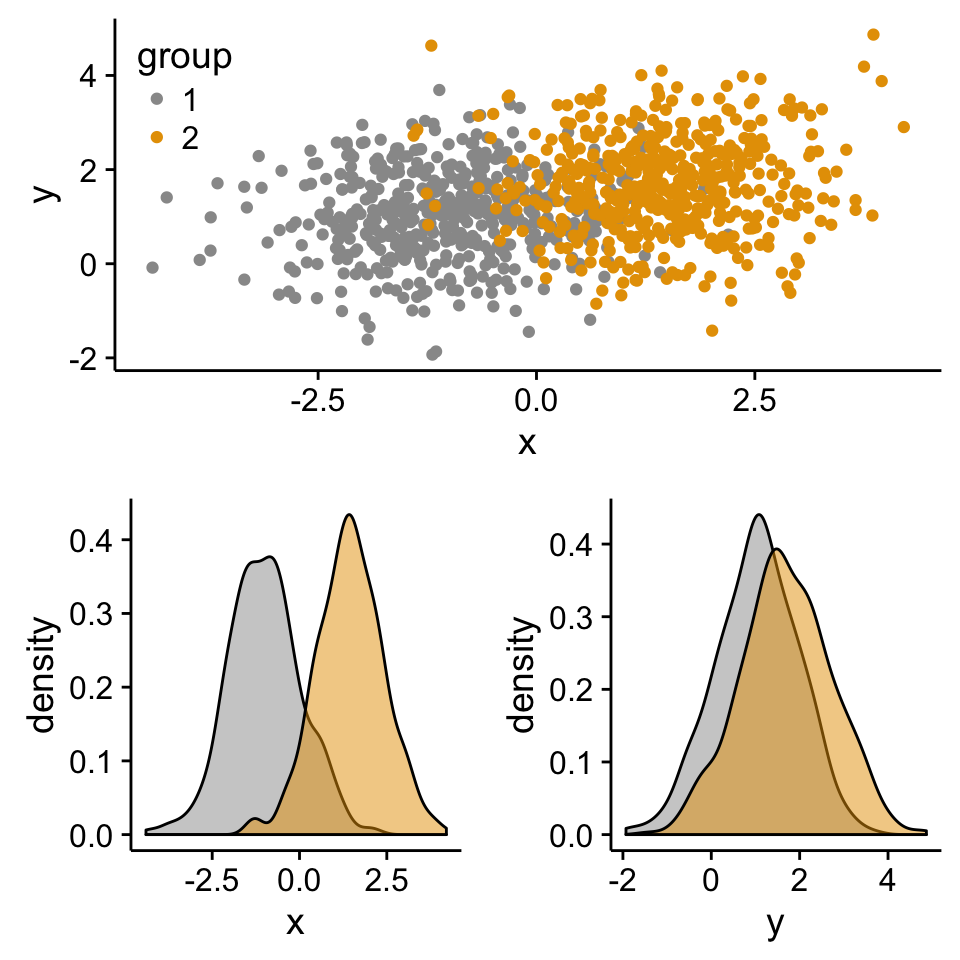
Scatter plot with marginal density plots

Step 1/3. Create some data :

set.seed(1234)
x <- c(rnorm(500, mean = -1), rnorm(500, mean = 1.5))
y <- c(rnorm(500, mean = 1), rnorm(500, mean = 1.7))
group <- as.factor(rep(c(1,2), each=500))
df2 <- data.frame(x, y, group)
head(df2)
##             x          y group
## 1 -2.20706575 -0.2053334     1
## 2 -0.72257076  1.3014667     1
## 3  0.08444118 -0.5391452     1
## 4 -3.34569770  1.6353707     1
## 5 -0.57087531  1.7029518     1
## 6 -0.49394411 -0.9058829     1

Step 2/3. Create the plots :

# Scatter plot of x and y variables and color by groups
scatterPlot <- ggplot(df2,aes(x, y, color=group)) + 
  geom_point() + 
  scale_color_manual(values = c('#999999','#E69F00')) + 
  theme(legend.position=c(0,1), legend.justification=c(0,1))


# Marginal density plot of x (top panel)
xdensity <- ggplot(df2, aes(x, fill=group)) + 
  geom_density(alpha=.5) + 
  scale_fill_manual(values = c('#999999','#E69F00')) + 
  theme(legend.position = "none")

# Marginal density plot of y (right panel)
ydensity <- ggplot(df2, aes(y, fill=group)) + 
  geom_density(alpha=.5) + 
  scale_fill_manual(values = c('#999999','#E69F00')) + 
  theme(legend.position = "none")

Create a blank placeholder plot :

blankPlot <- ggplot()+geom_blank(aes(1,1))+
  theme(
    plot.background = element_blank(), 
   panel.grid.major = element_blank(),
   panel.grid.minor = element_blank(), 
   panel.border = element_blank(),
   panel.background = element_blank(),
   axis.title.x = element_blank(),
   axis.title.y = element_blank(),
   axis.text.x = element_blank(), 
   axis.text.y = element_blank(),
   axis.ticks = element_blank(),
   axis.line = element_blank()
     )

Step 3/3. Put the plots together:

Arrange ggplot2 with adapted height and width for each row and column :

library("gridExtra")
grid.arrange(xdensity, blankPlot, scatterPlot, ydensity, 
        ncol=2, nrow=2, widths=c(4, 1.4), heights=c(1.4, 4))

ggplot2 arrange multiple graphs on the same page, R software and data visualization

Create a complex layout using the function viewport()

The different steps are :

  1. Create plots : p1, p2, p3, ….
  2. Move to a new page on a grid device using the function grid.newpage()
  3. Create a layout 2X2 - number of columns = 2; number of rows = 2
  4. Define a grid viewport : a rectangular region on a graphics device
  5. Print a plot into the viewport
# Move to a new page
grid.newpage()

# Create layout : nrow = 2, ncol = 2
pushViewport(viewport(layout = grid.layout(2, 2)))

# A helper function to define a region on the layout
define_region <- function(row, col){
  viewport(layout.pos.row = row, layout.pos.col = col)
} 

# Arrange the plots
print(scatterPlot, vp=define_region(1, 1:2))
print(xdensity, vp = define_region(2, 1))
print(ydensity, vp = define_region(2, 2))
ggplot2 arrange multiple graphs on the same page, R software and data visualization

ggExtra: Add marginal distributions plots to ggplot2 scatter plots

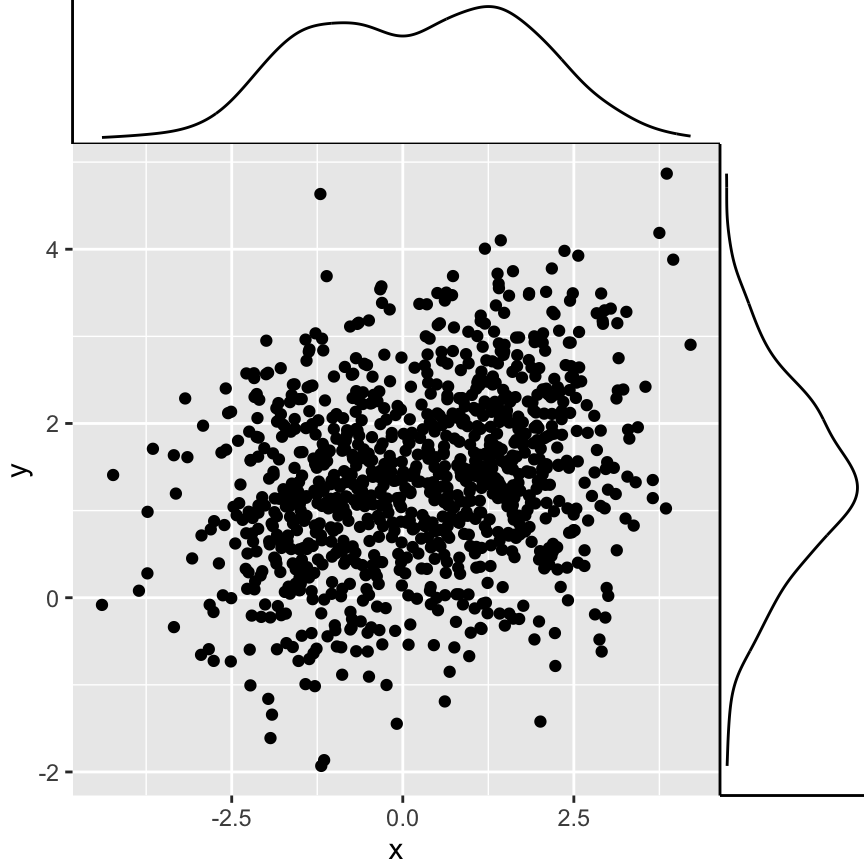
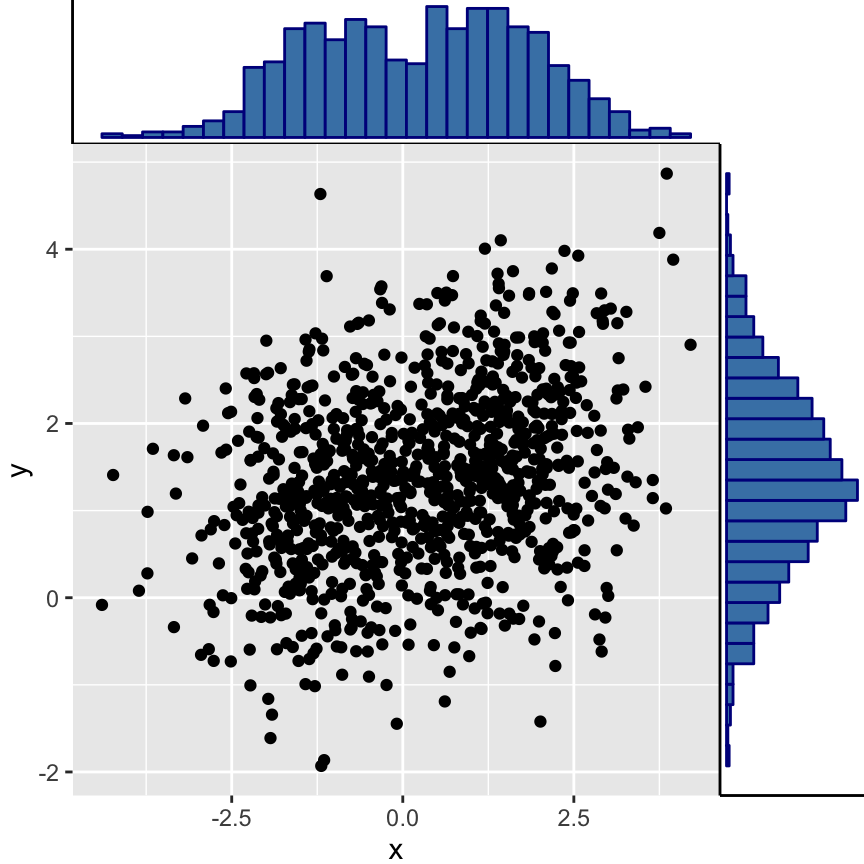
The package ggExtra is an easy-to-use package developped by Dean Attali, for adding marginal histograms, boxplots or density plots to ggplot2 scatter plots.

The package can be installed and used as follow:

# Install
install.packages("ggExtra")
# Load
library("ggExtra")

# Create some data
set.seed(1234)
x <- c(rnorm(500, mean = -1), rnorm(500, mean = 1.5))
y <- c(rnorm(500, mean = 1), rnorm(500, mean = 1.7))
df3 <- data.frame(x, y)

# Scatter plot of x and y variables and color by groups
sp2 <- ggplot(df3,aes(x, y)) + geom_point()

# Marginal density plot
ggMarginal(sp2 + theme_gray())
ggplot2 arrange multiple graphs on the same page, R software and data visualization

# Marginal histogram plot
ggMarginal(sp2 + theme_gray(), type = "histogram",
           fill = "steelblue", col = "darkblue")
ggplot2 arrange multiple graphs on the same page, R software and data visualization

Insert an external graphical element inside a ggplot

The function annotation_custom() [in ggplot2] can be used for adding tables, plots or other grid-based elements. The simplified format is :

annotation_custom(grob, xmin, xmax, ymin, ymax)

  • grob: the external graphical element to display
  • xmin, xmax : x location in data coordinates (horizontal location)
  • ymin, ymax : y location in data coordinates (vertical location)


The different steps are :

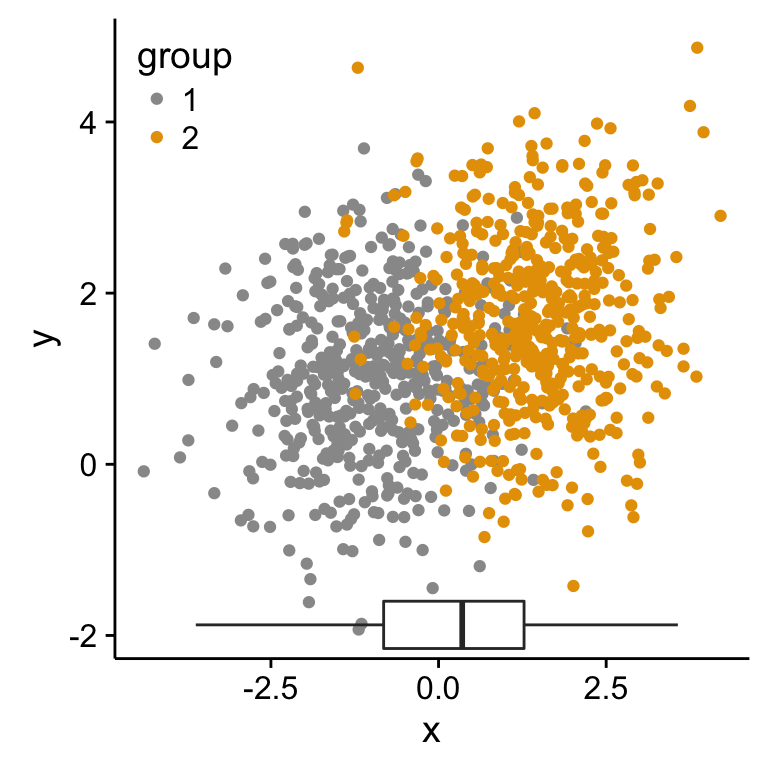
  1. Create a scatter plot of y = f(x)
  2. Add, for example, the box plot of the variables x and y inside the scatter plot using the function annotation_custom()

As the inset box plot overlaps with some points, a transparent background is used for the box plots.

# Create a transparent theme object
transparent_theme <- theme(
 axis.title.x = element_blank(),
 axis.title.y = element_blank(),
 axis.text.x = element_blank(), 
 axis.text.y = element_blank(),
 axis.ticks = element_blank(),
 panel.grid = element_blank(),
 axis.line = element_blank(),
 panel.background = element_rect(fill = "transparent",colour = NA),
 plot.background = element_rect(fill = "transparent",colour = NA))

Create the graphs :

p1 <- scatterPlot # see previous sections for the scatterPlot

# Box plot of the x variable
p2 <- ggplot(df2, aes(factor(1), x))+
  geom_boxplot(width=0.3)+coord_flip()+
  transparent_theme

# Box plot of the y variable
p3 <- ggplot(df2, aes(factor(1), y))+
  geom_boxplot(width=0.3)+
  transparent_theme

# Create the external graphical elements
# called a "grop" in Grid terminology
p2_grob = ggplotGrob(p2)
p3_grob = ggplotGrob(p3)

# Insert p2_grob inside the scatter plot
xmin <- min(x); xmax <- max(x)
ymin <- min(y); ymax <- max(y)
p1 + annotation_custom(grob = p2_grob, xmin = xmin, xmax = xmax, 
                       ymin = ymin-1.5, ymax = ymin+1.5)
ggplot2 arrange multiple graphs on the same page, R software and data visualization

# Insert p3_grob inside the scatter plot
p1 + annotation_custom(grob = p3_grob,
                       xmin = xmin-1.5, xmax = xmin+1.5, 
                       ymin = ymin, ymax = ymax)
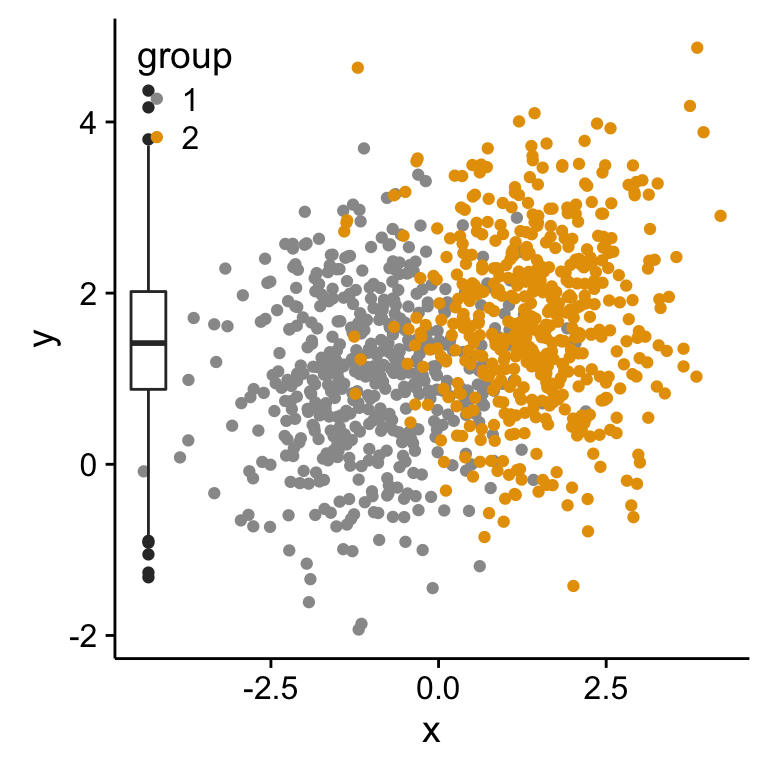
ggplot2 arrange multiple graphs on the same page, R software and data visualization

If you have a solution to insert, at the same time, both p2_grob and p3_grob inside the scatter plot, please let me a comment. I got some errors trying to do this…

Mix table, text and ggplot2 graphs

The functions below are required :

  • tableGrob() [in the package gridExtra] : for adding a data table to a graphic device
  • splitTextGrob() [in the package RGraphics] : for adding a text to a graph

Make sure that the package RGraphics is installed.

library(RGraphics)
library(gridExtra)

# Table
p1 <- tableGrob(head(ToothGrowth))

# Text
text <- "ToothGrowth data describes the effect of Vitamin C on tooth growth in Guinea pigs.  Three dose levels of Vitamin C (0.5, 1, and 2 mg) with each of two delivery methods [orange juice (OJ) or ascorbic acid (VC)] are used."
p2 <- splitTextGrob(text)

# Box plot
p3 <- ggplot(df, aes(x=dose, y=len)) + geom_boxplot()

# Arrange the plots on the same page
grid.arrange(p1, p2, p3, ncol=1)
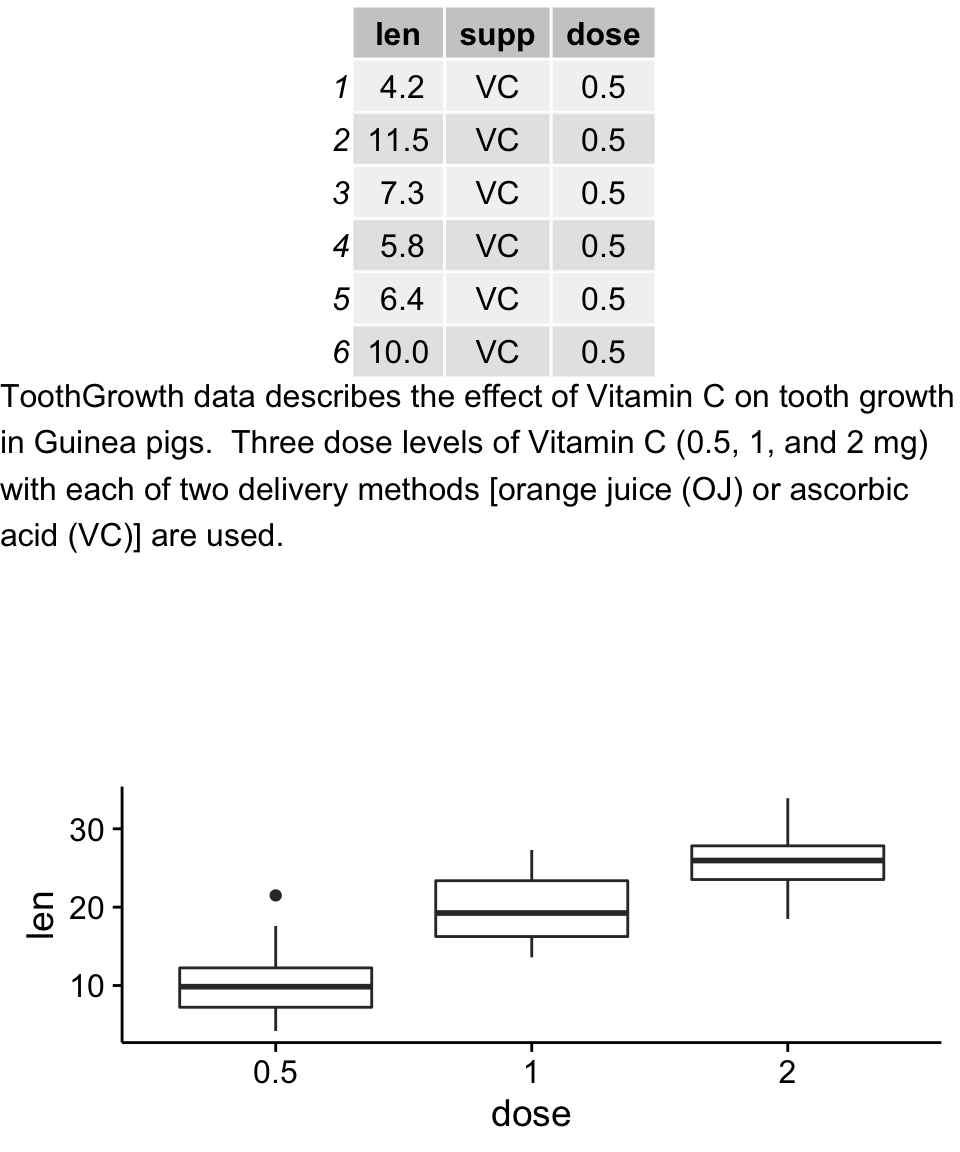
ggplot2 arrange multiple graphs on the same page, R software and data visualization

Infos

This analysis has been performed using R software (ver. 3.2.1) and ggplot2 (ver. 1.0.1)


How to choose the appropriate clustering algorithms for your data? - Unsupervised Machine Learning

$
0
0


There are many clustering algorithms published in the literature, including:

For a given dataset, choosing the appropriate clustering method and the optimal number of clusters can be a hard task for the analyst.

As described in two of my previous articles(determining the optimal number of clusters and cluster validation statistics), there are more than 30 indices for assessing the goodness of clustering results and for identifying the best performing clustering algorithm for a particular dataset.


This article describes the R package clValid (G. Brock et al., 2008) which can be used for simultaneously comparing multiple clustering algorithms in a single function call for identifying the best clustering approach and the optimal number of clusters.


The package clValid contains 3 different types of clustering validation measures:

  • Clustering internal validation, which uses intrinsic information in the data to assess the quality of the clustering.
  • Clustering stability validation, which is a special version of internal validation. It evaluates the consistency of a clustering result by comparing it with the clusters obtained after each column is removed, one at a time.
  • Clustering biological validation, which evaluates the ability of a clustering algorithm to produce biologically meaningful clusters.

We’ll start by describing the different clustering validation measures in the package. Next, we’ll present the function clValid() and finally we’ll provide an R lab section for validating clustering results and comparing clustering algorithms.

1 Clustering validation measures in clValid package

1.1 Internal validation measures

The internal measures included in clValid package are:

  1. Connectivity
  2. Average Silhouette width
  3. Dunn index

These methods has been already described in my previous article: clustering validation statistic.

Briefly, connectivity indicates the degree of connectedness of the clusters, as determined by k-nearest neighbors. Connectedness corresponds to what extent items are placed in the same cluster as their nearest neighbors in the data space. The connectivity has a value between 0 and infinity and should be minimized.

Silhouette width and Dunn index combine measures of compactness and separation of the clusters. Recall that the values of silhouette width range from -1 (poorly clustered observations) to 1 (well clustered observations). The Dunn index is the ratio between the smallest distance between observations not in the same cluster to the largest intra-cluster distance. It has a value between 0 and infinity and should be maximized.

1.2 Stability validation measures

The cluster stability measures includes:

  • The average proportion of non-overlap (APN)
  • The average distance (AD)
  • The average distance between means (ADM)
  • The figure of merit (FOM)

The APN, AD, and ADM are all based on the cross-classification table of the original clustering with the clustering based on the removal of one column.

  • The APN measures the average proportion of observations not placed in the same cluster by clustering based on the full data and clustering based on the data with a single column removed.

  • The AD measures the average distance between observations placed in the same cluster under both cases (full dataset and removal of one column).

  • The ADM measures the average distance between cluster centers for observations placed in the same cluster under both cases.

  • The FOM measures the average intra-cluster variance of the deleted column, where the clustering is based on the remaining (undeleted) columns. It also has a value between zero and 1, and again smaller values are preferred.

The values of APN, ADM and FOM ranges from 0 to 1, with smaller value corresponding with highly consistent clustering results. AD has a value between 0 and infinity, and smaller values are also preferred.

1.3 Biological validation measures

Biological validation evaluates the ability of a clustering algorithm to produce biologically meaningful clusters. An application is microarray or RNAseq data where observations corresponds to genes.

There are two biological measures:

  • The biological homogeneity index (BHI)
  • The biological stability index (BSI)

The BHI measures the average proportion of gene pairs that are clustered together which have matching biological functional classes.

The BSI is similar to the other stability measures, but inspects the consistency of clustering for genes with similar biological functionality. Each sample is removed one at a time, and the cluster membership for genes with similar functional annotation is compared with the cluster membership using all available samples.

2 R function clValid()

2.1 Format

The main function in clValid package is clValid():

clValid(obj, nClust, clMethods = "hierarchical",
        validation = "stability", maxitems = 600,
        metric = "euclidean", method = "average")

  • obj: A numeric matrix or data frame. Rows are the items to be clustered and columns are samples.
  • nClust: A numeric vector specifying the numbers of clusters to be evaluated. e.g., 2:10
  • clMethods: The clustering method to be used. Available options are “hierarchical”, “kmeans”, “diana”, “fanny”, “som”, “model”, “sota”, “pam”, “clara”, and “agnes”, with multiple choices allowed.
  • validation: The type of validation measures to be used. Allowed values are “internal”, “stability”, and “biological”, with multiple choices allowed.
  • maxitems: The maximum number of items (rows in matrix) which can be clustered.
  • metric: The metric used to determine the distance matrix. Possible choices are “euclidean”, “correlation”, and “manhattan”.
  • method: For hierarchical clustering (hclust and agnes), the agglomeration method to be used. Available choices are “ward”, “single”, “complete” and “average”.


2.2 Examples of usage

2.2.1 Data

We’ll use mouse data [in clValid package ] which is an Affymetrix gene expression data of of mesenchymal cells from two distinct lineages (M and N). It contains 147 genes and 6 samples (3 samples for each lineage).

library(clValid)
# Load the data
data(mouse)
head(mouse)
##             ID       M1       M2       M3      NC1      NC2      NC3
## 1   1448995_at 4.706812 4.528291 4.325836 5.568435 6.915079 7.353144
## 2 1436392_s_at 3.867962 4.052354 3.474651 4.995836 5.056199 5.183585
## 3 1437434_a_at 2.875112 3.379619 3.239800 3.877053 4.459629 4.850978
## 4   1428922_at 5.326943 5.498930 5.629814 6.795194 6.535522 6.622577
## 5 1452671_s_at 5.370125 4.546810 5.704810 6.407555 6.310487 6.195847
## 6   1448147_at 3.471347 4.129992 3.964431 4.474737 5.185631 5.177967
##                       FC
## 1 Growth/Differentiation
## 2   Transcription factor
## 3          Miscellaneous
## 4          Miscellaneous
## 5          ECM/Receptors
## 6 Growth/Differentiation
# Extract gene expression data
exprs <- mouse[1:25,c("M1","M2","M3","NC1","NC2","NC3")]
rownames(exprs) <- mouse$ID[1:25]
head(exprs)
##                    M1       M2       M3      NC1      NC2      NC3
## 1448995_at   4.706812 4.528291 4.325836 5.568435 6.915079 7.353144
## 1436392_s_at 3.867962 4.052354 3.474651 4.995836 5.056199 5.183585
## 1437434_a_at 2.875112 3.379619 3.239800 3.877053 4.459629 4.850978
## 1428922_at   5.326943 5.498930 5.629814 6.795194 6.535522 6.622577
## 1452671_s_at 5.370125 4.546810 5.704810 6.407555 6.310487 6.195847
## 1448147_at   3.471347 4.129992 3.964431 4.474737 5.185631 5.177967

2.2.2 Compute clValid()

We start by internal cluster validation which measures the connectivity, silhouette width and Dunn index. It’s possible to compute simultaneously these internal measures for multiple clustering algorithms in combination with a range of cluster numbers. The R code below can be used:

# Compute clValid
clmethods <- c("hierarchical","kmeans","pam")
intern <- clValid(exprs, nClust = 2:6,
              clMethods = clmethods, validation = "internal")
# Summary
summary(intern)
##
## Clustering Methods:
##  hierarchical kmeans pam
##
## Cluster sizes:
##  2 3 4 5 6
##
## Validation Measures:
##                                  2       3       4       5       6
##
## hierarchical Connectivity   4.6159 11.5865 19.5075 22.2075 24.5044
##              Dunn           0.4217  0.2315  0.3068  0.3456  0.3456
##              Silhouette     0.5997  0.4529  0.4324  0.4007  0.3891
## kmeans       Connectivity   4.6159  9.5607 20.4774 23.1774 26.2242
##              Dunn           0.4217  0.3924  0.1360  0.1556  0.1778
##              Silhouette     0.5997  0.5495  0.4235  0.3871  0.3618
## pam          Connectivity   4.6159  9.5607 18.5925 25.0631 31.8381
##              Dunn           0.4217  0.3924  0.3068  0.3068  0.2511
##              Silhouette     0.5997  0.5495  0.4401  0.4297  0.3506
##
## Optimal Scores:
##
##              Score  Method       Clusters
## Connectivity 4.6159 hierarchical 2
## Dunn         0.4217 hierarchical 2
## Silhouette   0.5997 hierarchical 2

It can be seen that hierarchical clustering with two clusters performs the best in each case (i.e., for connectivity, Dunn and Silhouette measures).

The plots of the connectivity, Dunn index, and silhouette width can be generated as follow:

plot(intern)

clValid - Unsupervised Machine LearningclValid - Unsupervised Machine LearningclValid - Unsupervised Machine Learning

Recall that the connectivity should be minimized, while both the Dunn index and the silhouette width should be maximized.

Thus, it appears that hierarchical clustering outperforms the other clustering algorithms under each validation measure, for nearly every number of clusters evaluated.

Regardless of the clustering algorithm, the optimal number of clusters seems to be two using the three measures.

Stability measures can be computed as follow:

# Stability measures
clmethods <- c("hierarchical","kmeans","pam")
stab <- clValid(exprs, nClust = 2:6, clMethods = clmethods,
                validation = "stability")
# Display only optimal Scores
optimalScores(stab)
##         Score       Method Clusters
## APN 0.0000000 hierarchical        2
## AD  0.9642344          pam        6
## ADM 0.0000000 hierarchical        2
## FOM 0.3925939          pam        6

It’s also possible to display a complete summary:

summary(stab)

plot(stab)

For the APN and ADM measures, hierarchical clustering with two clusters again gives the best score. For the other measures, PAM with six clusters has the best score.

For cluster biological validation read the documentation of clValid() (?clValid).

3 Infos

This analysis has been performed using R software (ver. 3.2.1)

  • Brock, G., Pihur, V., Datta, S. and Datta, S. (2008) clValid: An R Package for Cluster Validation Journal of Statistical Software 25(4) http://www.jstatsoft.org/v25/i04

Hybrid hierarchical k-means clustering for optimizing clustering outputs - Unsupervised Machine Learning

$
0
0


Clustering algorithms are used to split a dataset into several groups (i.e clusters), so that the objects in the same group are as similar as possible and the objects in different groups are as dissimilar as possible.

The most popular clustering algorithms are:

However, each of these two standard clustering methods has its limitations. K-means clustering requires the user to specify the number of clusters in advance and selects initial centroids randomly. Agglomerative hierarchical clustering is good at identifying small clusters but not large ones.

In this article, we document hybrid approaches for easily mixing the best of k-means clustering and hierarchical clustering.

1 How this article is organized

We’ll start by demonstrating why we should combine k-means and hierarcical clustering. An application is provided using R software.

Finally, we’ll provide an easy to use R function (in factoextra package) for computing hybrid hierachical k-means clustering.

2 Required R packages

We’ll use the R package factoextra which is very helpful for simplifying clustering workflows and for visualizing clusters using ggplot2 plotting system

Install factoextra package as follow:

if(!require(devtools)) install.packages("devtools")
devtools::install_github("kassambara/factoextra")

Load the package:

library(factoextra)

3 Data preparation

We’ll use USArrest dataset and we start by scaling the data:

# Load the data
data(USArrests)
# Scale the data
df <- scale(USArrests)
head(df)
##                Murder   Assault   UrbanPop         Rape
## Alabama    1.24256408 0.7828393 -0.5209066 -0.003416473
## Alaska     0.50786248 1.1068225 -1.2117642  2.484202941
## Arizona    0.07163341 1.4788032  0.9989801  1.042878388
## Arkansas   0.23234938 0.2308680 -1.0735927 -0.184916602
## California 0.27826823 1.2628144  1.7589234  2.067820292
## Colorado   0.02571456 0.3988593  0.8608085  1.864967207

If you want to understand why the data are scaled before the analysis, then you should read this section: Distances and scaling.

4 R function for clustering analyses

We’ll use the function eclust() [in factoextra] which provides several advantages as described in the previous chapter: Visual Enhancement of Clustering Analysis.

eclust() stands for enhanced clustering. It simplifies the workflow of clustering analysis and, it can be used for computing hierarchical clustering and partititioning clustering in a single line function call.

4.1 Example of k-means clustering

We’ll split the data into 4 clusters using k-means clustering as follow:

library("factoextra")
# K-means clustering
km.res <- eclust(df, "kmeans", k = 4,
                 nstart = 25, graph = FALSE)
# k-means group number of each observation
head(km.res$cluster, 15)
##     Alabama      Alaska     Arizona    Arkansas  California    Colorado 
##           4           3           3           4           3           3 
## Connecticut    Delaware     Florida     Georgia      Hawaii       Idaho 
##           2           2           3           4           2           1 
##    Illinois     Indiana        Iowa 
##           3           2           1
# Visualize k-means clusters
fviz_cluster(km.res,  frame.type = "norm", frame.level = 0.68)

Clustering on principal component - Unsupervised Machine Learning

# Visualize the silhouette of clusters
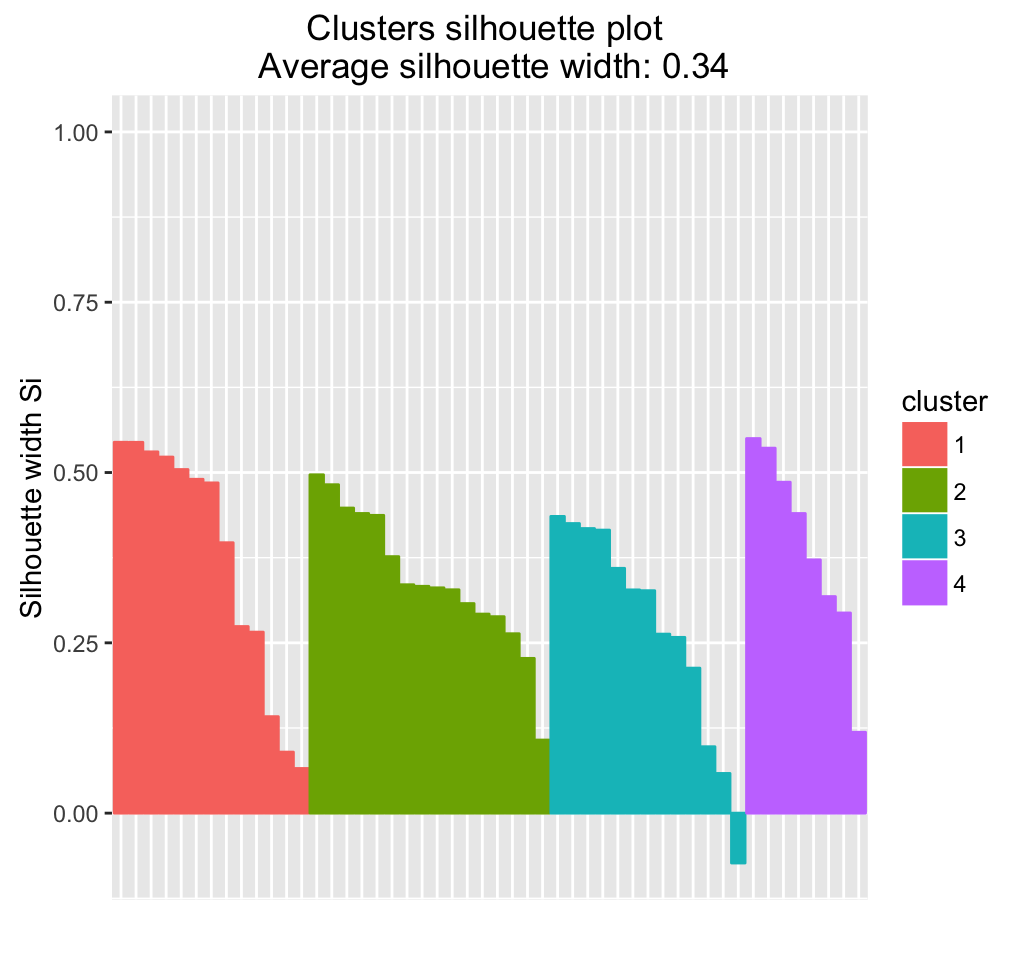
fviz_silhouette(km.res)
##   cluster size ave.sil.width
## 1       1   13          0.37
## 2       2   16          0.34
## 3       3   13          0.27
## 4       4    8          0.39

Clustering on principal component - Unsupervised Machine Learning

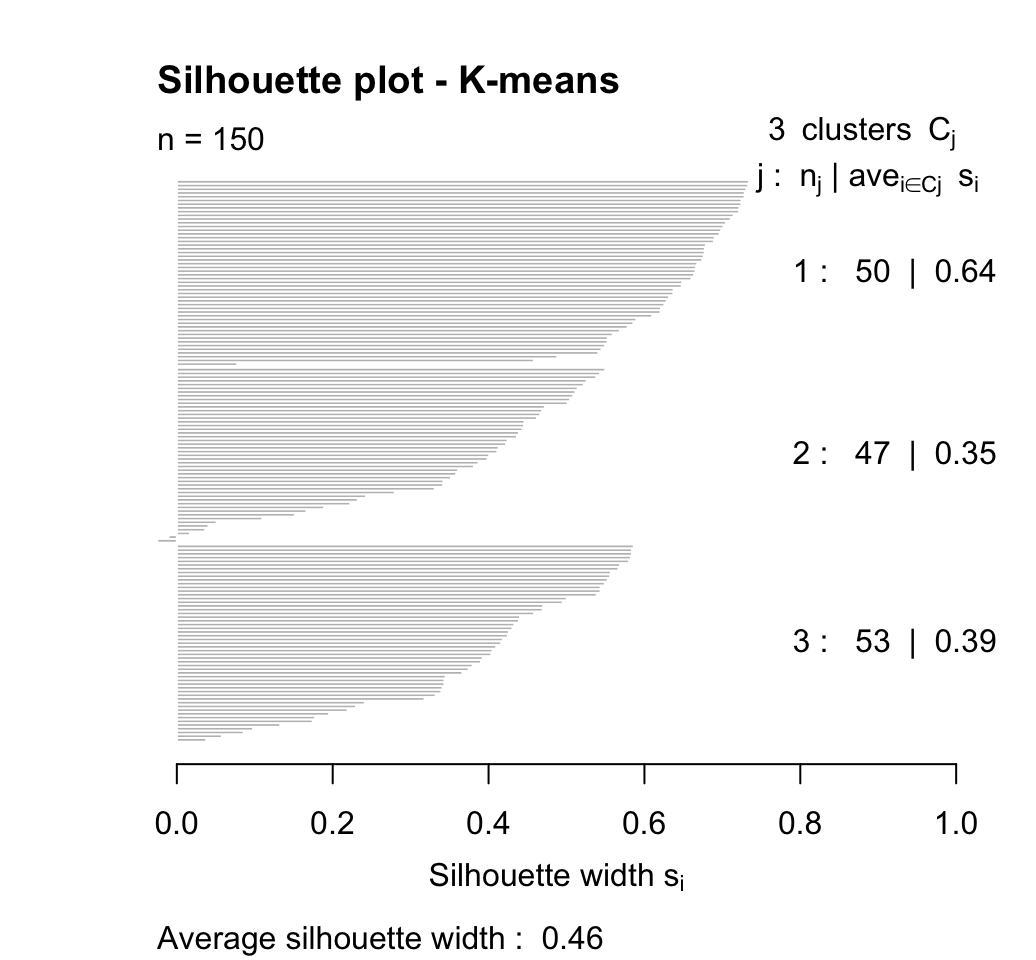
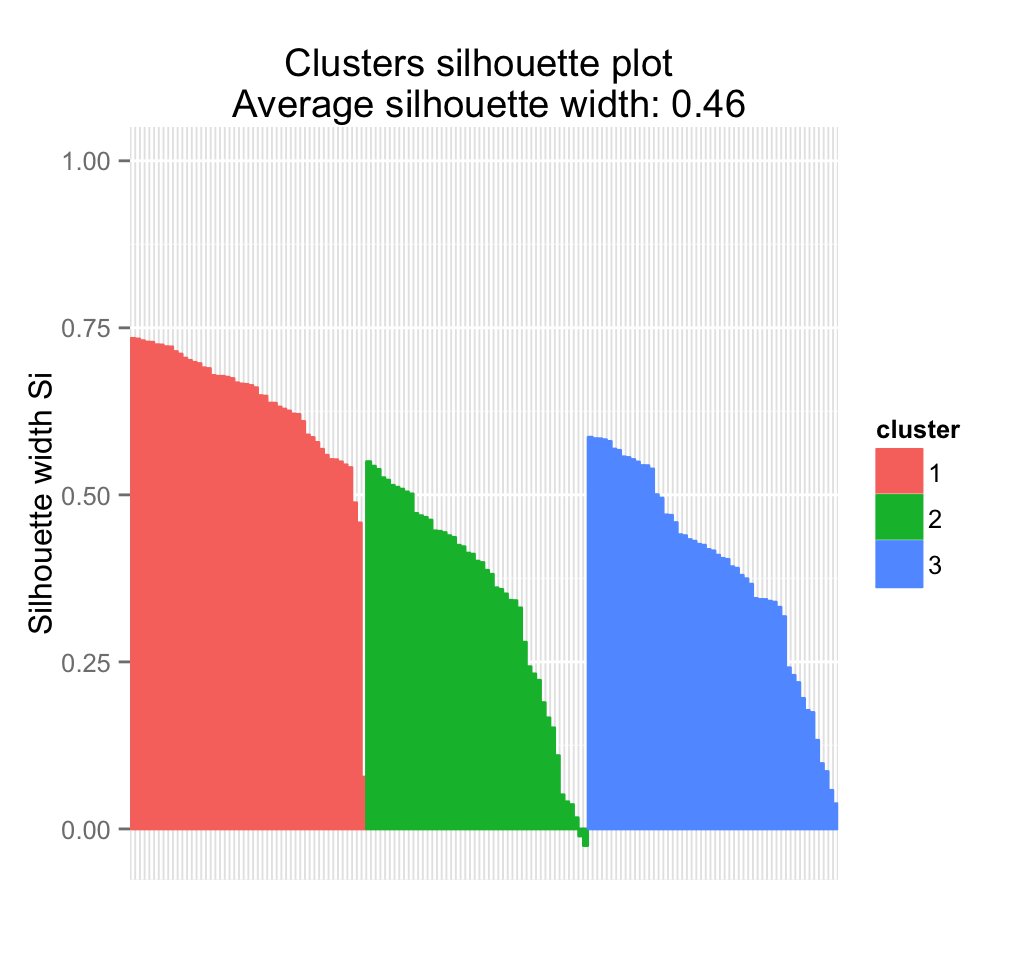
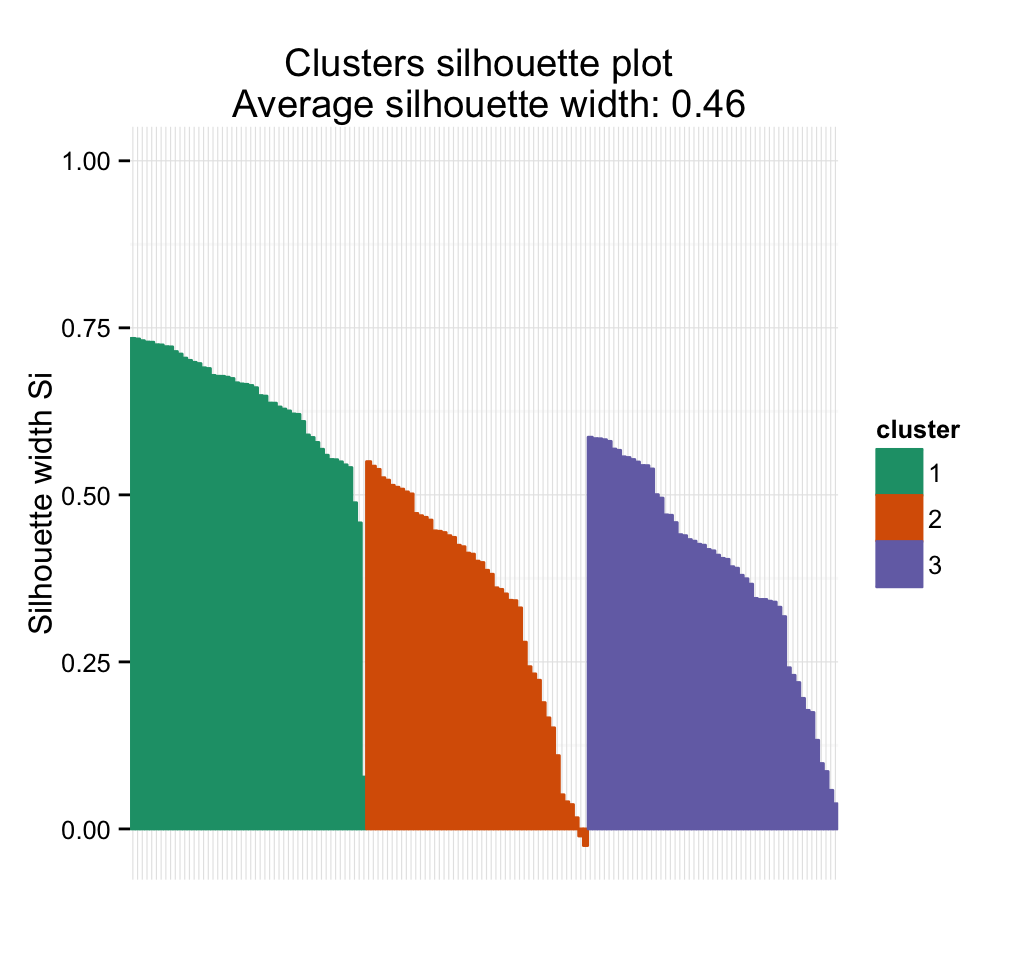
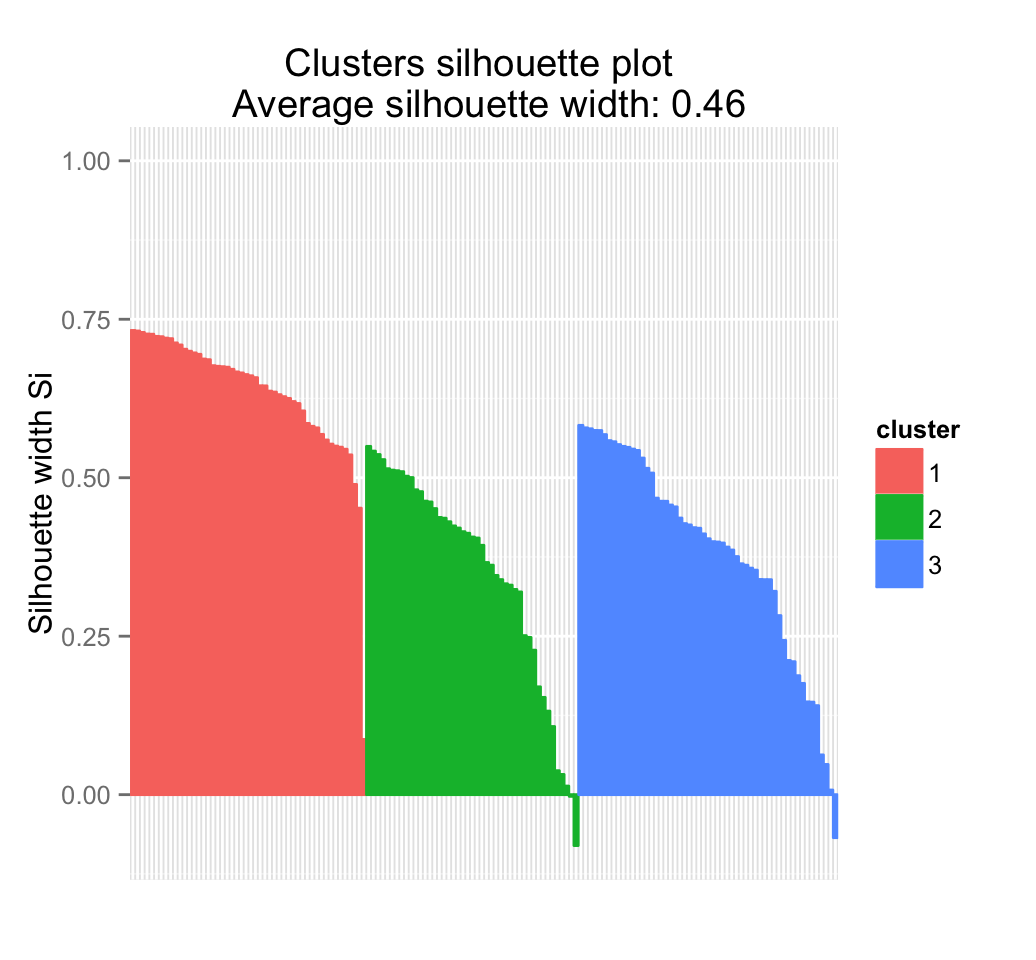
Note that, silhouette coefficient measures how well an observation is clustered and it estimates the average distance between clusters (i.e, the average silhouette width). Observations with negative silhouette are probably placed in the wrong cluster. Read more here: cluster validation statistics

Samples with negative silhouette coefficient:

# Silhouette width of observation
sil <- km.res$silinfo$widths[, 1:3]
# Objects with negative silhouette
neg_sil_index <- which(sil[, 'sil_width'] < 0)
sil[neg_sil_index, , drop = FALSE]
##          cluster neighbor   sil_width
## Missouri       3        2 -0.07318144

Read more about k-means clustering: K-means clustering

4.2 Example of hierarchical clustering

# Enhanced hierarchical clustering
res.hc <- eclust(df, "hclust", k = 4,
                method = "ward.D2", graph = FALSE) 
head(res.hc$cluster, 15)
##     Alabama      Alaska     Arizona    Arkansas  California    Colorado 
##           1           2           2           3           2           2 
## Connecticut    Delaware     Florida     Georgia      Hawaii       Idaho 
##           4           3           2           1           3           4 
##    Illinois     Indiana        Iowa 
##           2           3           4
# Dendrogram
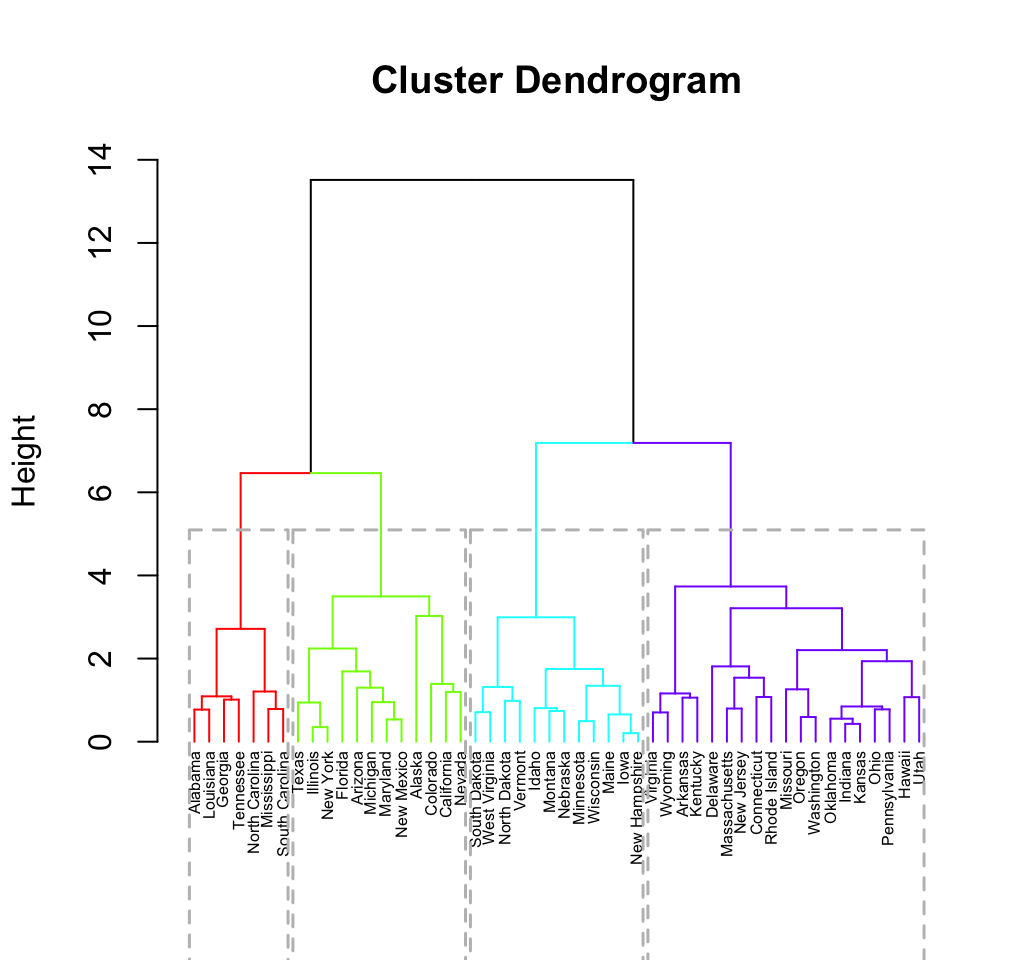
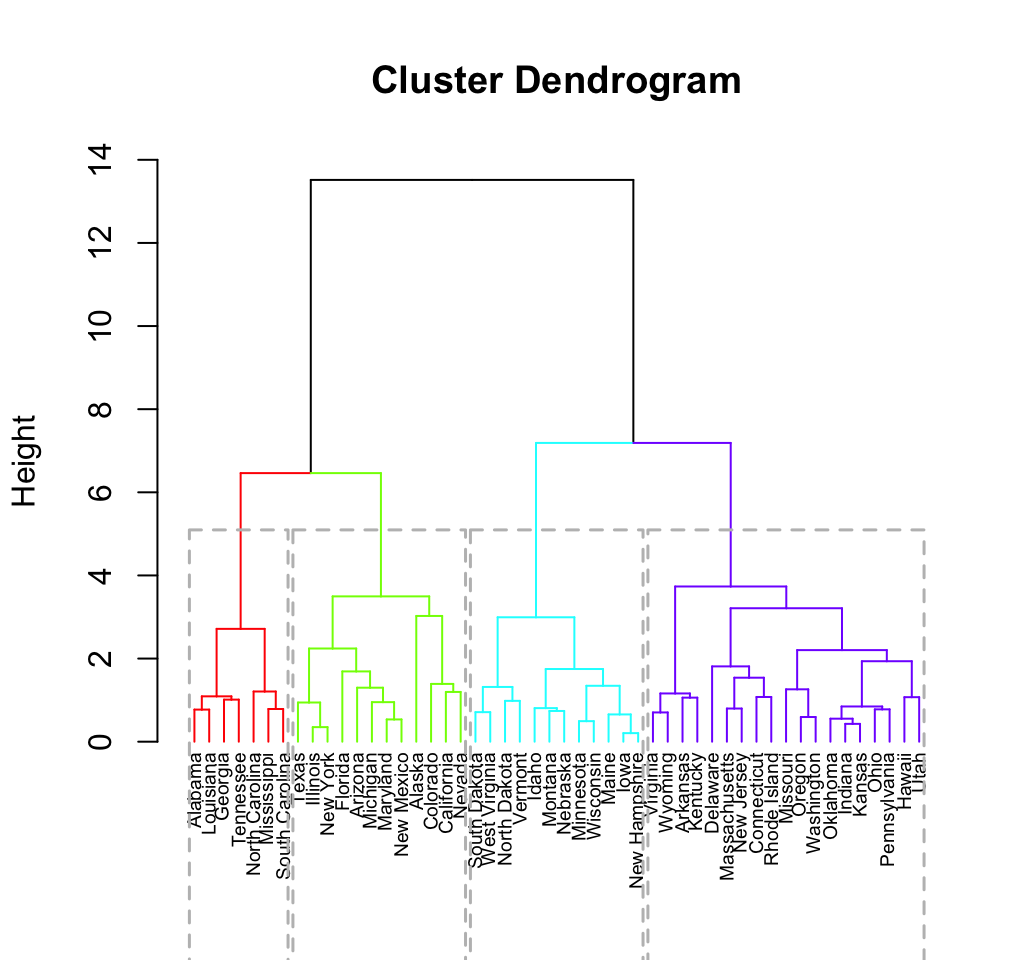
fviz_dend(res.hc, rect = TRUE, show_labels = TRUE, cex = 0.5) 

Clustering on principal component - Unsupervised Machine Learning

# Visualize the silhouette of clusters
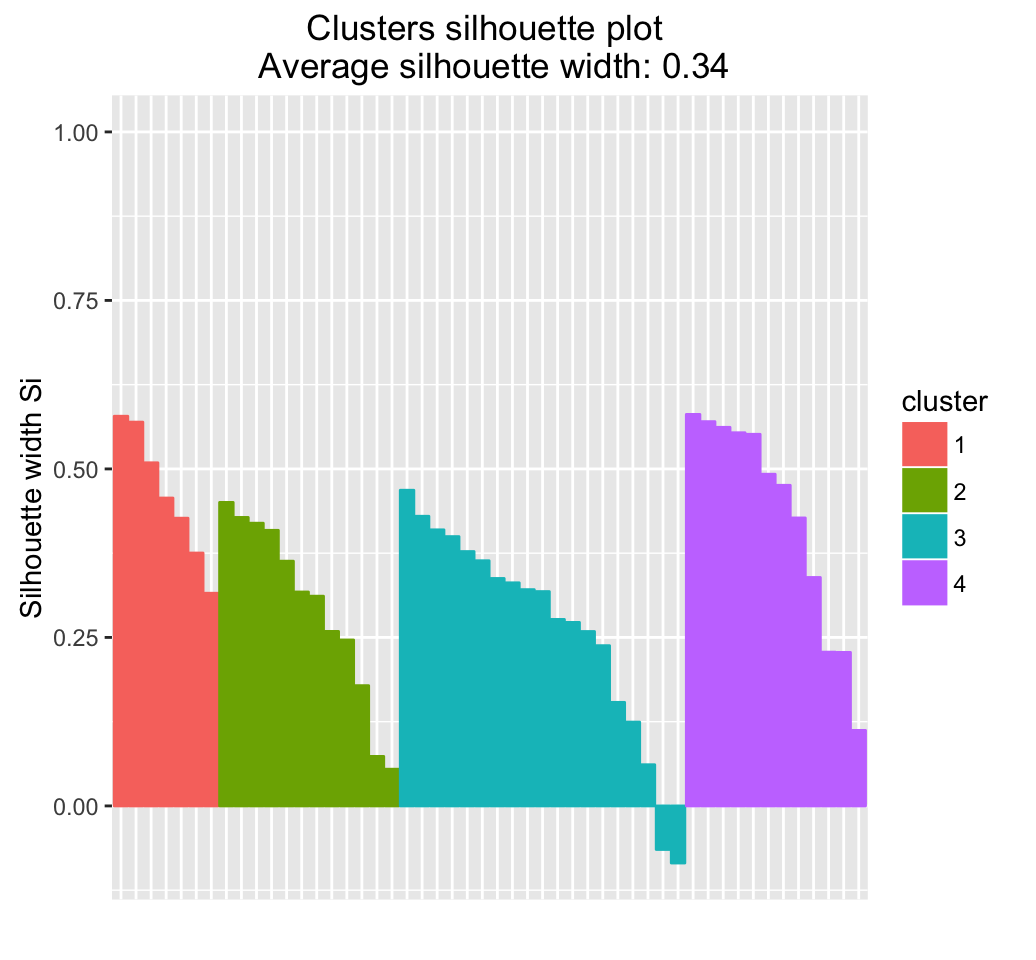
fviz_silhouette(res.hc)
##   cluster size ave.sil.width
## 1       1    7          0.40
## 2       2   12          0.26
## 3       3   18          0.38
## 4       4   13          0.35

Clustering on principal component - Unsupervised Machine Learning

It can be seen that three samples have negative silhouette coefficient indicating that they are not in the right cluster. These samples are:

# Silhouette width of observation
sil <- res.hc$silinfo$widths[, 1:3]
# Objects with negative silhouette
neg_sil_index <- which(sil[, 'sil_width'] < 0)
sil[neg_sil_index, , drop = FALSE]
##             cluster neighbor    sil_width
## Alaska            2        1 -0.005212336
## Nebraska          4        3 -0.044172624
## Connecticut       4        3 -0.078016589

Read more about hierarchical clustering: Hierarchical clustering

5 Combining hierarchical clustering and k-means

5.1 Why?

Recall that, in k-means algorithm, a random set of observations are chosen as the initial centers.

The final k-means clustering solution is very sensitive to this initial random selection of cluster centers. The result might be (slightly) different each time you compute k-means.

To avoid this, a solution is to use an hybrid approach by combining the hierarchical clustering and the k-means methods. This process is named hybrid hierarchical k-means clustering (hkmeans).

5.2 How ?

The procedure is as follow:

  1. Compute hierarchical clustering and cut the tree into k-clusters
  2. compute the center (i.e the mean) of each cluster
  3. Compute k-means by using the set of cluster centers (defined in step 3) as the initial cluster centers

Note that, k-means algorithm will improve the initial partitioning generated at the step 2 of the algorithm. Hence, the initial partitioning can be slightly different from the final partitioning obtained in the step 4.

5.3 R codes

5.3.1 Compute hierarchical clustering and cut the tree into k-clusters:

res.hc <- eclust(df, "hclust", k = 4,
                method = "ward.D2", graph = FALSE) 
grp <- res.hc$cluster

5.3.2 Compute the centers of clusters defined by hierarchical clustering:

Cluster centers are defined as the means of variables in clusters. The function aggregate() can be used to compute the mean per group in a data frame.

# Compute cluster centers
clus.centers <- aggregate(df, list(grp), mean)
clus.centers
##   Group.1     Murder    Assault   UrbanPop        Rape
## 1       1  1.5803956  0.9662584 -0.7775109  0.04844071
## 2       2  0.7298036  1.1188219  0.7571799  1.32135653
## 3       3 -0.3250544 -0.3231032  0.3733701 -0.17068130
## 4       4 -1.0745717 -1.1056780 -0.7972496 -1.00946922
# Remove the first column
clus.centers <- clus.centers[, -1]
clus.centers
##       Murder    Assault   UrbanPop        Rape
## 1  1.5803956  0.9662584 -0.7775109  0.04844071
## 2  0.7298036  1.1188219  0.7571799  1.32135653
## 3 -0.3250544 -0.3231032  0.3733701 -0.17068130
## 4 -1.0745717 -1.1056780 -0.7972496 -1.00946922

5.3.3 K-means clustering using hierarchical clustering defined cluster-centers

km.res2 <- eclust(df, "kmeans", k = clus.centers, graph = FALSE)
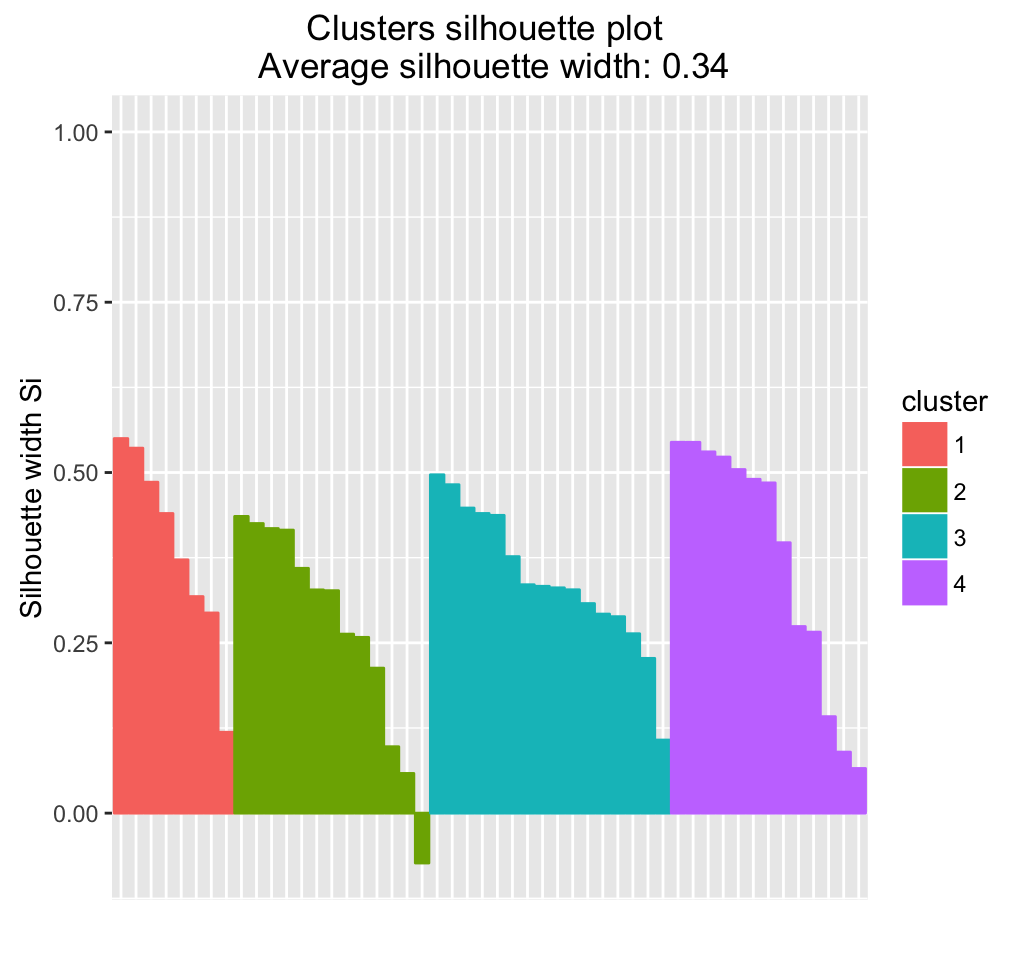
fviz_silhouette(km.res2)
##   cluster size ave.sil.width
## 1       1    8          0.39
## 2       2   13          0.27
## 3       3   16          0.34
## 4       4   13          0.37

Clustering on principal component - Unsupervised Machine Learning

5.3.4 Compare the results of hierarchical clustering and hybrid approach

The R code below compares the initial clusters defined using only hierarchical clustering and the final ones defined using hierarchical clustering + k-means:

# res.hc$cluster: Initial clusters defined using hierarchical clustering
# km.res2$cluster: Final clusters defined using k-means
table(km.res2$cluster, res.hc$cluster)
##    
##      1  2  3  4
##   1  7  0  1  0
##   2  0 12  1  0
##   3  0  0 15  1
##   4  0  0  1 12

It can be seen that, 3 of the observations defined as belonging to cluster 3 by hierarchical clustering has been reclassified to cluster 1, 2, and 4 in the final solution defined by k-means clustering.

The difference can be easily visualized using the function fviz_dend() [in factoextra]. The labels are colored using k-means clusters:

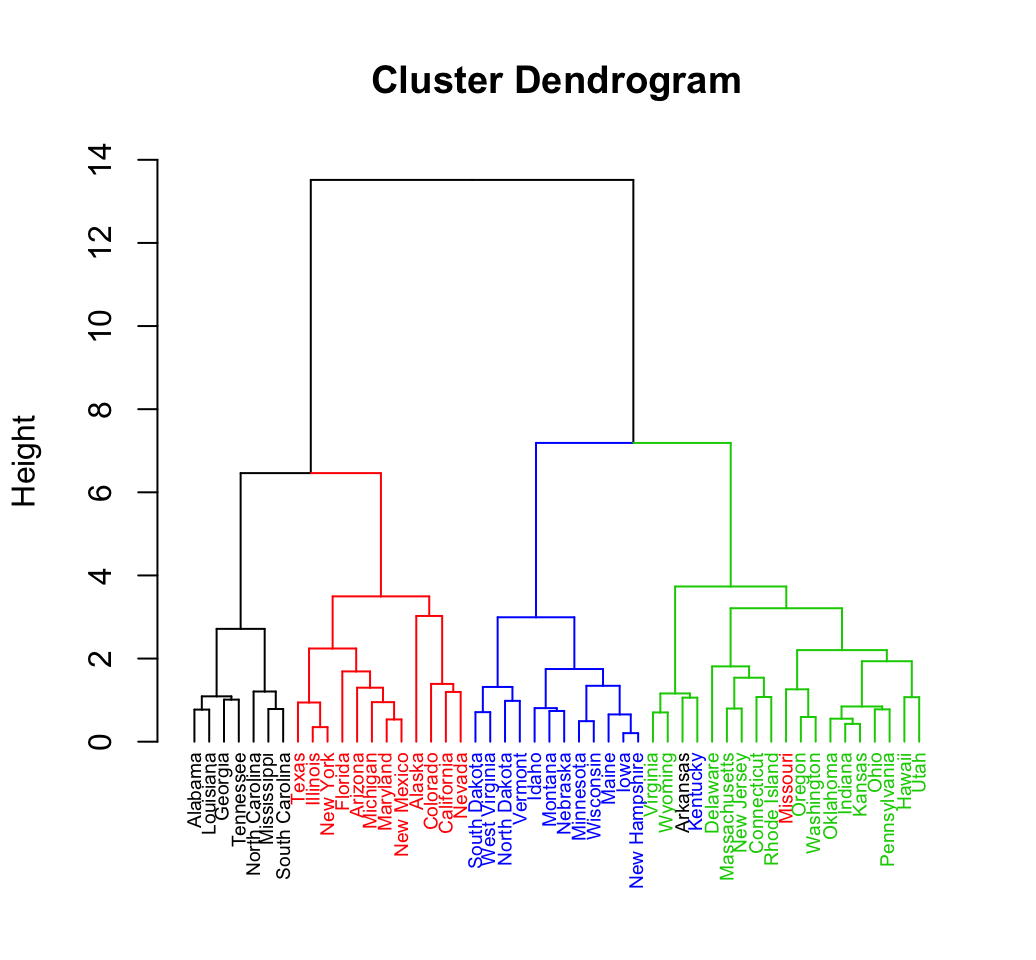
fviz_dend(res.hc, k = 4, 
          k_colors = c("blue", "green3", "red", "black"),
          label_cols =  km.res$cluster[res.hc$order], cex = 0.6)

Clustering on principal component - Unsupervised Machine Learning

It can be seen that the hierarchical clustering result has been improved by the k-means algorithm.

5.3.5 Compare the results of standard k-means clustering and hybrid approach

# Final clusters defined using hierarchical k-means clustering
km.clust <- km.res$cluster

# Standard k-means clustering
set.seed(123)
res.km <- kmeans(df, centers = 4, iter.max = 100)


# comparison
table(km.clust, res.km$cluster)
##         
## km.clust  1  2  3  4
##        1 13  0  0  0
##        2  0 16  0  0
##        3  0  0 13  0
##        4  0  0  0  8

In our current example, there was no further improvement of the k-means clustering result by the hybrid approach. An improvement might be observed using another dataset.

5.4 hkmeans(): Easy-to-use function for hybrid hierarchical k-means clustering

The function hkmeans() [in factoextra] can be used to compute easily the hybrid approach of k-means on hierarchical clustering. The format of the result is similar to the one provided by the standard kmeans() function.

# Compute hierarchical k-means clustering
res.hk <-hkmeans(df, 4)
# Elements returned by hkmeans()
names(res.hk)
##  [1] "cluster"      "centers"      "totss"        "withinss"    
##  [5] "tot.withinss" "betweenss"    "size"         "iter"        
##  [9] "ifault"       "data"         "hclust"
# Print the results
res.hk
## Hierarchical K-means clustering with 4 clusters of sizes 8, 13, 16, 13
## 
## Cluster means:
##       Murder    Assault   UrbanPop        Rape
## 1  1.4118898  0.8743346 -0.8145211  0.01927104
## 2  0.6950701  1.0394414  0.7226370  1.27693964
## 3 -0.4894375 -0.3826001  0.5758298 -0.26165379
## 4 -0.9615407 -1.1066010 -0.9301069 -0.96676331
## 
## Clustering vector:
##        Alabama         Alaska        Arizona       Arkansas     California 
##              1              2              2              1              2 
##       Colorado    Connecticut       Delaware        Florida        Georgia 
##              2              3              3              2              1 
##         Hawaii          Idaho       Illinois        Indiana           Iowa 
##              3              4              2              3              4 
##         Kansas       Kentucky      Louisiana          Maine       Maryland 
##              3              4              1              4              2 
##  Massachusetts       Michigan      Minnesota    Mississippi       Missouri 
##              3              2              4              1              2 
##        Montana       Nebraska         Nevada  New Hampshire     New Jersey 
##              4              4              2              4              3 
##     New Mexico       New York North Carolina   North Dakota           Ohio 
##              2              2              1              4              3 
##       Oklahoma         Oregon   Pennsylvania   Rhode Island South Carolina 
##              3              3              3              3              1 
##   South Dakota      Tennessee          Texas           Utah        Vermont 
##              4              1              2              3              4 
##       Virginia     Washington  West Virginia      Wisconsin        Wyoming 
##              3              3              4              4              3 
## 
## Within cluster sum of squares by cluster:
## [1]  8.316061 19.922437 16.212213 11.952463
##  (between_SS / total_SS =  71.2 %)
## 
## Available components:
## 
##  [1] "cluster"      "centers"      "totss"        "withinss"    
##  [5] "tot.withinss" "betweenss"    "size"         "iter"        
##  [9] "ifault"       "data"         "hclust"
# Visualize the tree
fviz_dend(res.hk, cex = 0.6, rect = TRUE)

Clustering on principal component - Unsupervised Machine Learning

# Visualize the hkmeans final clusters
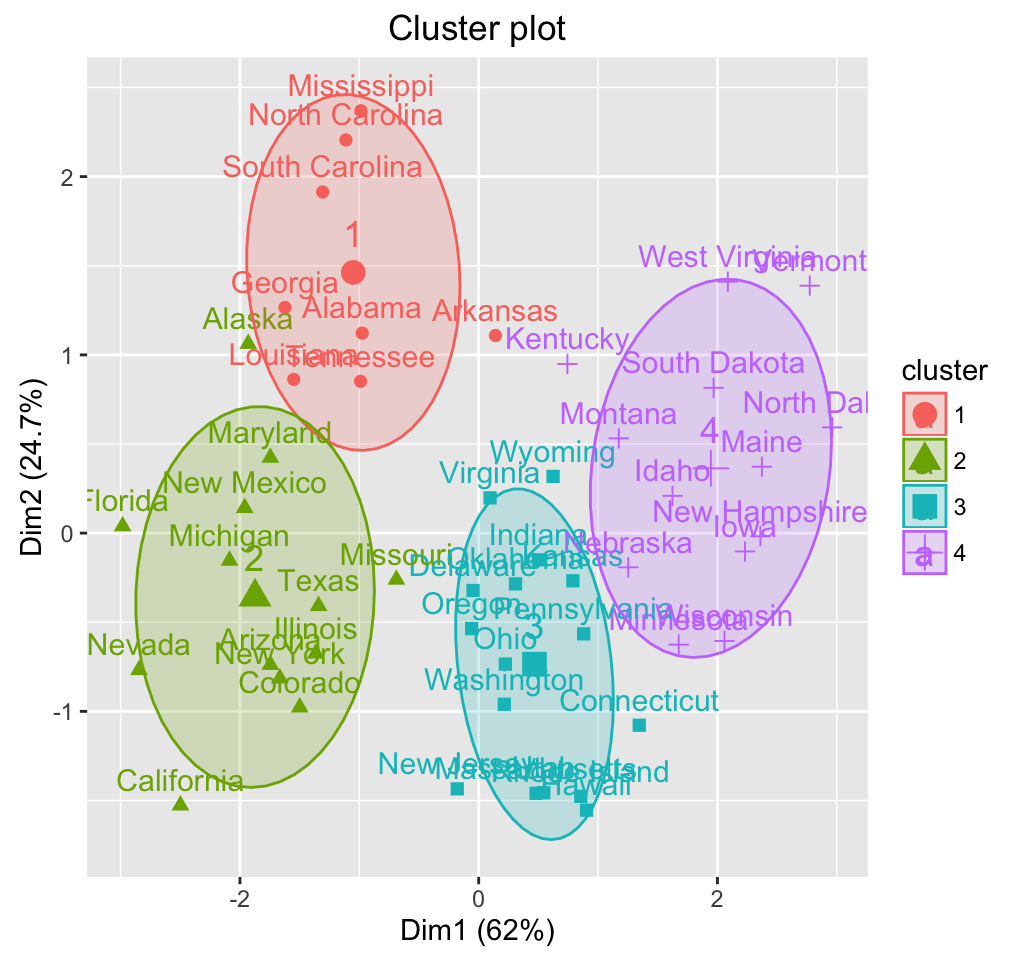
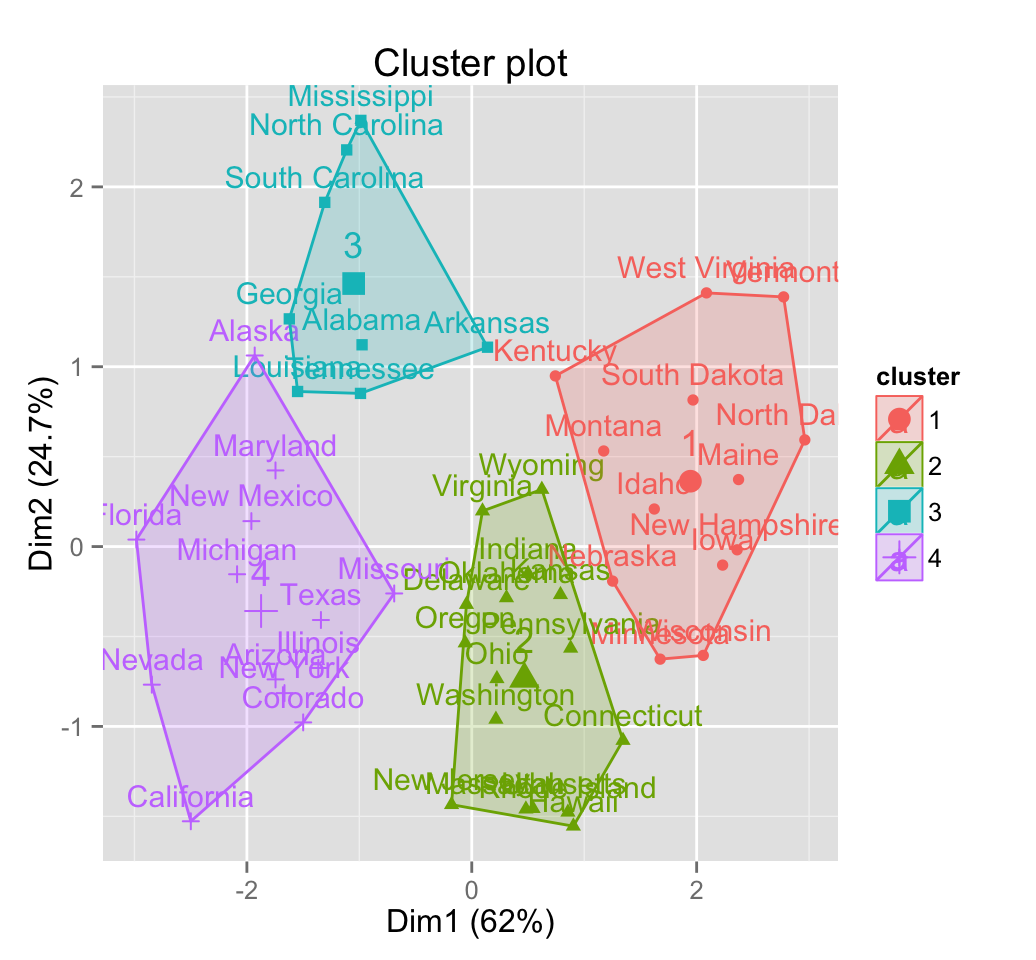
fviz_cluster(res.hk, frame.type = "norm", frame.level = 0.68)

Clustering on principal component - Unsupervised Machine Learning

6 Infos

This analysis has been performed using R software (ver. 3.2.1)

HCPC: Hierarchical clustering on principal components - Hybrid approach (2/2) - Unsupervised Machine Learning

$
0
0


There are three standards methods for exploring multidimensional data:

  1. Principal component methods, used to summarize and to visualize the information contained in a multivariate data table. Individuals and variables with same profiles are grouped together in the plot. Principal component methods include:
  2. Hierarchical Clustering, used for identifying groups of similar observations in a data set.
  3. Partitioning clustering such as k-means, used for splitting a data set into several groups.

In my previous article, Hybrid hierarchical k-means clustering, I described HOW and WHY, we should combine hierarchical clustering and k-means clustering.

In the present article, I will show how to combine the three methods: principal component methods, hierarchical clustering and partitioning methods such as k-means to better describe and visualize the similarity between observations. The approach described here has been implemented in the R package FactoMineR (F. Husson et al., 2010). It’s named HCPC for Hierarchical Clustering on Principal Components.

1 Why combining principal component and clustering methods?

1.1 Case of continuous variables: Use PCA as denoising step

In the case of a multidimensional data set containing continuous variables, principal component analysis (PCA) can be used to reduce the dimensionality of the data into few continuous variables (i.e, principal components) containing the most important information in the data.
PCA step can be considered as denoising step which can lead to a more stable clustering. This is very useful if you have a large data set with multiple variables, such as in gene expression data.

1.2 Case of categorical variables: Use CA or MCA before clustering

CA (for analyzing contingency table formed by two categorical variables) and MCA (for analyzing multidimensional categorical variables) can be used to transform categorical variables into a set of few continuous variables (the principal components) and to remove the noise in the data.

CA and MCA can be considered as pre-processing steps which allow to compute clustering on categorical data

2 Algorithm of hierachical clustering on principal component (HCPC)


  1. Compute principal component methods
  2. Compute hierarchical clustering: Hierarchical Clustering is performed using Ward’s criterion on the selected principal components. Ward criterion has to be used in the hierarchical clustering because it is based on the multidimensional variance (i.e.inertia) as well as principal component analysis.

  3. Choose the number of clusters based on the hierarchical tree: An initial partitioning is performed by cutting the hierarchical tree.

  4. K-means clustering is performed to improve the initial partition obtained from hierarchical clustering. The final partitioning solution, obtained after consolidation with k-means, can be (slightly) different from the one obtained with the hierarchical clustering. The importance of combining hierarchical clustering and k-means clustering has been described in my previous post: Hybrid hierarchical k-means clustering


3 Computing HCPC in R

3.1 Required R packages

We’ll use FactoMineR for computing HCPC() and factoextra for data visualizations.

Install factoextra package as follow:

if(!require(devtools)) install.packages("devtools")
devtools::install_github("kassambara/factoextra")

FactoMineR can be installed as follow:

install.packages("FactoMineR")

Load the packages:

library(factoextra)
library(FactoMineR)

3.2 R function for HCPC

The function HCPC()[in FactoMineR package] can be used to compute hierarchical clustering on principal components.

A simplified format is:

HCPC(res, nb.clust = 0, iter.max = 10, min = 3, max = NULL, graph = TRUE)

  • res: a PCA result or a data frame
  • nb.clust: an integer specifying the number of clusters. Possible values are:
    • 0: the tree is cut at the level the user clicks on
    • -1: the tree is automatically cut at the suggested level
    • Any positive integer: the tree is cut with nb.clusters clusters
  • iter.max: the maximum number of iterations for k-means
  • min, max: the minimum and the maximum number of clusters to be generated, respectively
  • graph: if TRUE, graphics are displayed


3.3 Case of continuous variables

We start by computing again the principal component analysis(PCA) is performed on the data set. The argument ncp = 3 is used in the function PCA() to keep only the first three principal components. Next HCPC is applied on the result of the PCA.

3.3.1 Data preparation

We’ll use USArrest data set and we start by scaling the data:

# Load the data
data(USArrests)
# Scale the data
df <- scale(USArrests)
head(df)
##                Murder   Assault   UrbanPop         Rape
## Alabama    1.24256408 0.7828393 -0.5209066 -0.003416473
## Alaska     0.50786248 1.1068225 -1.2117642  2.484202941
## Arizona    0.07163341 1.4788032  0.9989801  1.042878388
## Arkansas   0.23234938 0.2308680 -1.0735927 -0.184916602
## California 0.27826823 1.2628144  1.7589234  2.067820292
## Colorado   0.02571456 0.3988593  0.8608085  1.864967207

If you want to understand why the data are scaled before the analysis, then you should read this section: Distances and scaling.

3.3.2 Compute principal component analysis

We’ll use the package FactoMineR for computing HCPC and factoextra for the visualization of the output.

# Compute principal component analysis
library(FactoMineR)
res.pca <- PCA(USArrests, ncp = 5, graph=FALSE)
# Percentage of information retained by each
# dimensions
library(factoextra)
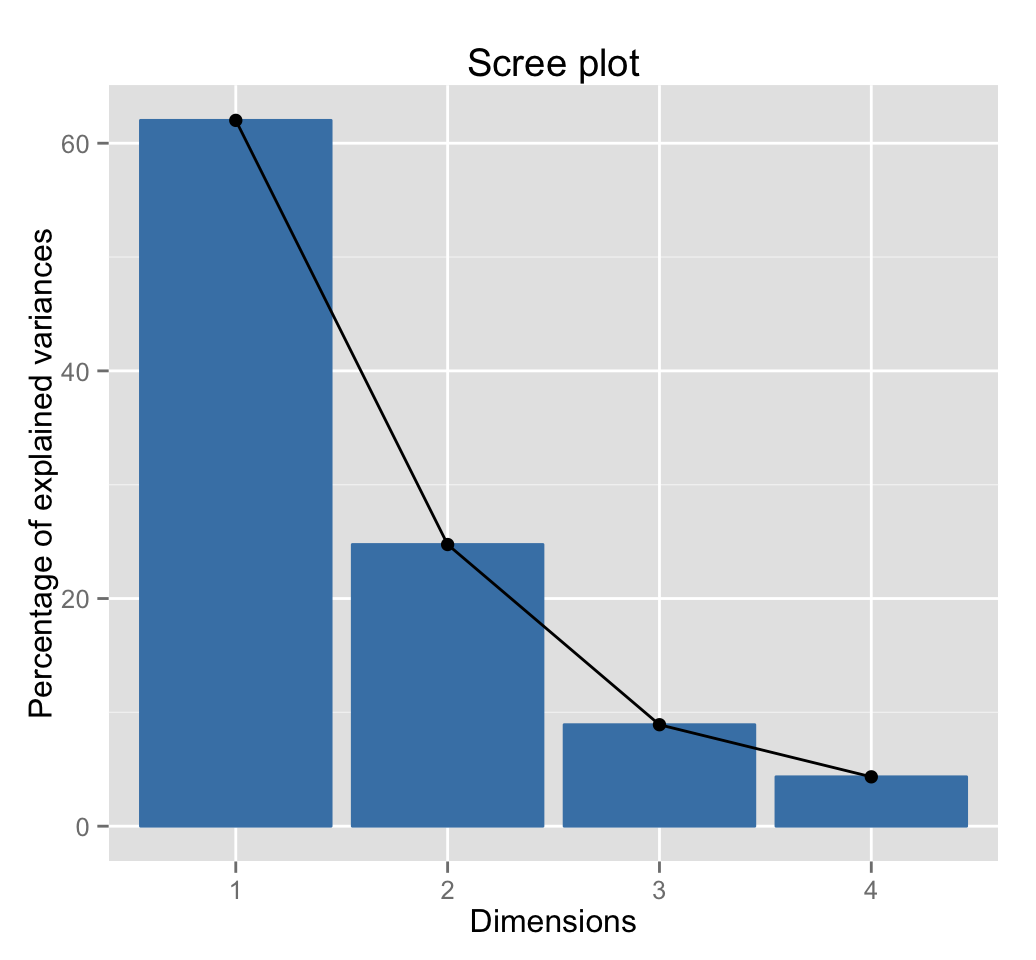
fviz_eig(res.pca)

Clustering on principal component - Unsupervised Machine Learning

# Visualize variables
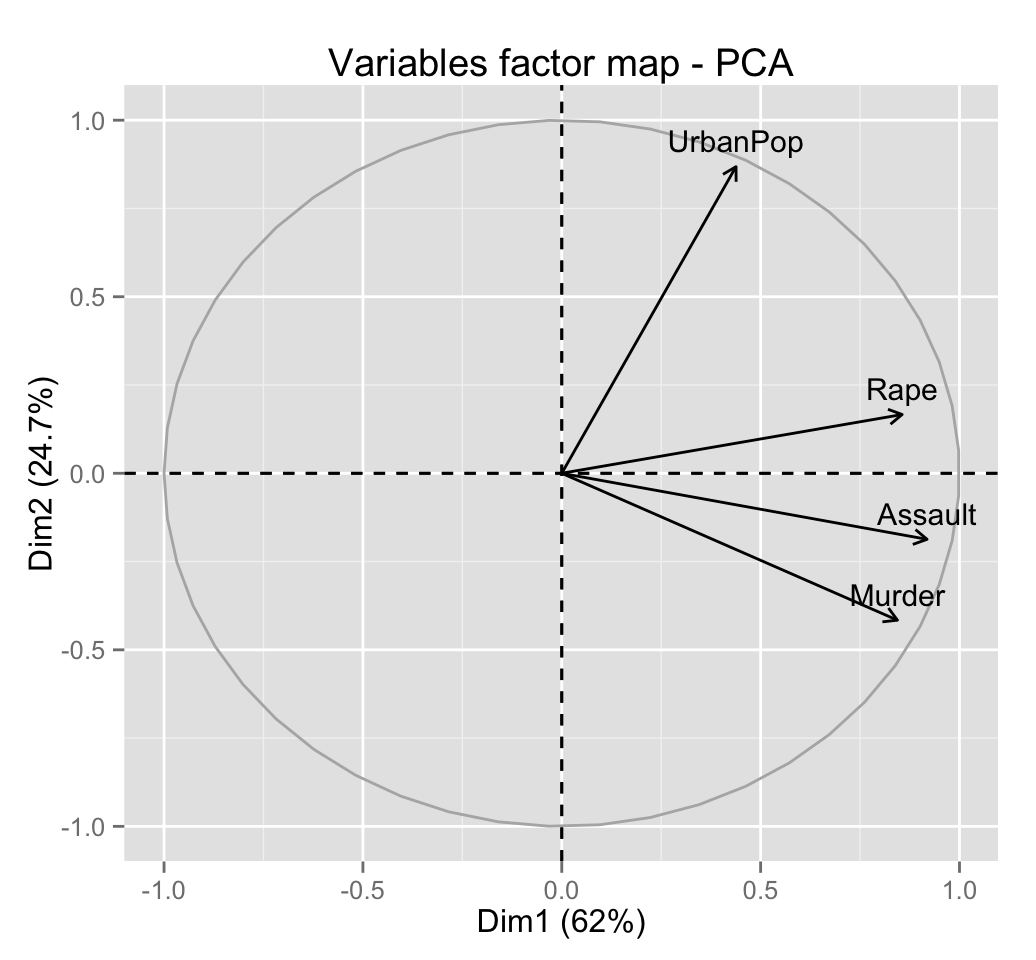
fviz_pca_var(res.pca)

Clustering on principal component - Unsupervised Machine Learning

# Visualize individuals
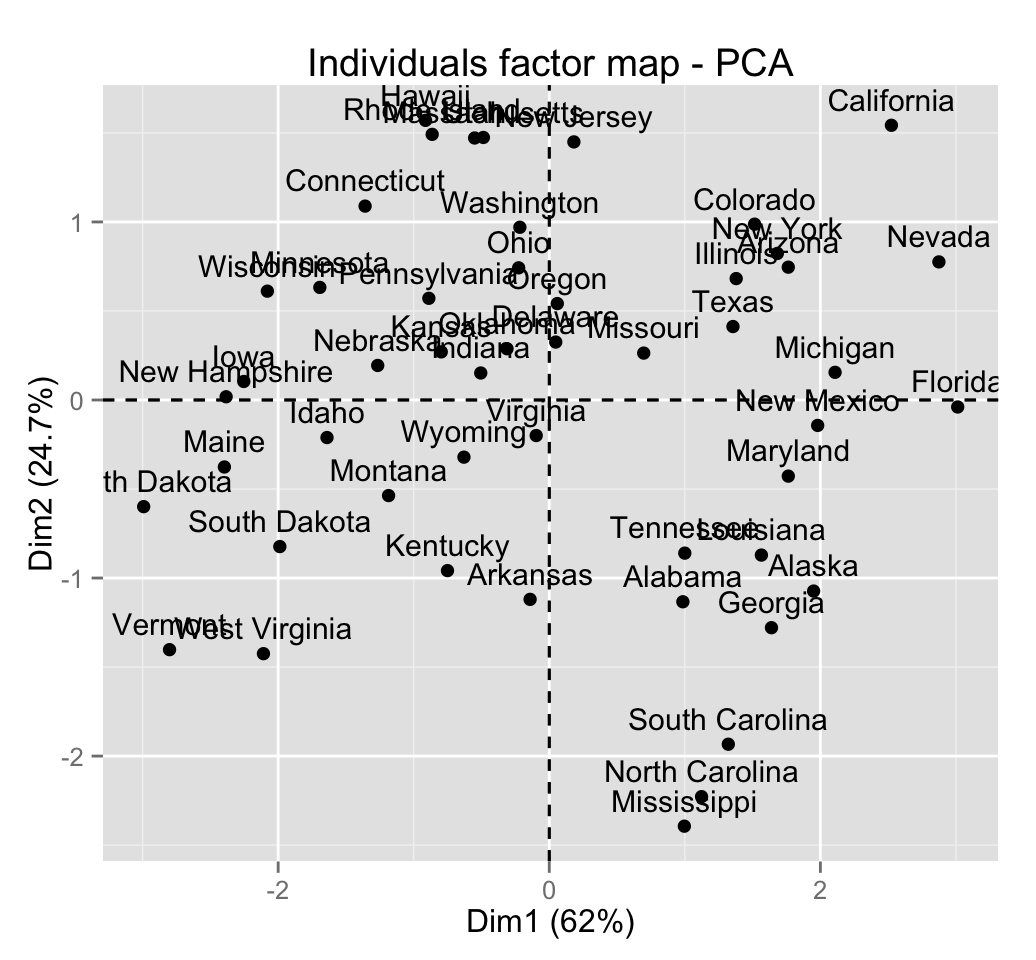
fviz_pca_ind(res.pca)

Clustering on principal component - Unsupervised Machine Learning

The first three dimensions of the PCA retains 96% of the total variance (i.e information) contained in the data:

get_eig(res.pca)
##       eigenvalue variance.percent cumulative.variance.percent
## Dim.1  2.4802416        62.006039                    62.00604
## Dim.2  0.9897652        24.744129                    86.75017
## Dim.3  0.3565632         8.914080                    95.66425
## Dim.4  0.1734301         4.335752                   100.00000

Read more about PCA: Principal Component Analysis (PCA)

3.3.3 Compute hierarchical clustering on the PCA results

The function HCPC() is used:

# Compute PCA with ncp = 3
res.pca <- PCA(USArrests, ncp = 3, graph = FALSE)
# Compute HCPC
res.hcpc <- HCPC(res.pca, graph = FALSE)

The function HCPC() returns a list containing:

  • data.clust: The original data with a supplementary row called class containing the partition.
  • desc.var: The variables describing clusters
  • call$t$res: The outputs of the principal component analysis
  • call$t$tree: The outputs of agnes() function [in cluster package]
  • call$t$nb.clust: The number of optimal clusters estimated
# Data with cluster assignements
head(res.hcpc$data.clust, 10)
##             Murder Assault UrbanPop Rape clust
## Alabama       13.2     236       58 21.2     3
## Alaska        10.0     263       48 44.5     4
## Arizona        8.1     294       80 31.0     4
## Arkansas       8.8     190       50 19.5     3
## California     9.0     276       91 40.6     4
## Colorado       7.9     204       78 38.7     4
## Connecticut    3.3     110       77 11.1     2
## Delaware       5.9     238       72 15.8     2
## Florida       15.4     335       80 31.9     4
## Georgia       17.4     211       60 25.8     3
# Variable describing clusters
res.hcpc$desc.var
## $quanti.var
##               Eta2      P-value
## Assault  0.7841402 2.376392e-15
## Murder   0.7771455 4.927378e-15
## Rape     0.7029807 3.480110e-12
## UrbanPop 0.5846485 7.138448e-09
## 
## $quanti
## $quanti$`1`
##             v.test Mean in category Overall mean sd in category Overall sd
## UrbanPop -3.898420         52.07692       65.540       9.691087  14.329285
## Murder   -4.030171          3.60000        7.788       2.269870   4.311735
## Rape     -4.052061         12.17692       21.232       3.130779   9.272248
## Assault  -4.638172         78.53846      170.760      24.700095  82.500075
##               p.value
## UrbanPop 9.682222e-05
## Murder   5.573624e-05
## Rape     5.076842e-05
## Assault  3.515038e-06
## 
## $quanti$`2`
##             v.test Mean in category Overall mean sd in category Overall sd
## UrbanPop  2.793185         73.87500       65.540       8.652131  14.329285
## Murder   -2.374121          5.65625        7.788       1.594902   4.311735
##              p.value
## UrbanPop 0.005219187
## Murder   0.017590794
## 
## $quanti$`3`
##             v.test Mean in category Overall mean sd in category Overall sd
## Murder    4.357187          13.9375        7.788       2.433587   4.311735
## Assault   2.698255         243.6250      170.760      46.540137  82.500075
## UrbanPop -2.513667          53.7500       65.540       7.529110  14.329285
##               p.value
## Murder   1.317449e-05
## Assault  6.970399e-03
## UrbanPop 1.194833e-02
## 
## $quanti$`4`
##            v.test Mean in category Overall mean sd in category Overall sd
## Rape     5.352124         33.19231       21.232       6.996643   9.272248
## Assault  4.356682        257.38462      170.760      41.850537  82.500075
## UrbanPop 3.028838         76.00000       65.540      10.347798  14.329285
## Murder   2.913295         10.81538        7.788       2.001863   4.311735
##               p.value
## Rape     8.692769e-08
## Assault  1.320491e-05
## UrbanPop 2.454964e-03
## Murder   3.576369e-03
## 
## 
## attr(,"class")
## [1] "catdes" "list "

3.3.4 Visualize the results of HCPC using base plot

The function plot.HCPC() [in FactoMineR] is used:

plot(x, axes = c(1,2), choice = "3D.map", 
     draw.tree = TRUE, ind.names = TRUE, title = NULL,
     tree.barplot = TRUE, centers.plot = FALSE)

  • x: an object of class HCPC
  • axes: the principal components to be plotted
  • choice: a string. Possible values are:
    • “tree”: plots the tree (dendrogram)
    • “bar”: plots bars of inertia gains
    • “map”: plots a factor map. Individuals are colored by cluster
    • “3D.map”: plots the factor map. The tree is added on the plot
  • draw.tree: a logical value. If TRUE, the tree is plotted on the factor map if choice = “map”
  • ind.names: a logical value. If TRUE, individual names are shown
  • title: the title of the grap
  • tree.barplot: a logical value. If TRUE, the barplot of intra inertia losses is added on the tree graph.
  • centers.plot: a logical value. If TRUE, the centers of clusters are drawn on the factor maps


# Principal components + tree
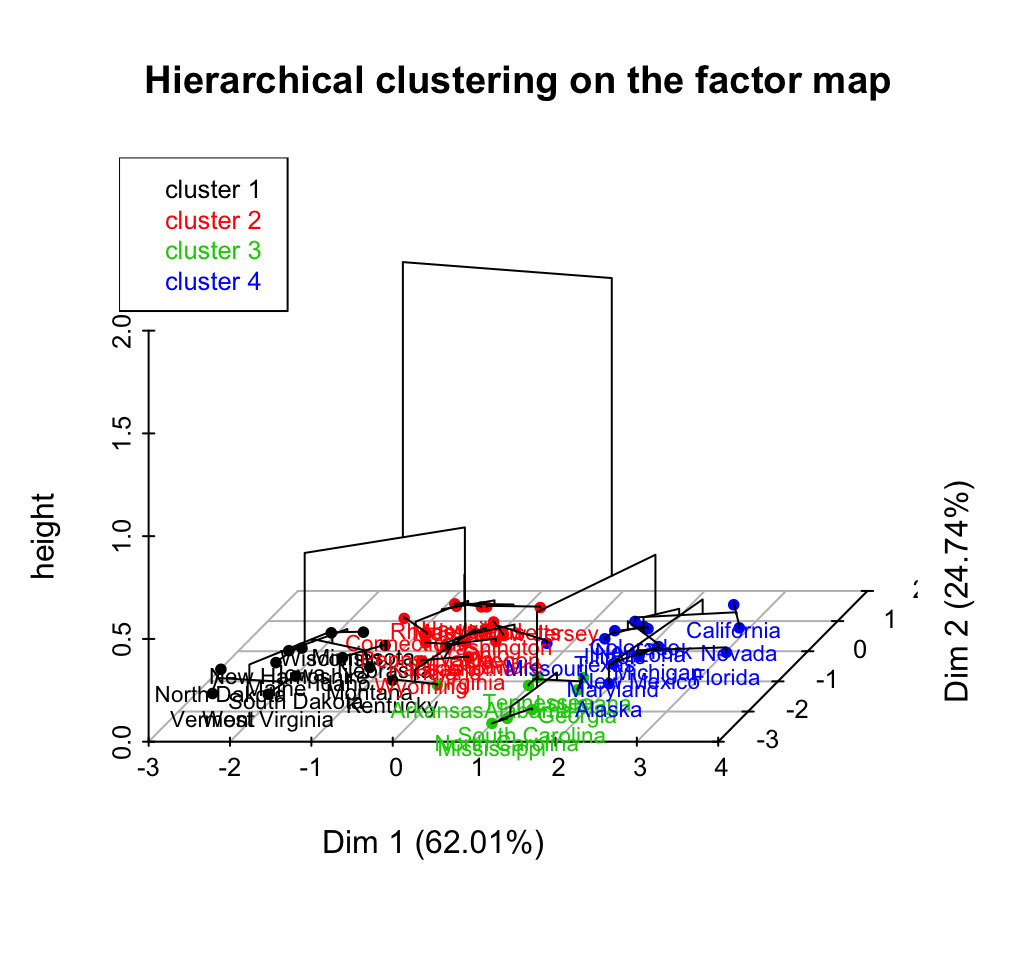
plot(res.hcpc, choice = "3D.map")

Clustering on principal component - Unsupervised Machine Learning

# Plot the dendrogram only
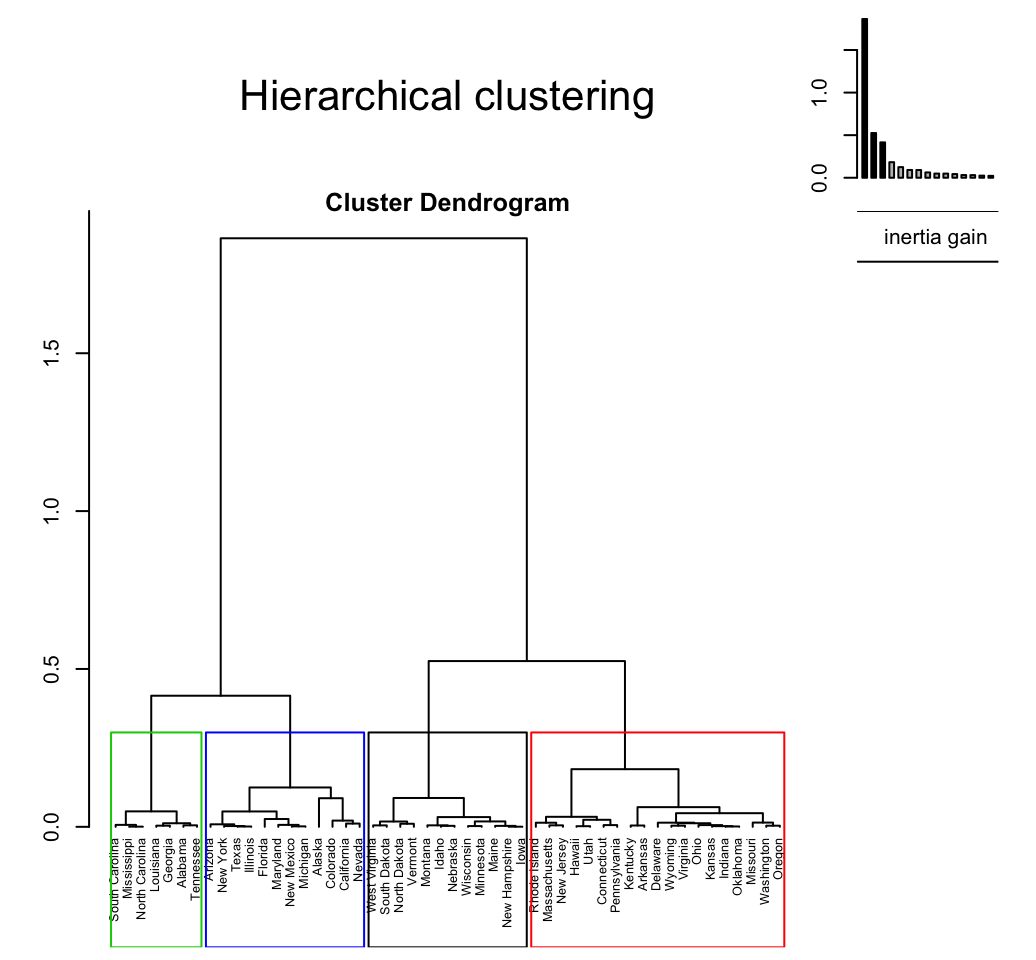
plot(res.hcpc, choice ="tree", cex = 0.6)

Clustering on principal component - Unsupervised Machine Learning

# Draw only the factor map
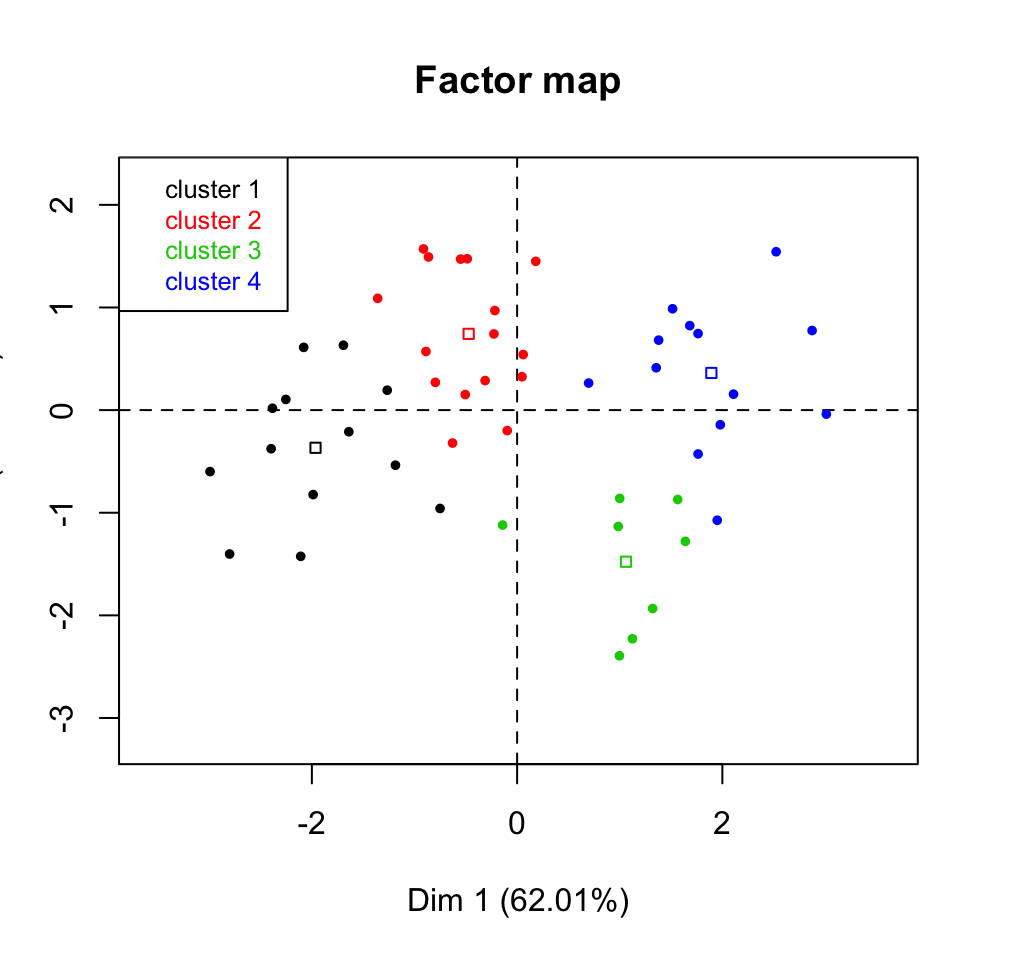
plot(res.hcpc, choice ="map", draw.tree = FALSE)

Clustering on principal component - Unsupervised Machine Learning

# Remove labels and add cluster centers
plot(res.hcpc, choice ="map", draw.tree = FALSE,
     ind.names = FALSE, centers.plot = TRUE)

Clustering on principal component - Unsupervised Machine Learning

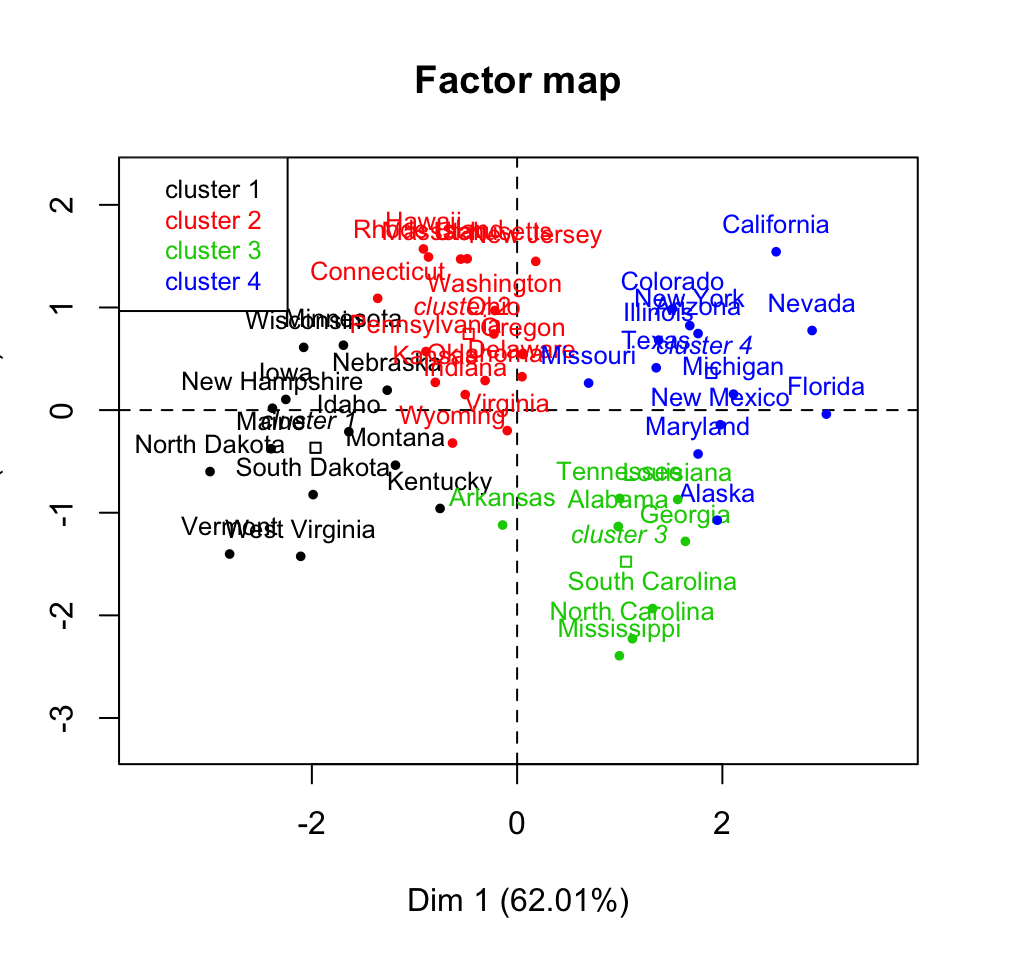
3.3.5 Visualize the results of HCPC using factoextra

The function fviz_cluster() can be used:

fviz_cluster(res.hcpc)

Clustering on principal component - Unsupervised Machine Learning

3.4 Case of categorical variables

Compute CA or MCA and then apply the function HCPC() on the results as described above. If you want to learn more about CA and MCA, read the following articles:

4 Infos

This analysis has been performed using R software (ver. 3.2.1)

  • Husson, F., Josse, J. & Pagès J. (2010). Principal component methods - hierarchical clustering - partitional clustering: why would we need to choose for visualizing data?. Technical report. pdf

facto_summarize - Subset and summarize the output of factor analyses - R software and data mining

$
0
0


Description

Subset and summarize the results of Principal Component Analysis (PCA), Correspondence Analysis (CA) and Multiple Correspondence Analysis (MCA) functions from several packages.

The function facto_summarize() [in factoextra package] is used.

Install and load factoextra

The package devtools is required for the installation as factoextra is hosted on github.

# install.packages("devtools")
devtools::install_github("kassambara/factoextra")

Load factoextra :

library("factoextra")

Usage

facto_summarize(X, element, result = c("coord", "cos2", "contrib"),
                axes = 1:2, select = NULL)

Arguments

Argument Description
X an object of class PCA, CA and MCA [FactoMineR]; prcomp and princomp [stats]; dudi, pca, coa and acm [ade4]; ca [ca package].
element allowed values are “row” and “col” for CA; “var” and “ind” for PCA or MCA.
result the result to be extracted for the element. Possible values are the combination of c(“cos2”, “contrib”, “coord”).
axes a numeric vector specifying the axes of interest. Default values are 1:2 for axes 1 and 2.
select

a selection of variables. Allowed values are NULL or a list containing the arguments name, cos2 or contrib. Default is list(name = NULL, cos2 = NULL, contrib = NULL):

  • name: is a character vector containing variable names to be selected
  • cos2: if cos2 is in [0, 1], ex: 0.6, then variables with a cos2 > 0.6 are selected. if cos2 > 1, ex: 5, then the top 5 variables with the highest cos2 are selected
  • contrib: if contrib > 1, ex: 5, then the top 5 variables with the highest contrib are selected.

Details

If length(axes) > 1, then the columns contrib and cos2 correspond to the total contributions and total cos2 of the axes. In this case, the column coord is calculated as x^2 + y^2 + …+; x, y, … are the coordinates of the points on the specified axes.

Value

A data frame containing the (total) coord, cos2 and the contribution for the axes.

Examples

Principal component analysis

A principal component analysis (PCA) is performed using the built-in R function prcomp() and the decathlon2 [in factoextra] data

data(decathlon2)
decathlon2.active <- decathlon2[1:23, 1:10]
res.pca <- prcomp(decathlon2.active,  scale = TRUE)
# Summarize variables on axes 1:2
facto_summarize(res.pca, "var", axes = 1:2)[,-1]
                    Dim.1       Dim.2     coord      cos2  contrib
X100m        -0.850625692  0.17939806 0.7557477 0.7557477 75.57477
Long.jump     0.794180641 -0.28085695 0.7096035 0.7096035 70.96035
Shot.put      0.733912733 -0.08540412 0.5459218 0.5459218 54.59218
High.jump     0.610083985  0.46521415 0.5886267 0.5886267 58.86267
X400m        -0.701603377 -0.29017826 0.5764507 0.5764507 57.64507
X110m.hurdle -0.764125197  0.02474081 0.5844994 0.5844994 58.44994
Discus        0.743209016 -0.04966086 0.5548258 0.5548258 55.48258
Pole.vault   -0.217268042 -0.80745110 0.6991827 0.6991827 69.91827
Javeline      0.428226639 -0.38610928 0.3324584 0.3324584 33.24584
X1500m        0.004278487 -0.78448019 0.6154275 0.6154275 61.54275
# Select the top 5 contributing variables
facto_summarize(res.pca, "var", axes = 1:2,
           select = list(contrib = 5))[,-1]
                  Dim.1      Dim.2     coord      cos2  contrib
X100m      -0.850625692  0.1793981 0.7557477 0.7557477 75.57477
Long.jump   0.794180641 -0.2808570 0.7096035 0.7096035 70.96035
Pole.vault -0.217268042 -0.8074511 0.6991827 0.6991827 69.91827
X1500m      0.004278487 -0.7844802 0.6154275 0.6154275 61.54275
High.jump   0.610083985  0.4652142 0.5886267 0.5886267 58.86267
# Select variables with cos2 >= 0.6
facto_summarize(res.pca, "var", axes = 1:2,
           select = list(cos2 = 0.6))[,-1]
                  Dim.1      Dim.2     coord      cos2  contrib
X100m      -0.850625692  0.1793981 0.7557477 0.7557477 75.57477
Long.jump   0.794180641 -0.2808570 0.7096035 0.7096035 70.96035
Pole.vault -0.217268042 -0.8074511 0.6991827 0.6991827 69.91827
X1500m      0.004278487 -0.7844802 0.6154275 0.6154275 61.54275
# Select by names
facto_summarize(res.pca, "var", axes = 1:2,
     select = list(name = c("X100m", "Discus", "Javeline")))[,-1]
              Dim.1       Dim.2     coord      cos2  contrib
X100m    -0.8506257  0.17939806 0.7557477 0.7557477 75.57477
Discus    0.7432090 -0.04966086 0.5548258 0.5548258 55.48258
Javeline  0.4282266 -0.38610928 0.3324584 0.3324584 33.24584
# Summarize individuals on axes 1:2
facto_summarize(res.pca, "ind", axes = 1:2)[,-1]
                 Dim.1      Dim.2      coord      cos2   contrib
SEBRLE       0.1912074 -1.5541282  2.4518746 0.5050034 10.660324
CLAY         0.7901217 -2.4204156  6.4827039 0.5057178 28.185669
BERNARD     -1.3292592 -1.6118687  4.3650507 0.4871654 18.978481
YURKOV      -0.8694134  0.4328779  0.9432630 0.1199355  4.101143
ZSIVOCZKY   -0.1057450  2.0233632  4.1051806 0.5779938 17.848611
McMULLEN     0.1185550  0.9916237  0.9973729 0.1543704  4.336404
MARTINEAU   -2.3923532  1.2849234  7.3743818 0.5205607 32.062530
HERNU       -1.8910497 -1.1784614  4.9648401 0.5543447 21.586261
BARRAS      -1.7744575  0.4125321  3.3188820 0.6495490 14.429922
NOOL        -2.7770058  1.5726757 10.1850700 0.6469840 44.282913
BOURGUIGNON -4.4137335 -1.2635770 21.0776704 0.9301572 91.642045
Sebrle       3.4514485 -1.2169193 13.3933893 0.7593400 58.232127
Clay         3.3162243 -1.6232908 13.6324164 0.8523470 59.271375
Karpov       4.0703560  0.7983510 17.2051623 0.8138146 74.805053
Macey        1.8484623  2.0638828  7.6764252 0.8165181 33.375762
Warners      1.3873514 -0.2819083  2.0042163 0.2662078  8.713984
Zsivoczky    0.4715533  0.9267436  1.0812163 0.2190667  4.700940
Hernu        0.2763118  1.1657260  1.4352654 0.4666709  6.240284
Bernard      1.3672590  1.4780354  4.0539857 0.6274807 17.626025
Schwarzl    -0.7102777 -0.6584251  0.9380181 0.2170229  4.078340
Pogorelov   -0.2143524 -0.8610557  0.7873639 0.1337231  3.423321
Schoenbeck  -0.4953166 -1.3000530  1.9354762 0.5291161  8.415114
Barras      -0.3158867  0.8193681  0.7711485 0.1466237  3.352820

Correspondence Analysis

The function CA() in FactoMineR package is used:

# Install and load FactoMineR to compute CA
# install.packages("FactoMineR")
library("FactoMineR")
data("housetasks")
res.ca <- CA(housetasks, graph = FALSE)
# Summarize row variables on axes 1:2
facto_summarize(res.ca, "row", axes = 1:2)[,-1]
                Dim.1      Dim.2     coord      cos2   contrib
Laundry    -0.9918368  0.4953220 1.2290841 0.9245395 12.403601
Main_meal  -0.8755855  0.4901092 1.0068569 0.9739621  8.833091
Dinner     -0.6925740  0.3081043 0.5745869 0.9303433  3.558222
Breakfeast -0.5086002  0.4528038 0.4637054 0.9051733  3.722406
Tidying    -0.3938084 -0.4343444 0.3437401 0.9748275  2.404604
Dishes     -0.1889641 -0.4419662 0.2310416 0.7642703  1.497001
Shopping   -0.1176813 -0.4033171 0.1765136 0.8113088  1.214543
Official    0.2266324  0.2536132 0.1156819 0.1194711  0.636781
Driving     0.7417696  0.6534143 0.9771724 0.7672477  7.788243
Finances    0.2707669 -0.6178684 0.4550760 0.9973464  2.948600
Insurance   0.6470759 -0.4737832 0.6431778 0.8848140  5.126245
Repairs     1.5287787  0.8642647 3.0841176 0.9326072 29.178865
Holidays    0.2524863 -1.4350066 2.1229933 0.9921522 19.477003
# Summarize column variables on axes 1:2
facto_summarize(res.ca, "col", axes = 1:2)[,-1]
                  Dim.1      Dim.2      coord      cos2  contrib
Wife        -0.83762154  0.3652207 0.83499601 0.9543242 28.72693
Alternating -0.06218462  0.2915938 0.08889388 0.1098815  1.29467
Husband      1.16091847  0.6019199 1.71003929 0.9795683 37.35808
Jointly      0.14942609 -1.0265791 1.07619274 0.9979998 31.40952

Multiple Correspondence Analysis

The function MCA() in FactoMineR package is used:

library(FactoMineR)
data(poison)
res.mca <- MCA(poison, quanti.sup = 1:2,
              quali.sup = 3:4, graph=FALSE)
# Summarize variables on axes 1:2
res <- facto_summarize(res.mca, "var", axes = 1:2)
head(res)
             name      Dim.1       Dim.2      coord      cos2   contrib
Nausea_n Nausea_n  0.2673909  0.12139029 0.08623348 0.3090033 0.6128991
Nausea_y Nausea_y -0.9581506 -0.43498187 1.10726185 0.3090033 2.1962218
Vomit_n   Vomit_n  0.4790279 -0.40919465 0.39690803 0.5953620 2.1649529
Vomit_y   Vomit_y -0.7185419  0.61379197 0.89304306 0.5953620 3.2474293
Abdo_n     Abdo_n  1.3180221 -0.03574501 1.73845988 0.8457372 5.1722773
Abdo_y     Abdo_y -0.6411999  0.01738946 0.41143974 0.8457372 2.5162430
# Summarize individuals on axes 1:2
res <- facto_summarize(res.mca, "ind", axes = 1:2)
head(res)
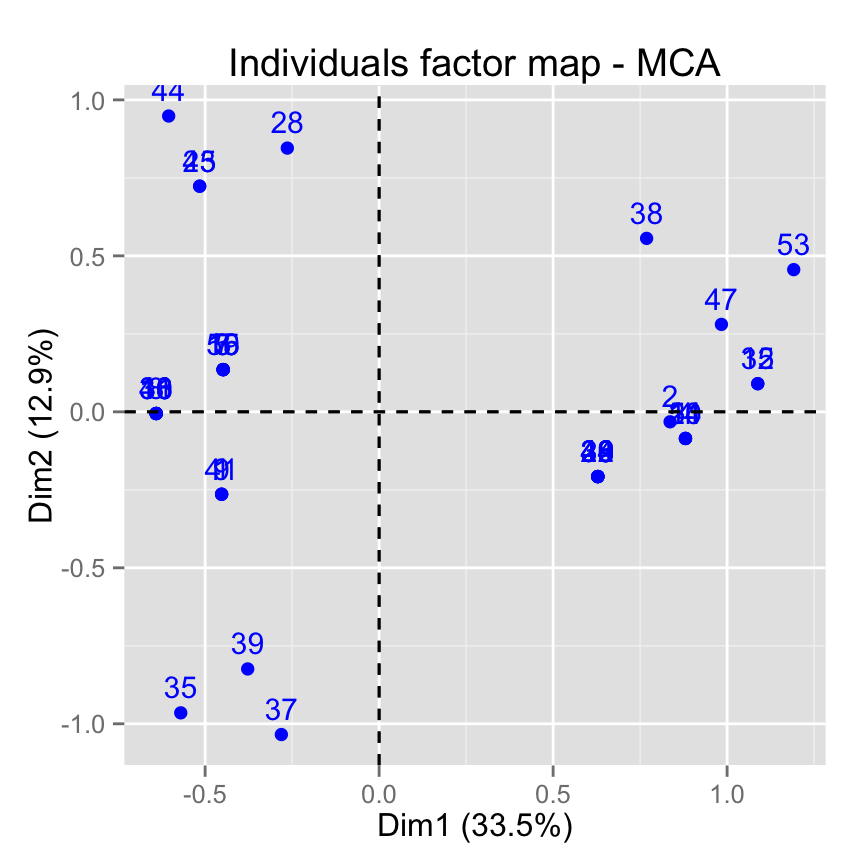
  name      Dim.1       Dim.2     coord       cos2   contrib
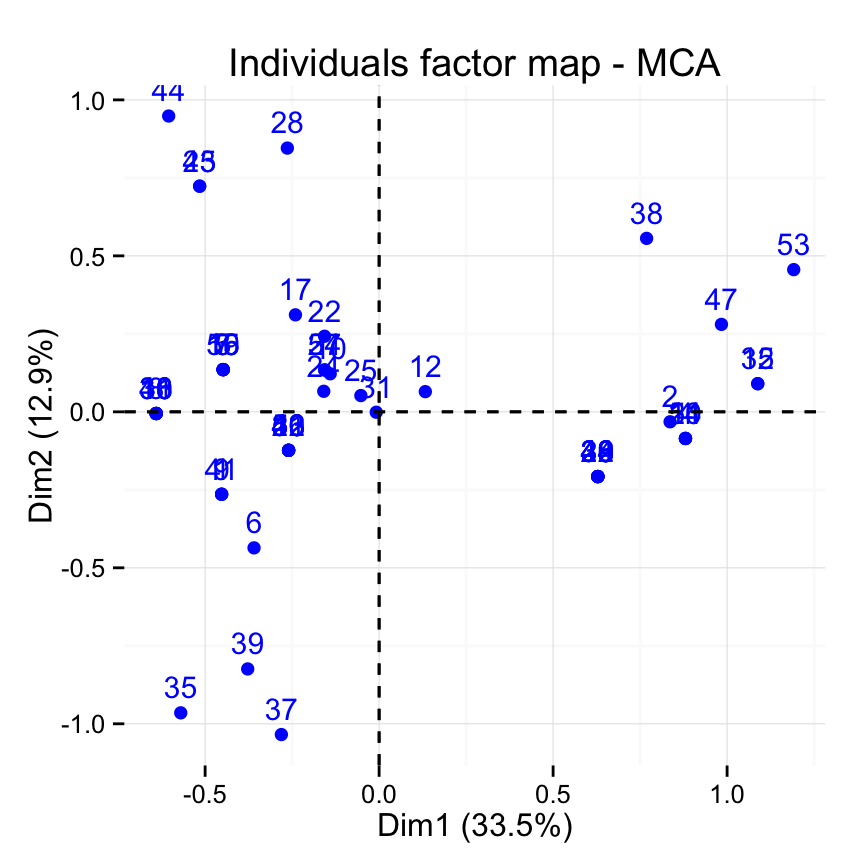
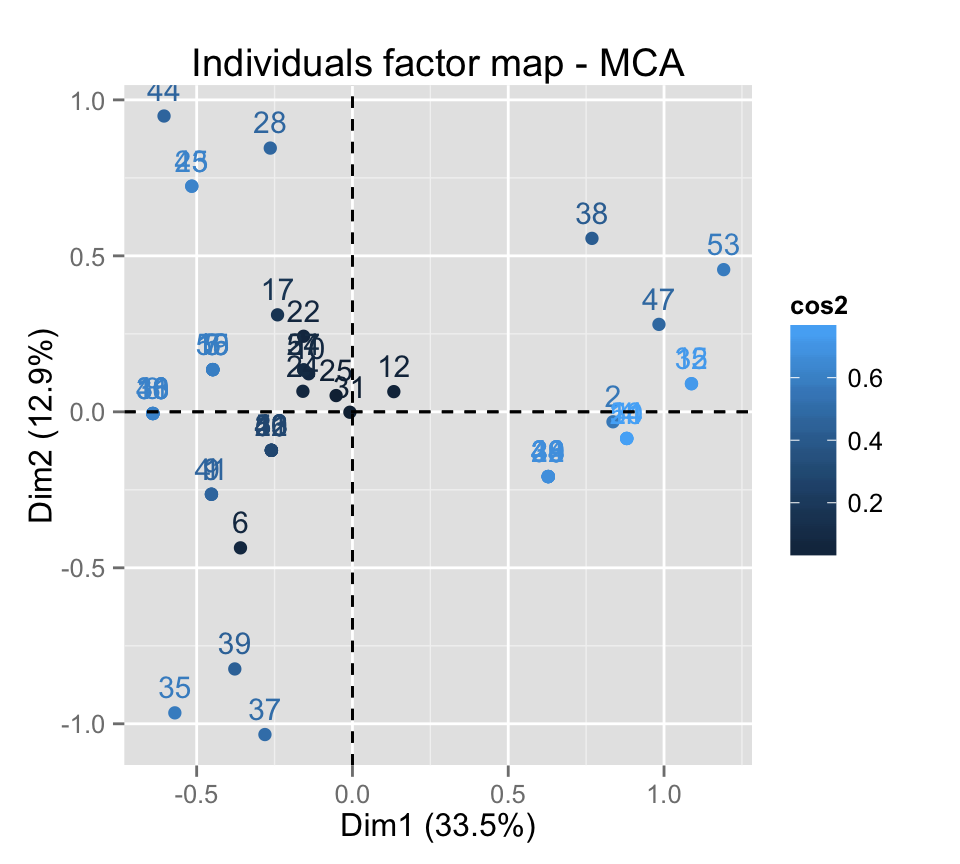
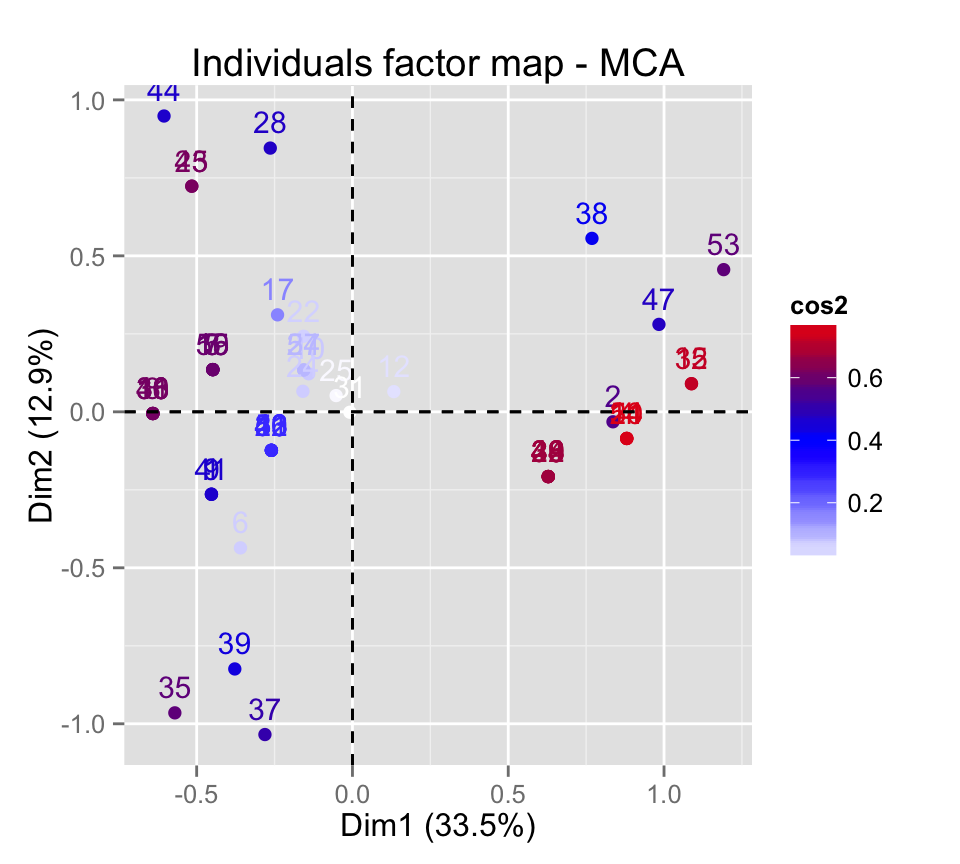
1    1 -0.4525811 -0.26415072 0.2746052 0.46457063 0.4992822
2    2  0.8361700 -0.03193457 0.7002000 0.55670644 1.2730909
3    3 -0.4481892  0.13538726 0.2192032 0.59815656 0.3985513
4    4  0.8803694 -0.08536230 0.7823370 0.75476958 1.4224310
5    5 -0.4481892  0.13538726 0.2192032 0.59815656 0.3985513
6    6 -0.3594324 -0.43604390 0.3193260 0.06143111 0.5805927

Infos

This analysis has been performed using R software (ver. 3.1.2) and factoextra (ver. 1.0.2)

fviz_ca: Quick Correspondence Analysis data visualization using factoextra - R software and data mining

$
0
0


Description

Graph of column/row variables from the output of Correspondence Analysis (CA).

The following functions, from factoextra package are use:

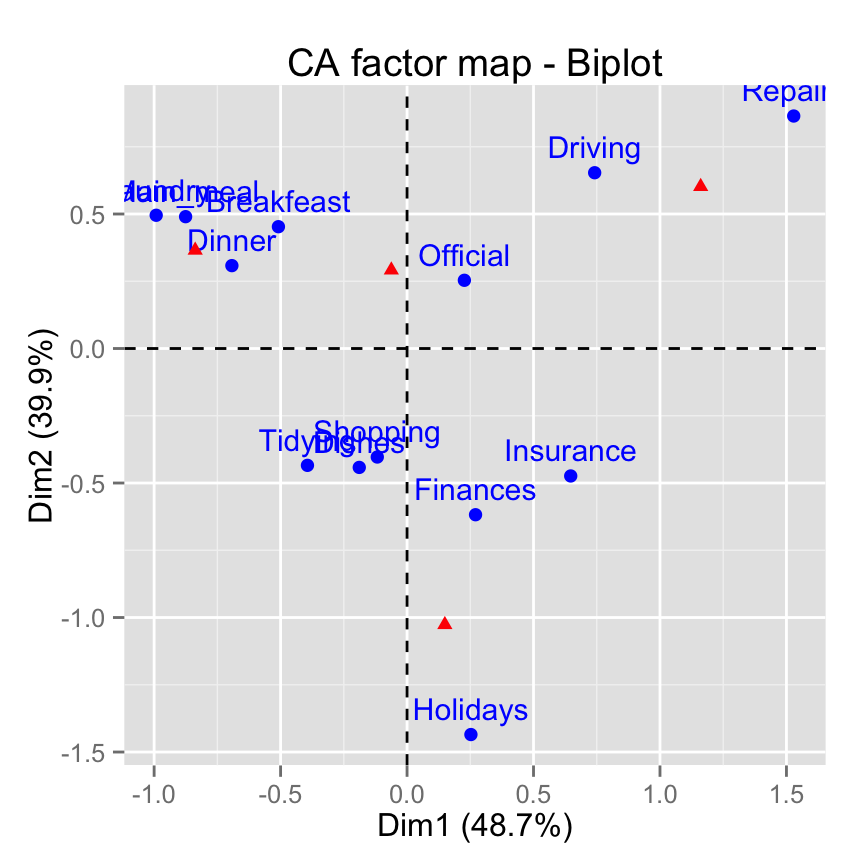
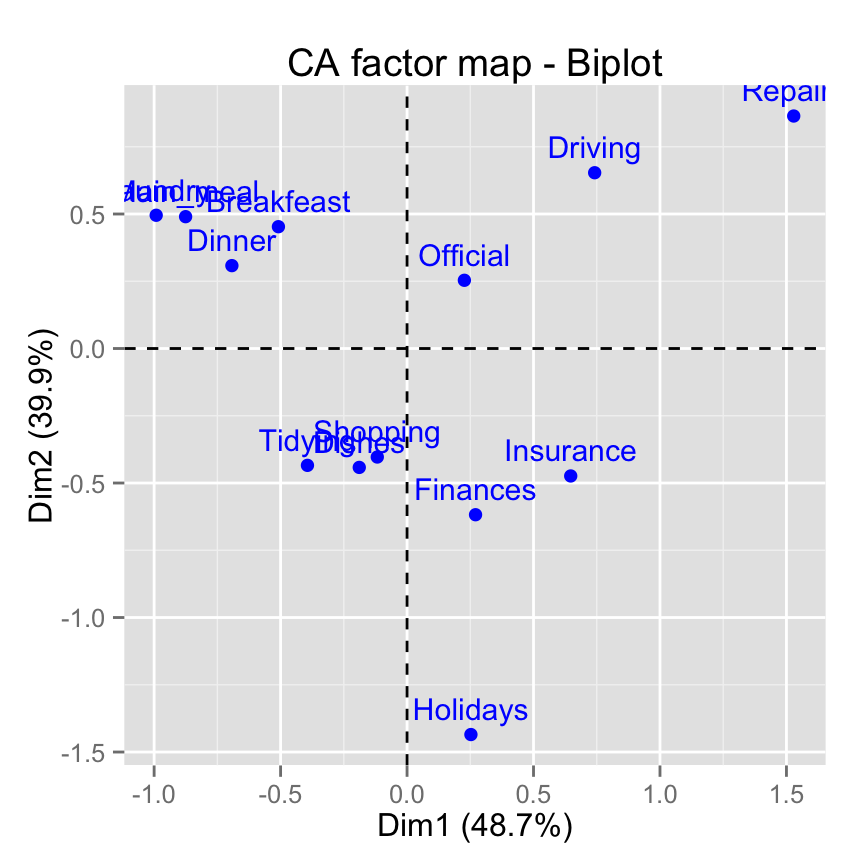
  • fviz_ca_row(): Graph of row variables
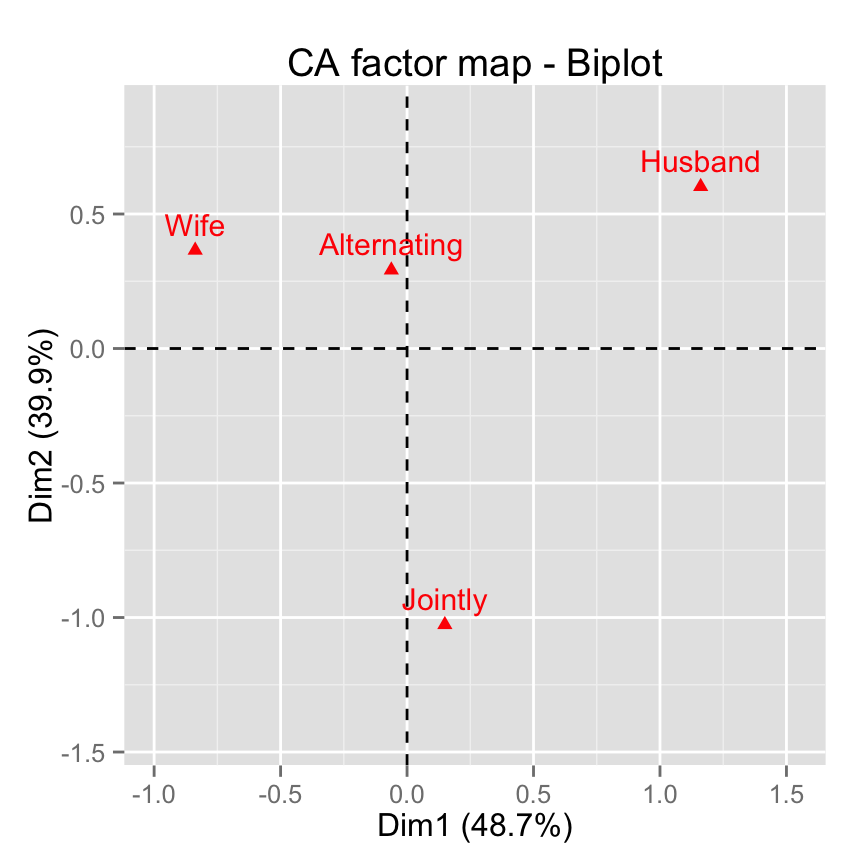
  • fviz_ca_col(): Graph of column variables
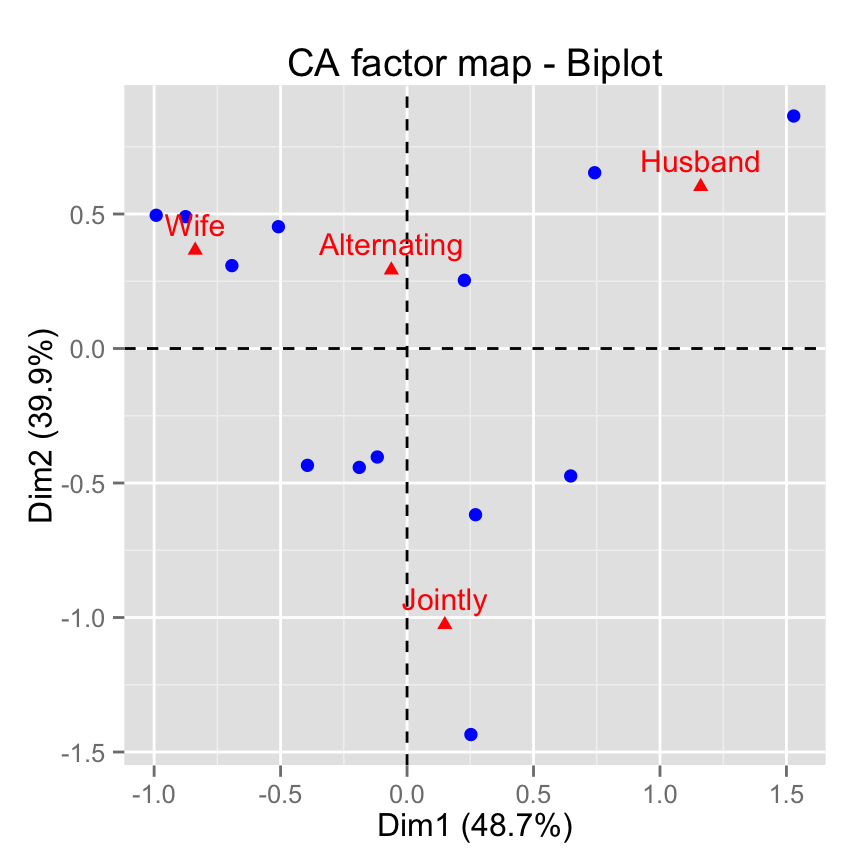
  • fviz_ca_biplot(): Biplot of row and column variables
  • fviz_ca(): An alias of fviz_ca_biplot()

These functions are included in factoextra package.

Install and load factoextra

The package devtools is required for the installation as factoextra is hosted on github.

# install.packages("devtools")
library("devtools")
install_github("kassambara/factoextra")

Load factoextra :

library("factoextra")

Usage

# Graph of row variables
fviz_ca_row(X, axes = c(1, 2), shape.row = 19,
  geom = c("point", "text"), label = "all", 
  invisible = "none", labelsize = 4, pointsize = 2,
  col.row = "blue", col.row.sup = "darkblue", alpha.row = 1,
  select.row = list(name = NULL, cos2 = NULL, contrib = NULL),
  map = "symmetric",
  jitter = list(what = "label", width = NULL, height = NULL), ...)

# Graph of column variables
fviz_ca_col(X, axes = c(1, 2), shape.col = 17,
  geom = c("point", "text"), label = "all",
  invisible = "none", labelsize = 4, pointsize = 2,
  col.col = "red", col.col.sup = "darkred", alpha.col = 1,
  select.col = list(name = NULL, cos2 = NULL, contrib = NULL),
  map = "symmetric",
 jitter = list(what = "label", width = NULL, height = NULL), ...)

# Biplot of row and column  variables
fviz_ca_biplot(X, axes = c(1, 2), shape.row = 19, shape.col = 17,
  geom = c("point", "text"), label = "all", invisible = "none",
  labelsize = 4, pointsize = 2, col.col = "red",
  col.col.sup = "darkred", alpha.col = 1, col.row = "blue",
  col.row.sup = "darkblue", alpha.row = 1,
  select.col = list(name = NULL, cos2 = NULL, contrib = NULL),
  select.row = list(name = NULL, cos2 = NULL, contrib = NULL),
  map = "symmetric", arrows = c(FALSE, FALSE),
  jitter = list(what = "label", width = NULL, height = NULL), ...)


# An alias of fviz_ca_biplot()
fviz_ca(X, ...)

Arguments

<td>**jitter**</td><td>a parameter used to jitter the points in order to reduce overplotting. It's a list containing the objects *what, width and height* (Ex.; jitter = list(what, width, height)). **what**: the element to be jittered. Possible values are "point" or "p"; "label" or "l"; "both" or "b". **width**: degree of jitter in x direction (ex: 0.2).  **height**: degree of jitter in y direction (ex: 0.2).</td></tr>
<td>**alpha.col,alpha.row**</td><td>controls the transparency of colors. The value can variate from 0 (total transparency) to 1 (no transparency). Default value is 1. Allowed values include also : "cos2", "contrib", "coord", "x" or "y" as for the arguments col.col and col.row..</td></tr>
Argument Description
X an object of class CA [FactoMineR], ca [ca], coa [ade4]; correspondence [MASS].
axes a numeric vector of length 2 specifying the dimensions to be plotted.
shape.row,shape.col the point shapes to be used for row/column variables. Default values are 19 for rows and 17 for columns.
geom a text specifying the geometry to be used for the graph. Allowed values are the combination of c(“point”, “arrow”, “text”). Use “point” (to show only points); “text” to show only labels; c(“point”, “text”) or c(“arrow”, “text”) to show both types.
label a character vector specifying the elements to be labelled. Default value is “all”. Allowed values are “none” or the combination of c(“row”, “row.sup”, “col”, “col.sup”). Use “col” to label only active column variables; “col.sup” to label only supplementary columns; etc
invisible a character value specifying the elements to be hidden on the plot. Default value is “none”. Allowed values are the combination of c(“row”, “row.sup”, “col”, col.sup“).
labelsize font size for the labels.
pointsize the size of points.
map character string specifying the map type. Allowed options include: “symmetric”, “rowprincipal”, “colprincipal”, “symbiplot”, “rowgab”, “colgab”, “rowgreen” and “colgreen”. See details
col.col,col.row color for column/row points. The default values are “red” and “blue”, respectively. Allowed values include also : “cos2”, “contrib”, “coord”, “x” or “y”. In this case, the colors for row/column variables are automatically controlled by their qualities (“cos2”), contributions (“contrib”), coordinates (x^2 + y^2, “coord”), x values(“x”) or y values(“y”)
col.col.sup,col.row.sup colors for the supplementary column and row points, respectively.
select.col,select.row

a selection of columns/rows to be drawn. Allowed values are NULL or a list containing the arguments name, cos2 or contrib:

  • name: is a character vector containing columns/rows to be drawn
  • cos2: if cos2 is in [0, 1], ex: 0.6, then columns/rows with a cos2 > 0.6 are drawn. if cos2 > 1, ex: 5, then the top 5 columns/rows with the highest cos2 are drawn.
  • contrib: if contrib > 1, ex: 5, then the top 5 columns/rows with the highest cos2 are drawn
arrows Vector of two logicals specifying if the plot should contain points (FALSE, default) or arrows (TRUE). First value sets the rows and the second value sets the columns.
… Optional arguments.

Details

The default plot of CA is a “symmetric” plot in which both rows and columns are in principal coordinates. In this situation, it’s not possible to interpret the distance between row points and column points. To overcome this problem, the simplest way is to make an asymmetric plot. This means that, the column profiles must be presented in row space or vice-versa. The allowed options for the argument map are:

  • “rowprincipal” or “colprincipal”: asymmetric plots with either rows in principal coordinates and columns in standard coordinates, or vice versa. These plots preserve row metric or column metric respectively.

  • “symbiplot”: Both rows and columns are scaled to have variances equal to the singular values (square roots of eigenvalues), which gives a symmetric biplot but does not preserve row or column metrics.

  • “rowgab” or “colgab”: Asymmetric maps, proposed by Gabriel & Odoroff (1990), with rows (respectively, columns) in principal coordinates and columns (respectively, rows) in standard coordinates multiplied by the mass of the corresponding point.

  • “rowgreen” or “colgreen”: The so-called contribution biplots showing visually the most contributing points (Greenacre 2006b). These are similar to “rowgab” and “colgab” except that the points in standard coordinates are multiplied by the square root of the corresponding masses, giving reconstructions of the standardized residuals.

Value

A ggplot2 plot

Examples

Correspondence Analysis

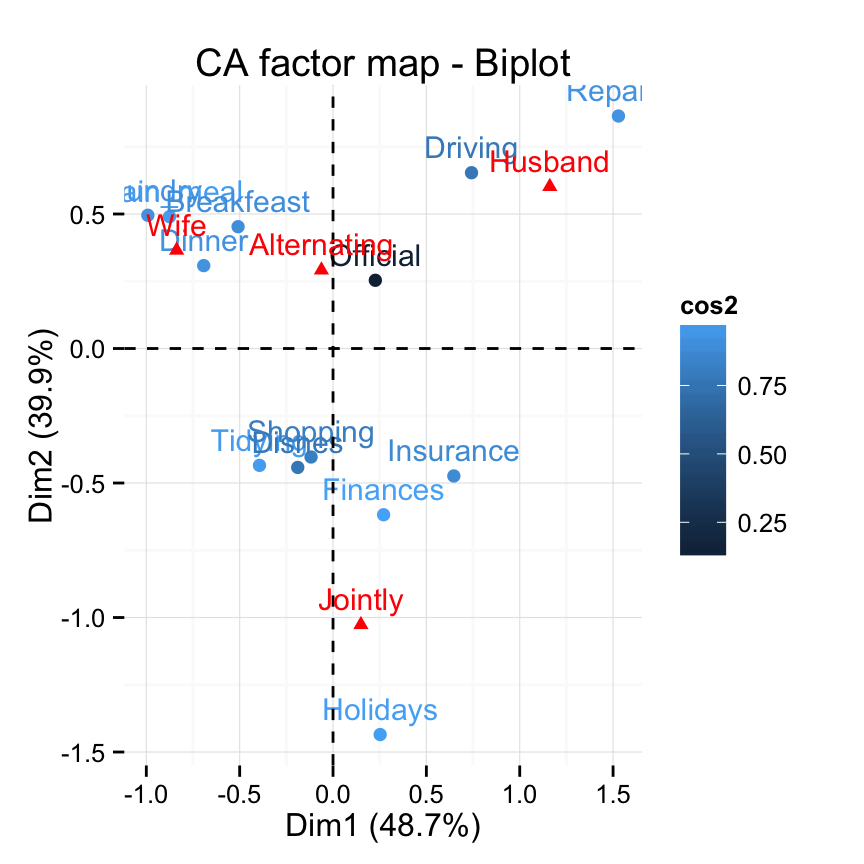
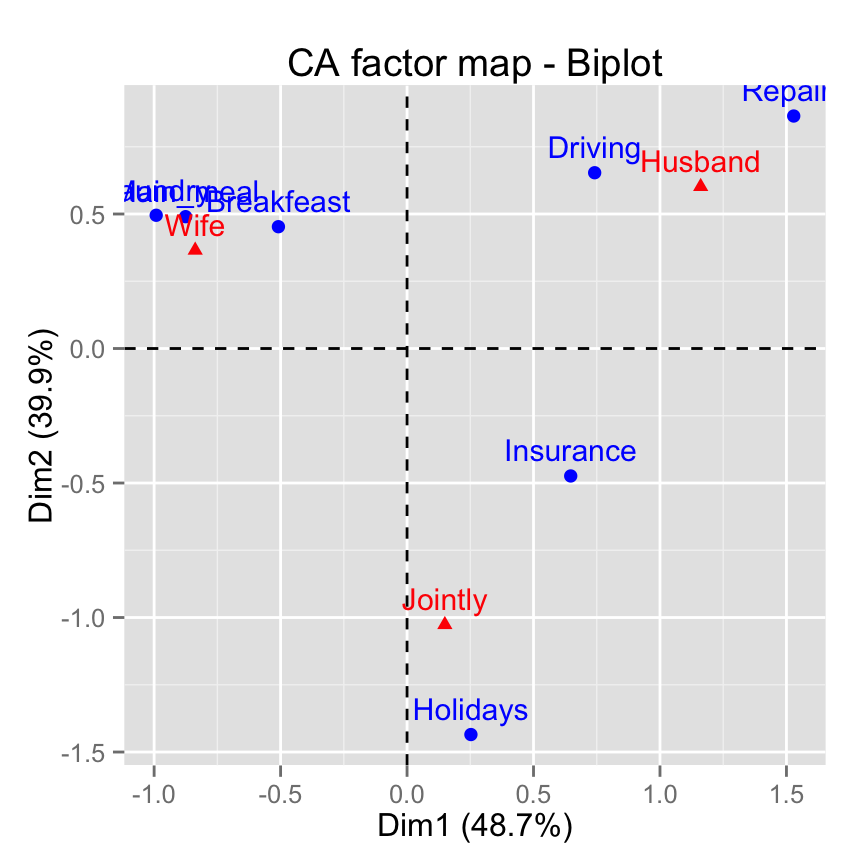
Correspondence Analysis (CA) is performed using the function CA() [in FactoMineR] and housetasks data [in factoextra]:

# Install and load FactoMineR to compute CA
# install.packages("FactoMineR")
library("FactoMineR")
data(housetasks)
head(housetasks)
           Wife Alternating Husband Jointly
Laundry     156          14       2       4
Main_meal   124          20       5       4
Dinner       77          11       7      13
Breakfeast   82          36      15       7
Tidying      53          11       1      57
Dishes       32          24       4      53
res.ca <- CA(housetasks, graph=FALSE)

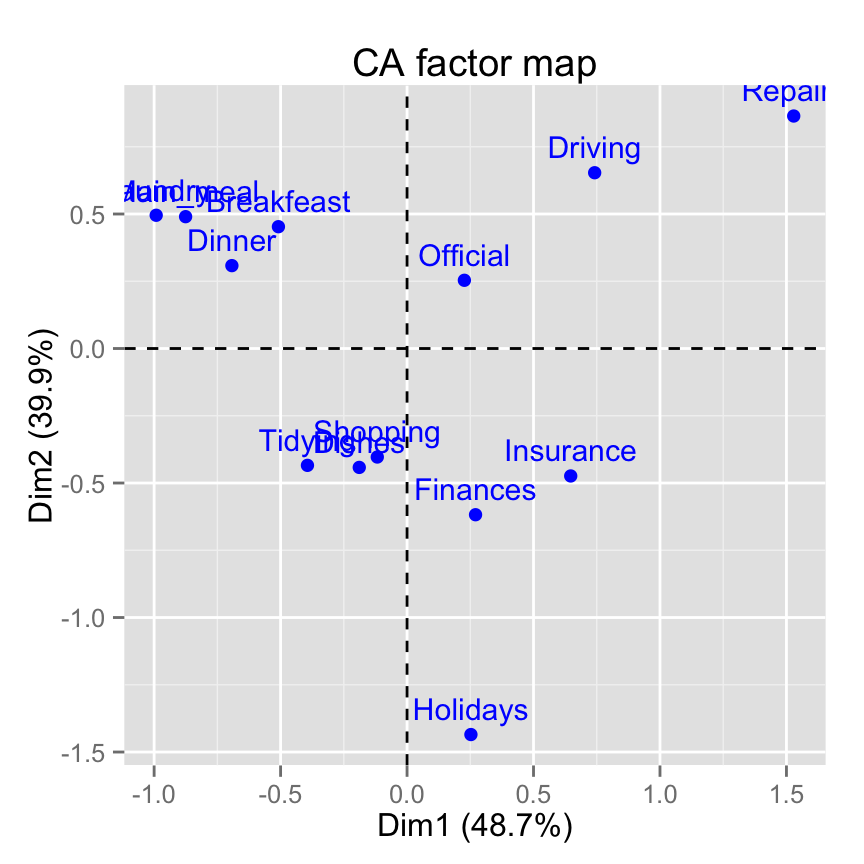
fviz_ca_row(): Graph of row variables

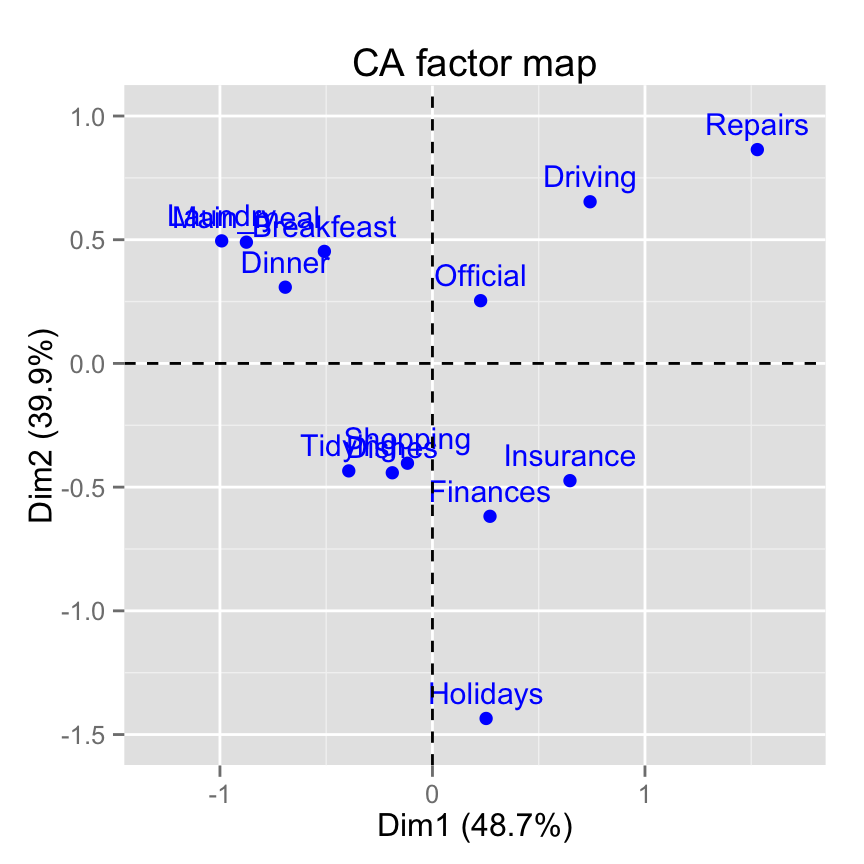
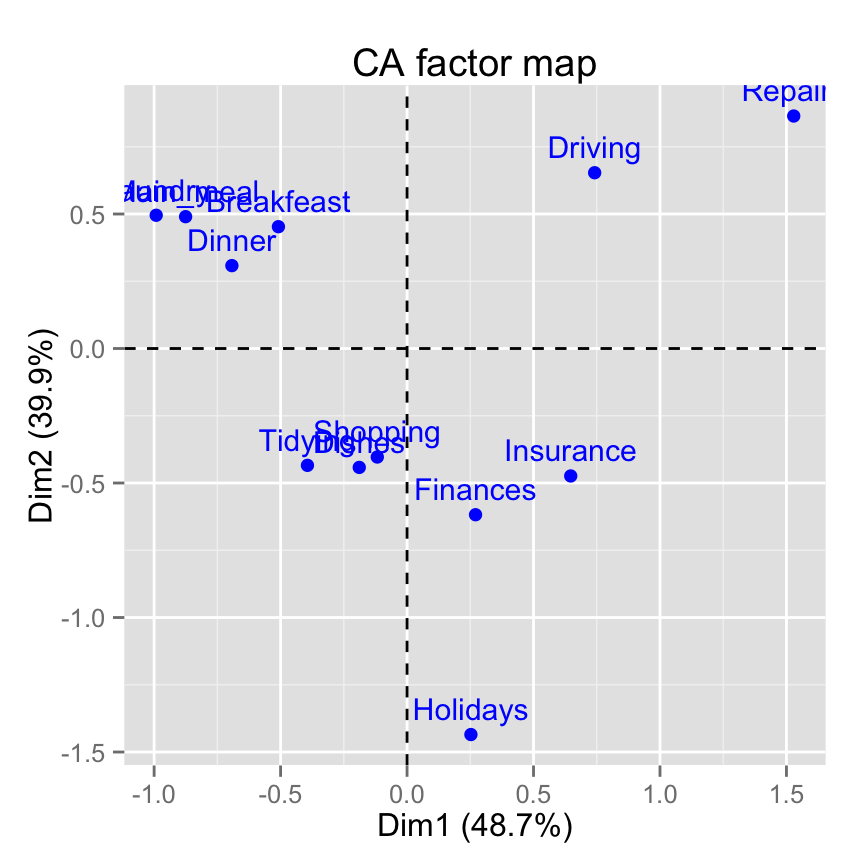
# Default plot
fviz_ca_row(res.ca)

Quick Correspondence Analysis data visualization using factoextra - R software and data mining

# Change title and axis labels
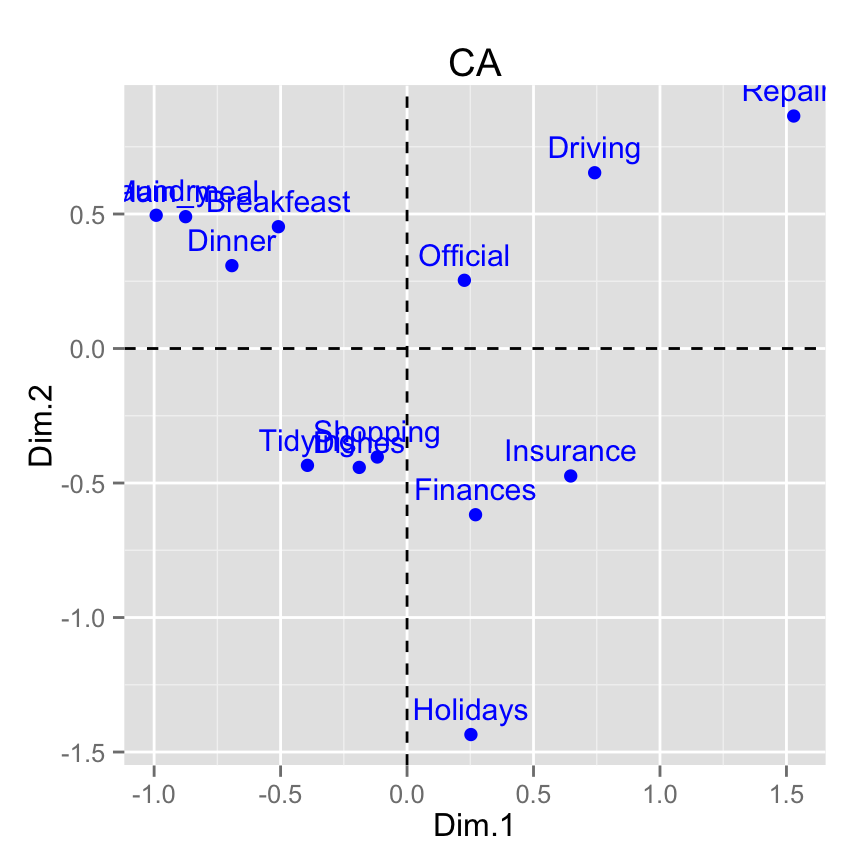
fviz_ca_row(res.ca) +
 labs(title = "CA", x = "Dim.1", y ="Dim.2" )

Quick Correspondence Analysis data visualization using factoextra - R software and data mining

# Change axis limits by specifying the min and max
fviz_ca_row(res.ca) +
   xlim(-1.3, 1.7) + ylim (-1.5, 1)

Quick Correspondence Analysis data visualization using factoextra - R software and data mining

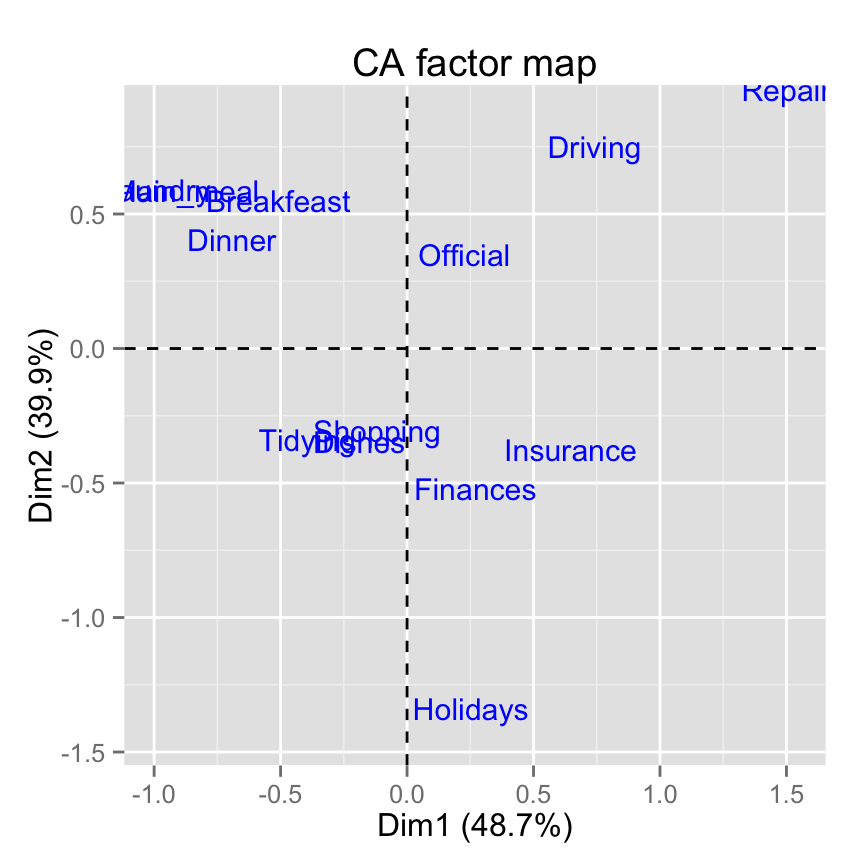
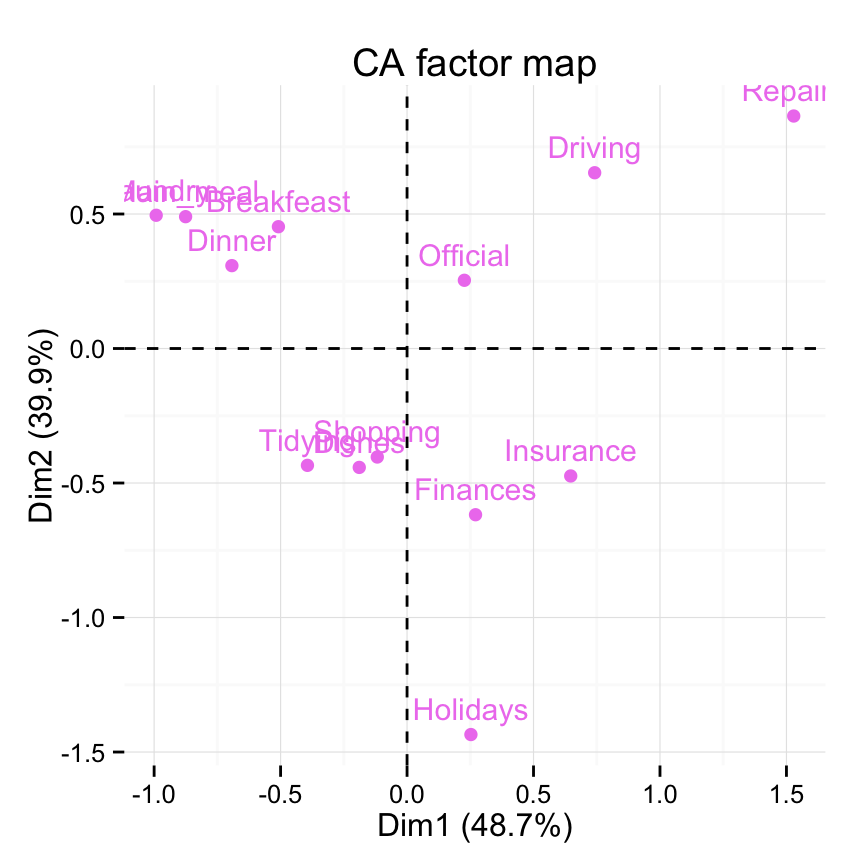
# Use text only
fviz_ca_row(res.ca, geom = "text")

Quick Correspondence Analysis data visualization using factoextra - R software and data mining

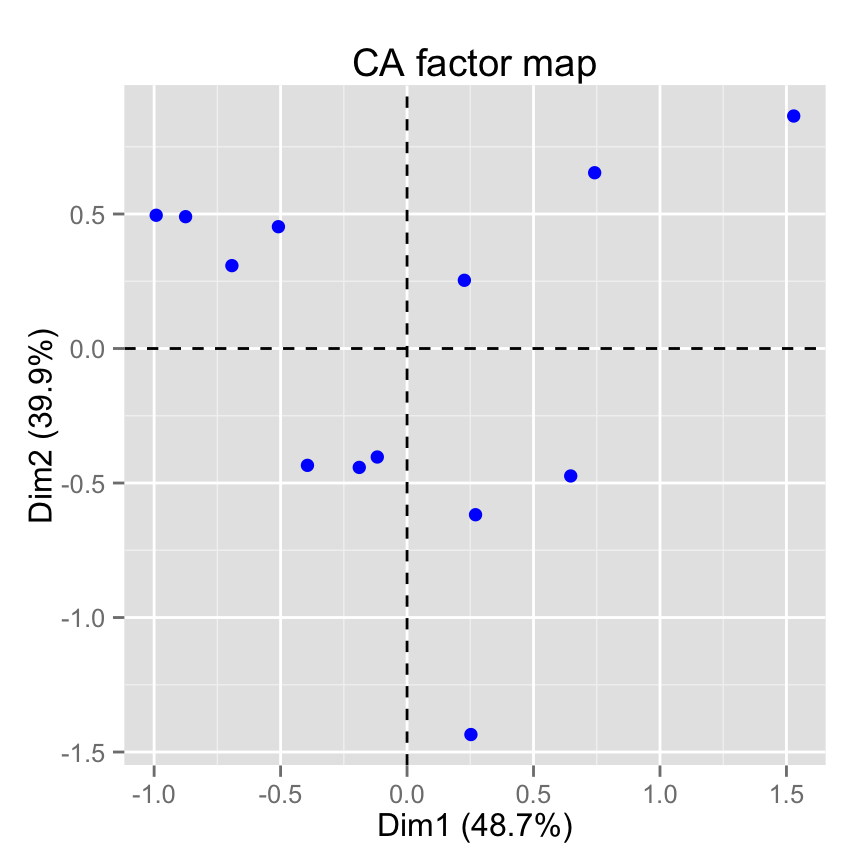
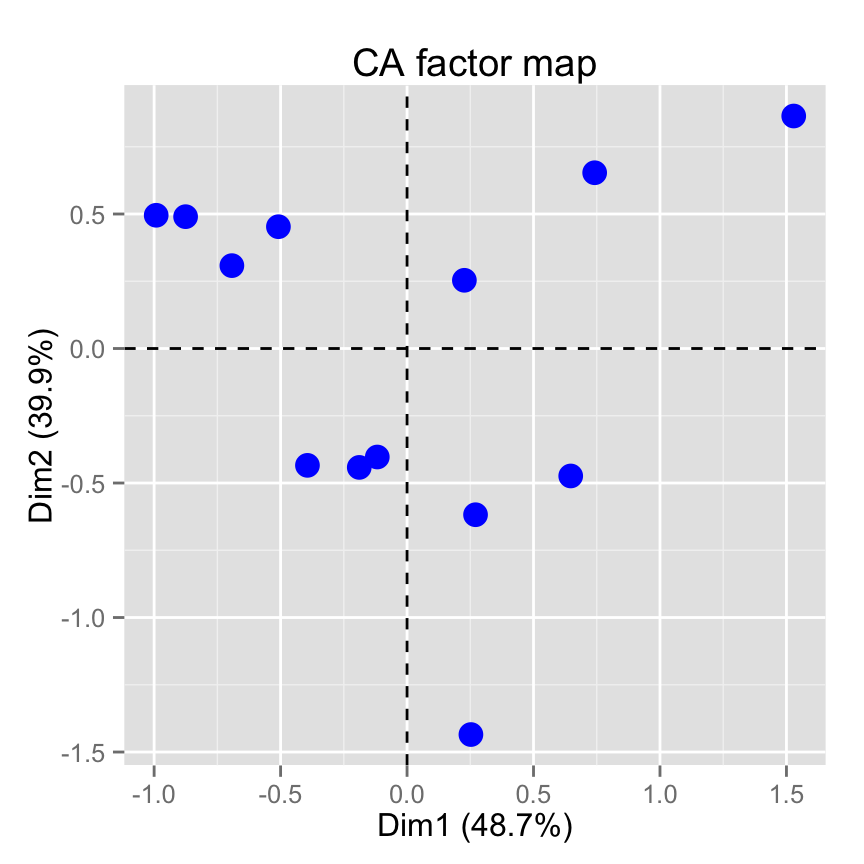
# Use points only
fviz_ca_row(res.ca, geom="point")

Quick Correspondence Analysis data visualization using factoextra - R software and data mining

# Change the size of points
fviz_ca_row(res.ca, geom="point", pointsize = 4)

Quick Correspondence Analysis data visualization using factoextra - R software and data mining

# Change point color and theme
fviz_ca_row(res.ca, col.row = "violet")+
   theme_minimal()

Quick Correspondence Analysis data visualization using factoextra - R software and data mining

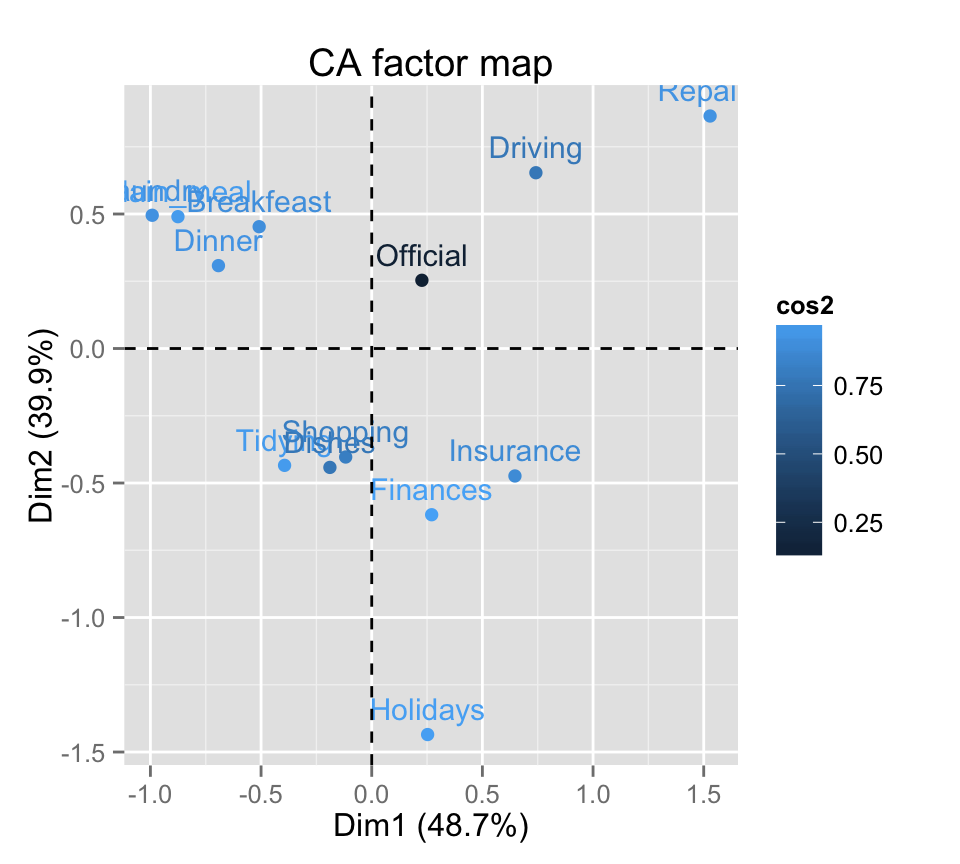
# Control automatically the color of row points
# using the cos2 or the contributions
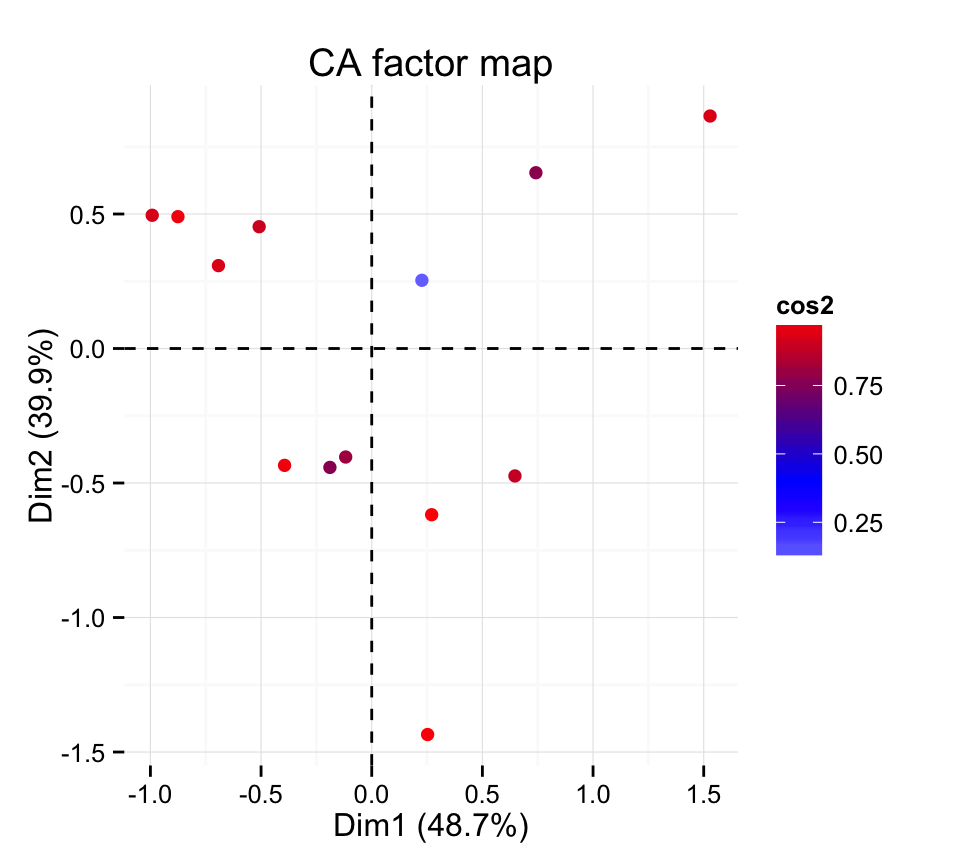
# cos2 = the quality of the rows on the factor map
fviz_ca_row(res.ca, col.row="cos2")

Quick Correspondence Analysis data visualization using factoextra - R software and data mining

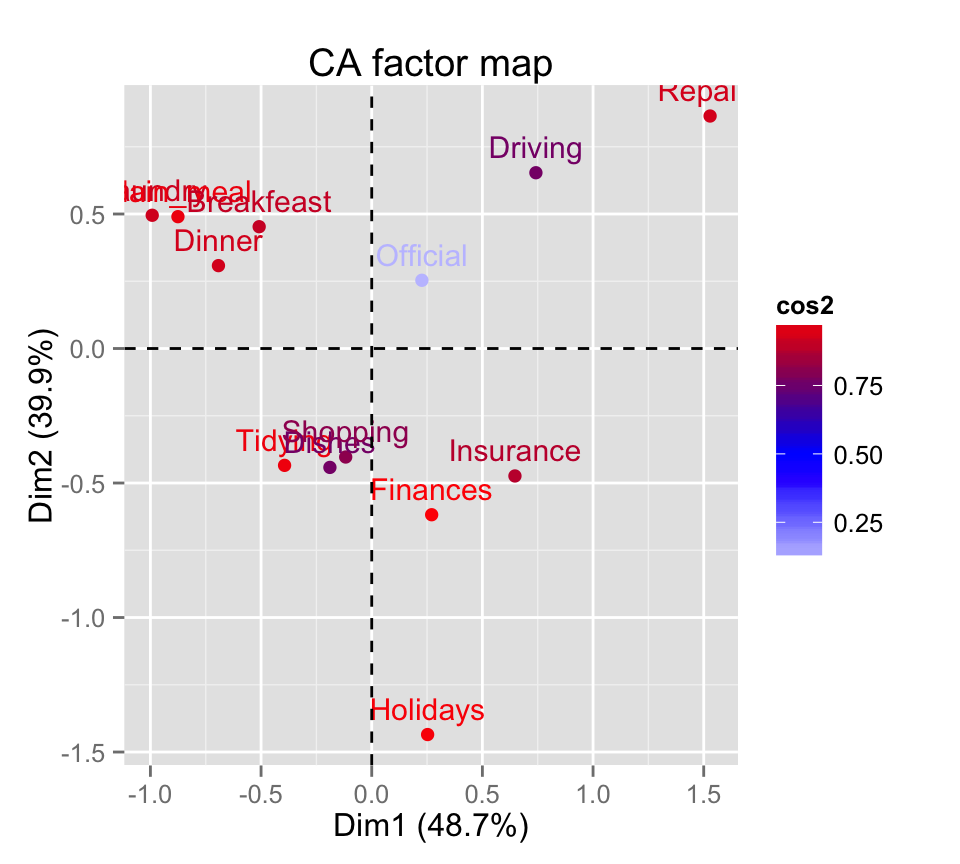
# Gradient color
fviz_ca_row(res.ca, col.row="cos2") +
      scale_color_gradient2(low="white", mid="blue",
      high="red", midpoint=0.5)

Quick Correspondence Analysis data visualization using factoextra - R software and data mining

# Change the theme and use only points
fviz_ca_row(res.ca, col.row="cos2", geom = "point") +
      scale_color_gradient2(low="white", mid="blue",
      high="red", midpoint=0.4)+ theme_minimal()

Quick Correspondence Analysis data visualization using factoextra - R software and data mining

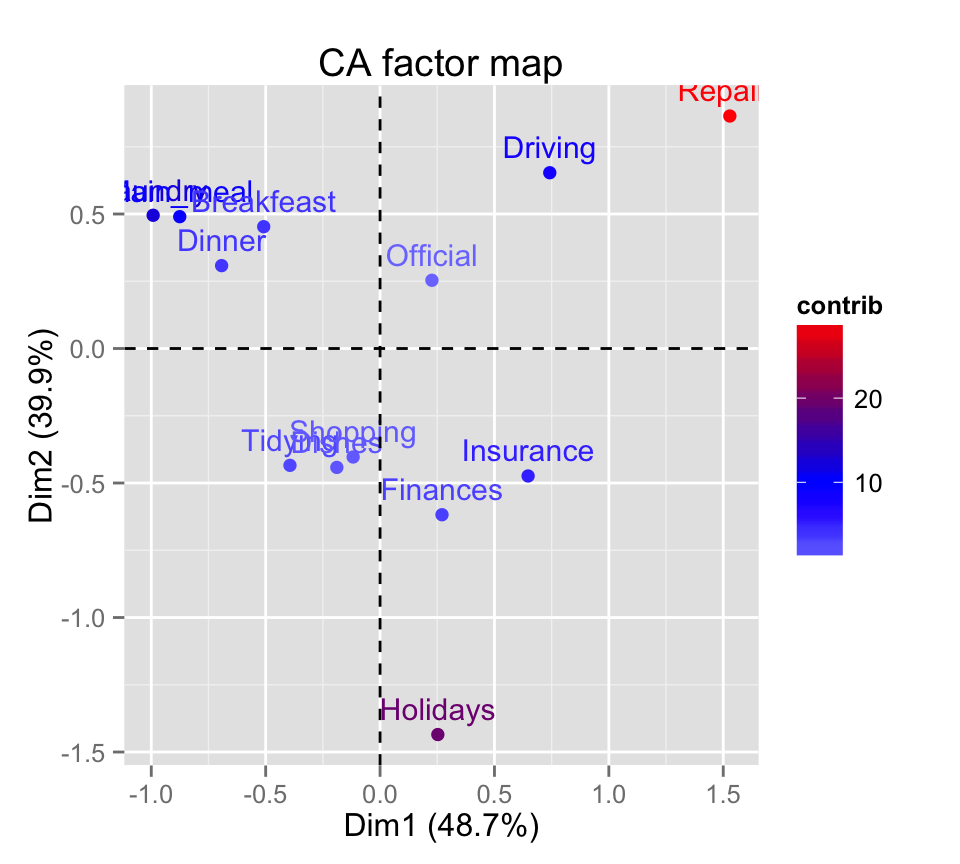
# Color by the contributions
fviz_ca_row(res.ca, col.row="contrib") +
      scale_color_gradient2(low="white", mid="blue",
      high="red", midpoint=10)

Quick Correspondence Analysis data visualization using factoextra - R software and data mining

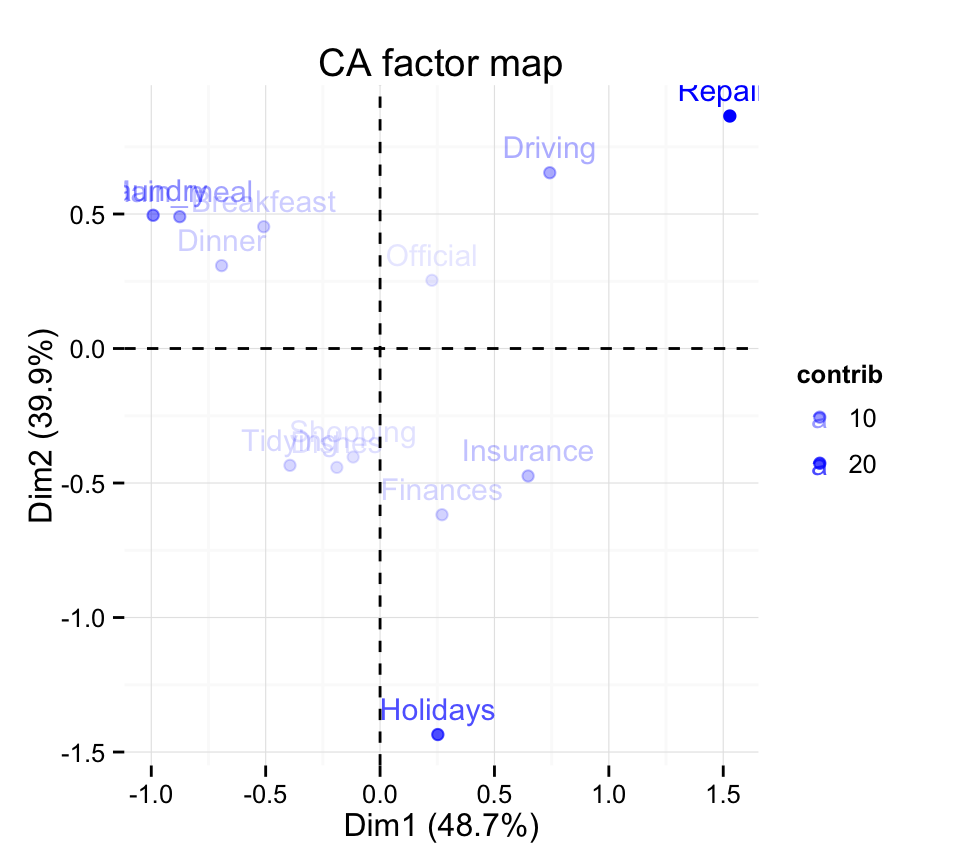
# Control the transparency of the color by the
# contributions
fviz_ca_row(res.ca, alpha.row="contrib") +
     theme_minimal()

Quick Correspondence Analysis data visualization using factoextra - R software and data mining

# Select and visualize rows with cos2 > 0.5
fviz_ca_row(res.ca, select.row = list(cos2 = 0.5))

Quick Correspondence Analysis data visualization using factoextra - R software and data mining

# Select the top 7 according to the cos2
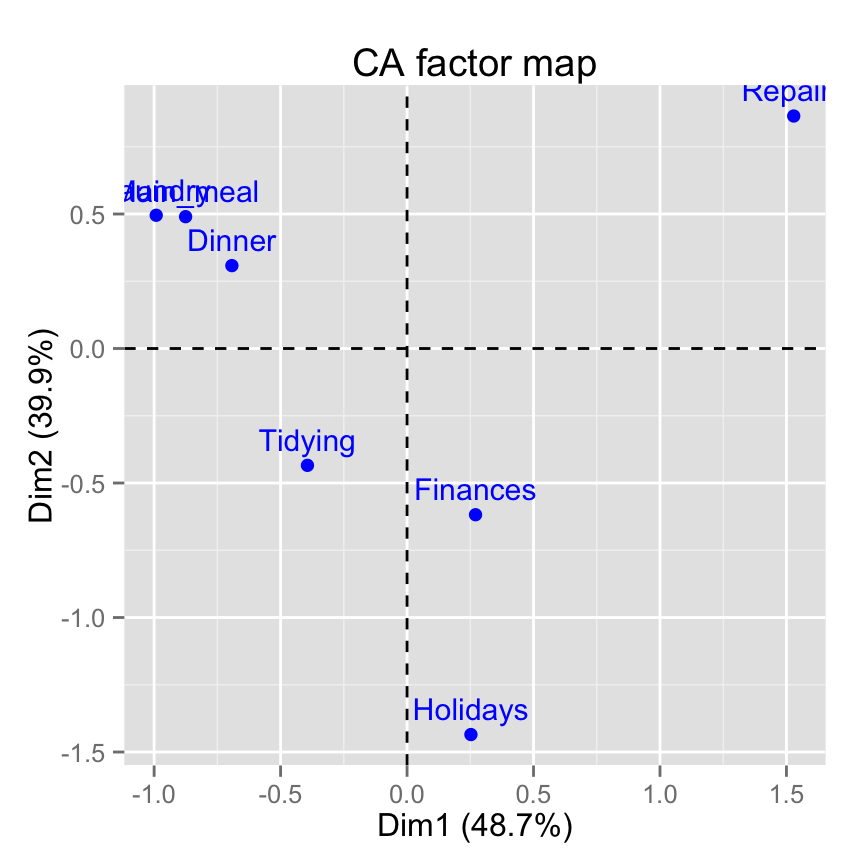
fviz_ca_row(res.ca, select.row = list(cos2 = 7))

Quick Correspondence Analysis data visualization using factoextra - R software and data mining

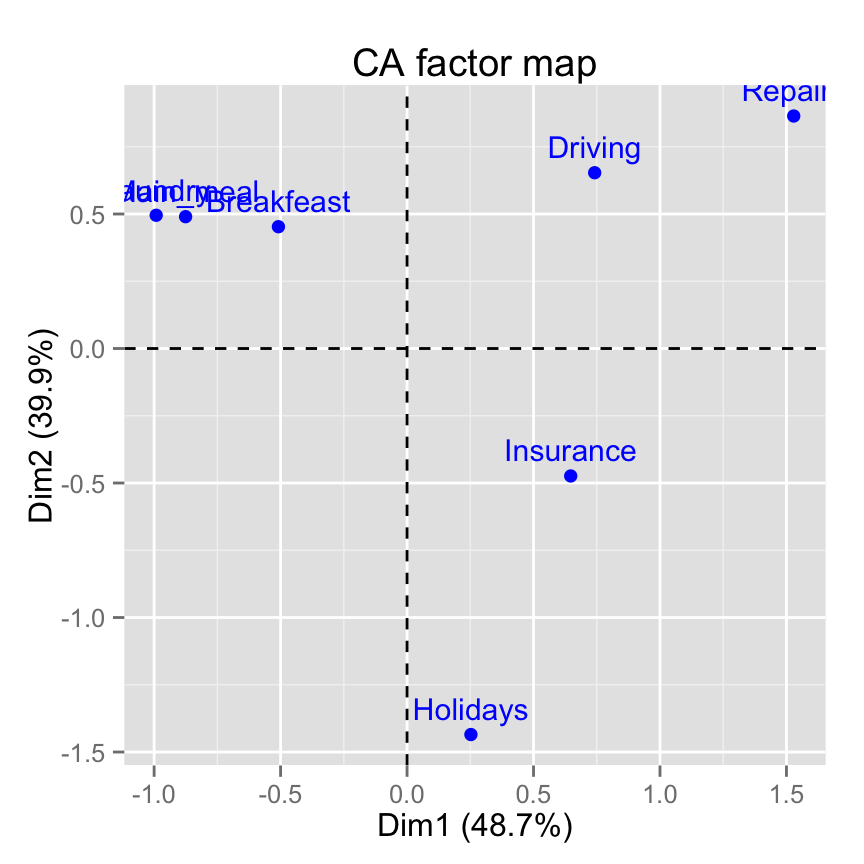
# Select the top 7 contributing rows
fviz_ca_row(res.ca, select.row = list(contrib = 7))

Quick Correspondence Analysis data visualization using factoextra - R software and data mining

# Select by names
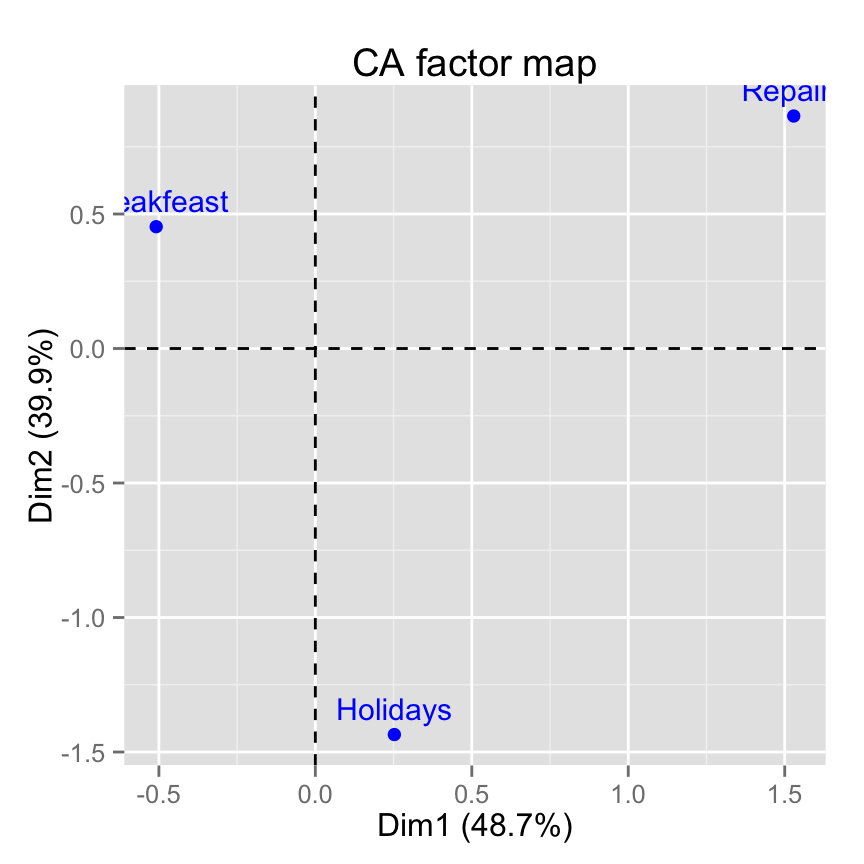
fviz_ca_row(res.ca,
select.row = list(name = c("Breakfeast", "Repairs", "Holidays")))

Quick Correspondence Analysis data visualization using factoextra - R software and data mining

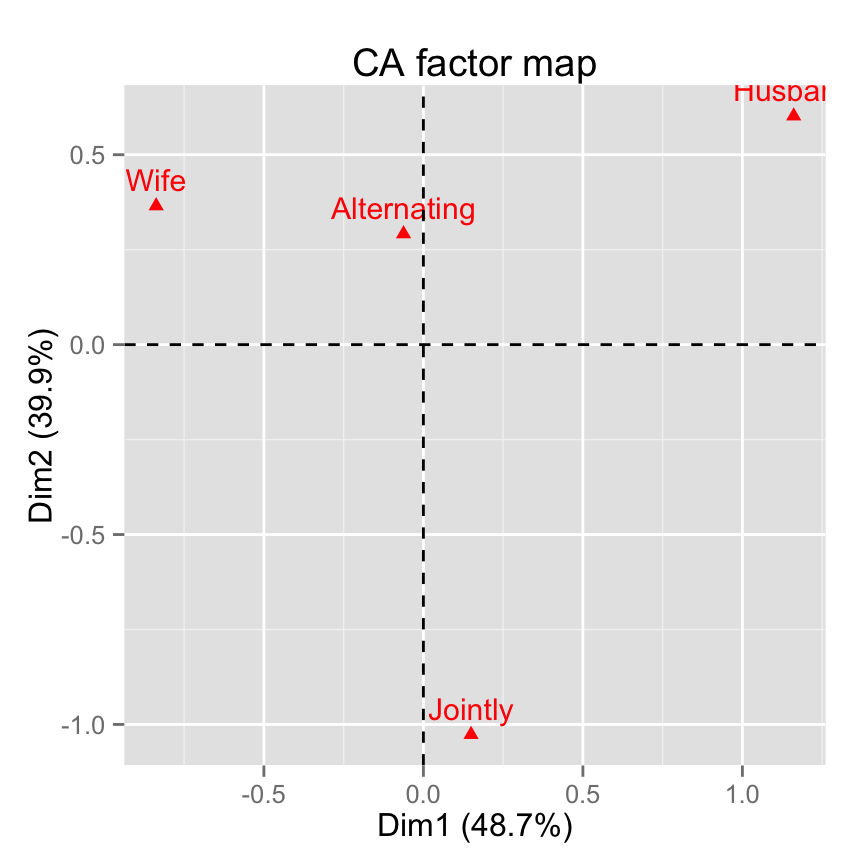
fviz_ca_col(): Graph of column categories

# Default plot
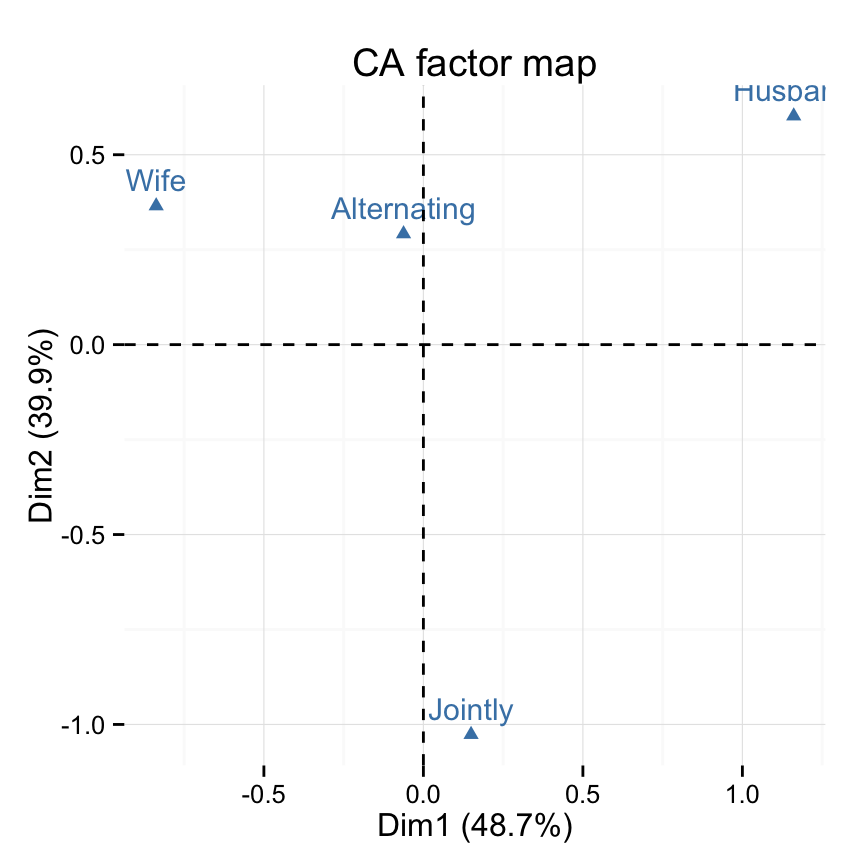
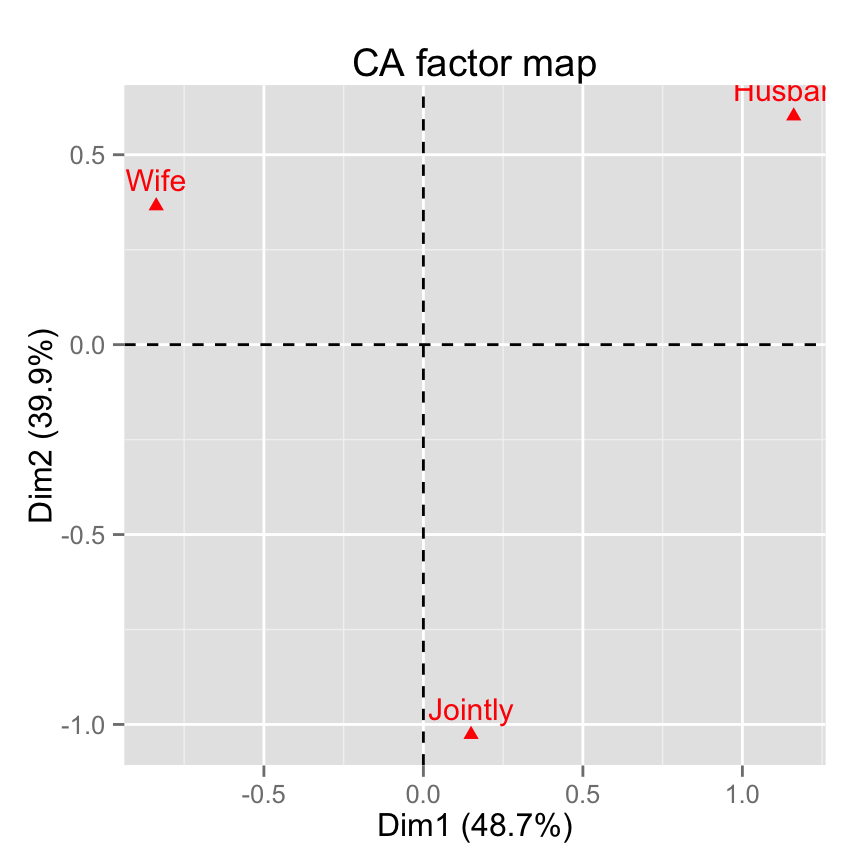
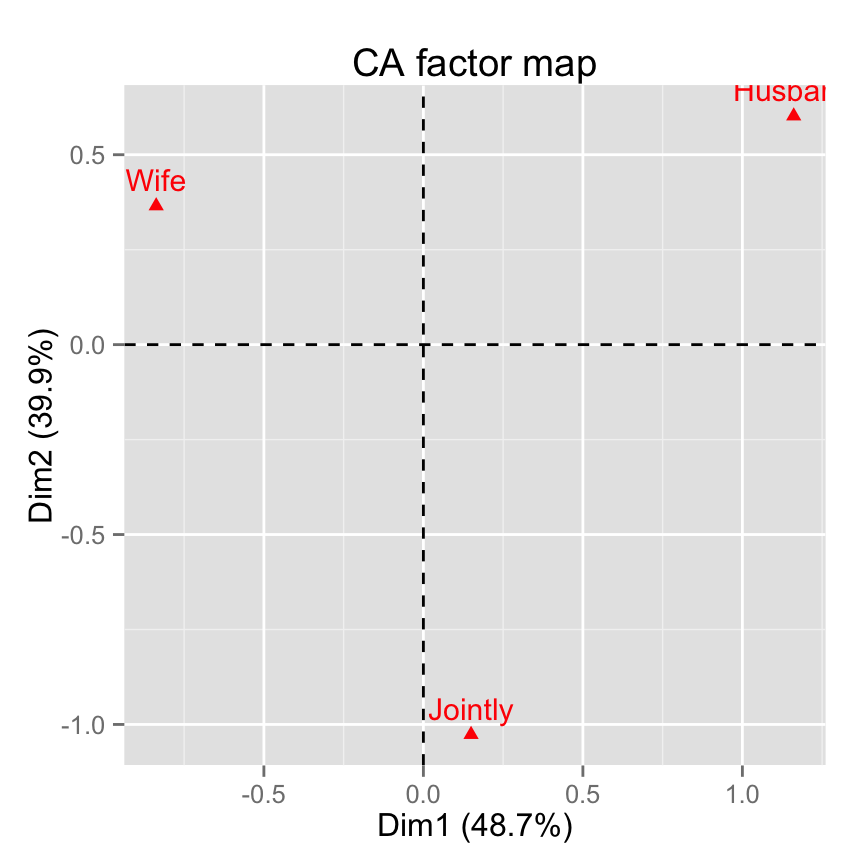
fviz_ca_col(res.ca)

Quick Correspondence Analysis data visualization using factoextra - R software and data mining

# Change color and theme
fviz_ca_col(res.ca, col.col="steelblue")+
 theme_minimal()

Quick Correspondence Analysis data visualization using factoextra - R software and data mining

# Control colors using their contributions
fviz_ca_col(res.ca, col.col = "contrib")+
 scale_color_gradient2(low = "white", mid = "blue",
           high = "red", midpoint = 25) +
 theme_minimal()

Quick Correspondence Analysis data visualization using factoextra - R software and data mining

# Control the transparency of variables using their contributions
fviz_ca_col(res.ca, alpha.col = "contrib") +
   theme_minimal()

Quick Correspondence Analysis data visualization using factoextra - R software and data mining

# Select and visualize columns with cos2 >= 0.4
fviz_ca_col(res.ca, select.col = list(cos2 = 0.4))

Quick Correspondence Analysis data visualization using factoextra - R software and data mining

# Select the top 3 contributing columns
fviz_ca_col(res.ca, select.col = list(contrib = 3))

Quick Correspondence Analysis data visualization using factoextra - R software and data mining

# Select by names
fviz_ca_col(res.ca,
 select.col= list(name = c("Wife", "Husband", "Jointly")))

Quick Correspondence Analysis data visualization using factoextra - R software and data mining

fviz_ca_biplot(): Biplot of rows and columns

# Symetric Biplot of rows and columns
fviz_ca_biplot(res.ca)

Quick Correspondence Analysis data visualization using factoextra - R software and data mining

# Asymetric biplot, use arrows for columns
fviz_ca_biplot(res.ca, map ="rowprincipal",
 arrow = c(FALSE, TRUE))

Quick Correspondence Analysis data visualization using factoextra - R software and data mining

# Keep only the labels for row points
fviz_ca_biplot(res.ca, label ="row")

Quick Correspondence Analysis data visualization using factoextra - R software and data mining

# Keep only labels for column points
fviz_ca_biplot(res.ca, label ="col")

Quick Correspondence Analysis data visualization using factoextra - R software and data mining

# Hide row points
fviz_ca_biplot(res.ca, invisible ="row")

Quick Correspondence Analysis data visualization using factoextra - R software and data mining

# Hide column points
fviz_ca_biplot(res.ca, invisible ="col")

Quick Correspondence Analysis data visualization using factoextra - R software and data mining

# Control automatically the color of rows using the cos2
fviz_ca_biplot(res.ca, col.row="cos2") +
       theme_minimal()

Quick Correspondence Analysis data visualization using factoextra - R software and data mining

# Select the top 7 contributing rows
# And the top 3 columns
fviz_ca_biplot(res.ca,
               select.row = list(contrib = 7),
               select.col = list(contrib = 3))

Quick Correspondence Analysis data visualization using factoextra - R software and data mining

Infos

This analysis has been performed using R software (ver. 3.2.1) and factoextra (ver. 1.0.3)

DBSCAN: density-based clustering for discovering clusters in large datasets with noise - Unsupervised Machine Learning

$
0
0


1 Concepts of density-based clustering

Partitioning methods (K-means, PAMclustering) and hierarchical clustering are suitable for finding spherical-shaped clusters or convex clusters. In other words, they work well for compact and well separated clusters. Moreover, they are also severely affected by the presence of noise and outliers in the data.

Unfortunately, real life data can contain: i) clusters of arbitrary shape such as those shown in the figure below (oval, linear and “S” shape clusters); ii) many outliers and noise.

The figure below shows a dataset containing nonconvex clusters and outliers/noises. The simulated dataset multishapes [in factoextra package] is used.

DBSCAN: density-based clustering

The plot above contains 5 clusters and outliers, including:

  • 2 ovales clusters
  • 2 linear clusters
  • 1 compact cluster

Given such data, k-means algorithm has difficulties for identifying theses clusters with arbitrary shape. To illustrate this situation, the following R code computes K-means algorithm on the dataset multishapes [in factoextra package]. The function fviz_cluster() [in factoextra] is used to visualize the clusters.

The latest version of factoextra can be installed using the following R code:

if(!require(devtools)) install.packages("devtools")
devtools::install_github("kassambara/factoextra")

Compute and visualize k-means clustering using the dataset multishapes:

library(factoextra)

data("multishapes")
df <- multishapes[, 1:2]
set.seed(123)
km.res <- kmeans(df, 5, nstart = 25)
fviz_cluster(km.res, df, frame = FALSE, geom = "point")

DBSCAN: density-based clustering

We know there are 5 five clusters in the data, but it can be seen that k-means method inaccurately identify the 5 clusters.

This chapter describes DBSCAN, a density-based clustering algorithm, introduced in Ester et al. 1996, which can be used to identify clusters of any shape in data set containing noise and outliers. DBSCAN stands for Density-Based Spatial Clustering and Application with Noise.

The advantages of DBSCAN are:


  1. Unlike K-means, DBSCAN does not require the user to specify the number of clusters to be generated
  2. DBSCAN can find any shape of clusters. The cluster doesn’t have to be circular.
  3. DBSCAN can identify outliers


The basic idea behind density-based clustering approach is derived from a human intuitive clustering method. For instance, by looking at the figure below, one can easily identify four clusters along with several points of noise, because of the differences in the density of points.

Density based clustering basic idea
(From Ester et al. 1996)


As illustrated in the figure above, clusters are dense regions in the data space, separated by regions of lower density of points. In other words, the density of points in a cluster is considerably higher than the density of points outside the cluster (“areas of noise”).

DBSCAN is based on this intuitive notion of “clusters” and “noise”. The key idea is that for each point of a cluster, the neighborhood of a given radius has to contain at least a minimum number of points.


2 Algorithm of DBSCAN

The goal is to identify dense regions, which can be measured by the number of objects close to a given point.

Two important parameters are required for DBSCAN: epsilon (“eps”) and minimum points (“MinPts”). The parameter eps defines the radius of neighborhood around a point x. It’s called called the \(\epsilon\)-neighborhood of x. The parameter MinPts is the minimum number of neighbors within “eps” radius.

Any point x in the dataset, with a neighbor count greater than or equal to MinPts, is marked as a core point. We say that x is border point, if the number of its neighbors is less than MinPts, but it belongs to the \(\epsilon\)-neighborhood of some core point z. Finally, if a point is neither a core nor a border point, then it is called a noise point or an outlier.

The figure below shows the different types of points (core, border and outlier points) using MinPts = 6. Here x is a core point because \(neighbours_\epsilon(x) = 6\), y is a border point because \(neighbours_\epsilon(y) < MinPts\), but it belongs to the \(\epsilon\)-neighborhood of the core point x. Finally, z is a noise point.

Density based clustering basic idea - minimal point and epsilon

We define 3 terms, required for understanding the DBSCAN algorithm:

  • Direct density reachable: A point “A” is directly density reachable from another point “B” if: i) “A” is in the \(\epsilon\)-neighborhood of “B” and ii) “B” is a core point.
  • Density reachable: A point “A” is density reachable from “B” if there are a set of core points leading from “B” to “A.
  • Density connected: Two points “A” and “B” are density connected if there are a core point “C”, such that both “A” and “B” are density reachable from “C”.

A density-based cluster is defined as a group of density connected points. The algorithm of density-based clustering (DBSCAN) works as follow:

The algorithm of density-based clustering works as follow:


  1. For each point \(x_i\), compute the distance between \(x_i\) and the other points. Finds all neighbor points within distance eps of the starting point (\(x_i\)). Each point, with a neighbor count greater than or equal to MinPts, is marked as core point or visited.
  2. For each core point, if it’s not already assigned to a cluster, create a new cluster. Find recursively all its density connected points and assign them to the same cluster as the core point.
  3. Iterate through the remaining unvisited points in the dataset.
Those points that do not belong to any cluster are treated as outliers or noise.


3 R packages for computing DBSCAN

Three R packages are used in this article:

  1. fpc and dbscan for computing density-based clustering
  2. factoextra for visualizing clusters

The R packages fpc and dbscan can be installed as follow:

install.packages("fpc")
install.packages("dbscan")

4 R functions for DBSCAN

The function dbscan() [in fpc package] or dbscan() [in dbscan package] can be used.

As the name of DBSCAN functions is the same in the two packages, we’ll explicitly use them as follow: fpc::dbscan() and dbscan::dbscan().

In the following examples, we’ll use fpc package. A simplified format of the function is:

dbscan(data, eps, MinPts = 5, scale = FALSE, 
       method = c("hybrid", "raw", "dist"))

  • data: data matrix, data frame or dissimilarity matrix (dist-object). Specify method = “dist” if the data should be interpreted as dissimilarity matrix or object. Otherwise Euclidean distances will be used.
  • eps: Reachability maximum distance
  • MinPts: Reachability minimum number of points
  • scale: If TRUE, the data will be scaled
  • method: Possible values are:
    • dist: Treats the data as distance matrix
    • raw: Treats the data as raw data
    • hybrid: Expect also raw data, but calculates partial distance matrices


  • Recall that, DBSCAN clusters require a minimum number of points (MinPts) within a maximum distance (eps) around one of its members (the seed).

  • Any point within eps around any point which satisfies the seed condition is a cluster member (recursively).

  • Some points may not belong to any clusters (noise).


In the following examples, we’ll use the simulated multishapes data [in factoextra package]:

# Load the data 
# Make sure that the package factoextra is installed
data("multishapes", package = "factoextra")
df <- multishapes[, 1:2]

The function dbscan() can be used as follow:

library("fpc")
# Compute DBSCAN using fpc package
set.seed(123)
db <- fpc::dbscan(df, eps = 0.15, MinPts = 5)
# Plot DBSCAN results
plot(db, df, main = "DBSCAN", frame = FALSE)

DBSCAN: density-based clustering

Note that, the function plot.dbscan() uses different point symbols for core points (i.e, seed points) and border points. Black points correspond to outliers. You can play with eps and MinPts for changing cluster configurations.

It can be seen that DBSCAN performs better for these data sets and can identify the correct set of clusters compared to k-means algorithms.

It’s also possible to draw the plot above using the function fviz_cluster() [ in factoextra package]:

library("factoextra")
fviz_cluster(db, df, stand = FALSE, frame = FALSE, geom = "point")

DBSCAN: density-based clustering

The result of fpc::dbscan() function can be displayed as follow:

# Print DBSCAN
print(db)
## dbscan Pts=1100 MinPts=5 eps=0.15
##         0   1   2   3  4  5
## border 31  24   1   5  7  1
## seed    0 386 404  99 92 50
## total  31 410 405 104 99 51

In the table above, column names are cluster number. Cluster 0 corresponds to outliers (black points in the DBSCAN plot).

# Cluster membership. Noise/outlier observations are coded as 0
# A random subset is shown
db$cluster[sample(1:1089, 50)]
##  [1] 1 3 2 4 3 1 2 4 2 2 2 2 2 2 1 4 1 1 1 0 4 2 2 5 2 2 2 2 1 1 0 4 2 3 1
## [36] 2 2 1 1 1 1 2 2 1 1 1 3 2 1 3

The function print.dbscan() shows a statistic of the number of points belonging to the clusters that are seeds and border points.

DBSCAN algorithm requires users to specify the optimal eps values and the parameter MinPts. In the R code above, we used eps = 0.15 and MinPts = 5. One limitation of DBSCAN is that it is sensitive to the choice of \(\epsilon\), in particular if clusters have different densities. If \(\epsilon\) is too small, sparser clusters will be defined as noise. If \(\epsilon\) is too large, denser clusters may be merged together. This implies that, if there are clusters with different local densities, then a single \(\epsilon\) value may not suffice.

A natural question is:

How to define the optimal value of eps?

5 Method for determining the optimal eps value

The method proposed here consists of computing the he k-nearest neighbor distances in a matrix of points.

The idea is to calculate, the average of the distances of every point to its k nearest neighbors. The value of k will be specified by the user and corresponds to MinPts.

Next, these k-distances are plotted in an ascending order. The aim is to determine the “knee”, which corresponds to the optimal eps parameter.

A knee corresponds to a threshold where a sharp change occurs along the k-distance curve.

The function kNNdistplot() [in dbscan package] can be used to draw the k-distance plot:

dbscan::kNNdistplot(df, k =  5)
abline(h = 0.15, lty = 2)

DBSCAN: density-based clustering

It can be seen that the optimal eps value is around a distance of 0.15.

6 Cluster predictions with DBSCAN algorithm

The function predict.dbscan(object, data, newdata) [in fpc package] can be used to predict the clusters for the points in newdata. For more details, read the documentation (?predict.dbscan).

7 Application of DBSCAN on a real data

The iris dataset is used:

# Load the data
data("iris")
iris <- as.matrix(iris[, 1:4])

The optimal value of “eps” parameter can be determined as follow:

dbscan::kNNdistplot(iris, k =  4)
abline(h = 0.4, lty = 2)

Compute DBSCAN using fpc::dbscan() and dbscan::dbscan(). Make sure that the 2 packages are installed:

set.seed(123)
# fpc package
res.fpc <- fpc::dbscan(iris, eps = 0.4, MinPts = 4)
# dbscan package
res.db <- dbscan::dbscan(iris, 0.4, 4)
  • The result of the function fpc::dbscan() provides an object of class ‘dbscan’ containing the following components:
    • cluster: integer vector coding cluster membership with noise observations (singletons) coded as 0
    • isseed: logical vector indicating whether a point is a seed (not border, not noise)
    • eps: parameter eps
    • MinPts: parameter MinPts
  • The result of the function dbscan::dbscan() is an integer vector with cluster assignments. Zero indicates noise points.

Note that the function dbscan:dbscan() is a fast re-implementation of DBSCAN algorithm. The implementation is significantly faster and can work with larger data sets than the function fpc:dbscan().

Make sure that both version produce the same results:

all(res.fpc$cluster == res.db)
## [1] TRUE

The result can be visualized as follow:

fviz_cluster(res.fpc, iris, geom = "point")

DBSCAN: density-based clustering

Black points are outliers.

8 Infos

This analysis has been performed using R software (ver. 3.2.1)

  • Martin Ester, Hans-Peter Kriegel, Joerg Sander, Xiaowei Xu (1996). A Density-Based Algorithm for Discovering Clusters in Large Spatial Databases with Noise. Institute for Computer Science, University of Munich. Proceedings of 2nd International Conference on Knowledge Discovery and Data Mining (KDD-96)

fviz_mca: Quick Multiple Correspondence Analysis data visualization - R software and data mining

$
0
0


Description

Draw the graph of individuals/variables from the output of Multiple Correspondence Analysis (MCA).

The following functions, from factoextra package are use:

  • fviz_mca_ind(): Graph of individuals
  • fviz_mca_var(): Graph of variable categories
  • fviz_mca_biplot() (or fviz_mca()): Biplot of individuals and variable categories

Install and load factoextra

The package devtools is required for the installation as factoextra is hosted on github.

# install.packages("devtools")
library("devtools")
install_github("kassambara/factoextra")

Load factoextra :

library("factoextra")

Usage

# Graph of individuals
fviz_mca_ind(X, axes = c(1, 2), 
  geom = c("point", "text"), label = "all", invisible = "none",
  labelsize = 4, pointsize = 2, habillage = "none",
  addEllipses = FALSE, ellipse.level = 0.95, col.ind = "blue",
  col.ind.sup = "darkblue", alpha.ind = 1, shape.ind = 19,
  select.ind = list(name = NULL, cos2 = NULL, contrib = NULL),
  map = "symmetric", 
  jitter = list(what = "label", width = NULL, height = NULL), ...)

# Graph of variables
fviz_mca_var(X, axes = c(1, 2),
  geom = c("point", "text"), label = "all",
  invisible = "none", labelsize = 4, pointsize = 2, col.var = "red",
  alpha.var = 1, shape.var = 17, col.quanti.sup = "blue",
  col.quali.sup = "darkgreen", col.circle = "grey70",
  select.var = list(name = NULL, cos2 = NULL, contrib = NULL),
  map = "symmetric", 
  jitter = list(what = "label", width = NULL, height = NULL))

# Biplot of individuals and variables
fviz_mca_biplot(X, axes = c(1, 2), geom = c("point", "text"),
  label = "all", invisible = "none", labelsize = 4, pointsize = 2,
  habillage = "none", addEllipses = FALSE, ellipse.level = 0.95,
  col.ind = "blue", col.ind.sup = "darkblue", alpha.ind = 1,
  col.var = "red", alpha.var = 1, col.quanti.sup = "blue",
  col.quali.sup = "darkgreen", shape.ind = 19, shape.var = 17,
  select.var = list(name = NULL, cos2 = NULL, contrib = NULL),
  select.ind = list(name = NULL, cos2 = NULL, contrib = NULL),
  map = "symmetric", arrows = c(FALSE, FALSE), 
  jitter = list(what = "label", width = NULL, height = NULL), ...)

# An alias of fviz_mca_biplot()
fviz_mca(X, ...)

Arguments

<td>character string specifying the map type. Allowed options include: "symmetric", "rowprincipal", "colprincipal", "symbiplot", "rowgab", "colgab", "rowgreen" and "colgreen". See details</td></tr>
Argument Description
X an object of class MCA [FactoMineR]; mca [ade4].
axes a numeric vector of length 2 specifying the dimensions to be plotted.
geom a text specifying the geometry to be used for the graph. Allowed values are the combination of c(“point”, “arrow”, “text”). Use “point” (to show only points); “text” to show only labels; c(“point”, “text”) or c(“arrow”, “text”) to show both types.
label a text specifying the elements to be labelled. Default value is “all”. Allowed values are “none” or the combination of c(“ind”, “ind.sup”,“var”, “quali.sup”, “quanti.sup”). “ind” can be used to label only active individuals. “ind.sup” is for supplementary individuals. “var” is for active variable categories. “quali.sup” is for supplementary qualitative variable categories. “quanti.sup” is for quantitative supplementary variables.
invisible a text specifying the elements to be hidden on the plot. Default value is “none”. Allowed values are the combination of c(“ind”, “ind.sup”,“var”, “quali.sup”, “quanti.sup”).
labelsize font size for the labels.
pointsize the size of points.
habillage an optional factor variable for coloring the observations by groups. Default value is “none”. If X is a MCA object from FactoMineR package, habillage can also specify the supplementary qualitative variable (by its index or name) to be used for coloring individuals by groups (see ?MCA in FactoMineR).
addEllipses logical value. If TRUE, draws ellipses around the individuals when habillage != “none”.
ellipse.level the size of the concentration ellipse in normal probability.
col.ind,col.var colors for individuals and variables, respectively. Possible values include also : “cos2”, “contrib”, “coord”, “x” or “y”. In this case, the colors for individuals/variables are automatically controlled by their qualities of representation (“cos2”), contributions (“contrib”), coordinates (x^2 + y^2 , “coord”), x values (“x”) or y values (“y”). To use automatic coloring (by cos2, contrib, ….), make sure that habillage =“none”.
col.ind.sup color for supplementary individuals.
alpha.ind,alpha.var controls the transparency of individual and variable colors, respectively. The value can variate from 0 (total transparency) to 1 (no transparency). Default value is 1. Possible values include also : “cos2”, “contrib”, “coord”, “x” or “y”. In this case, the transparency for the individual/variable colors are automatically controlled by their qualities (“cos2”), contributions (“contrib”), coordinates (x2+y2 , “coord”), x values(“x”) or y values(“y”). To use this, make sure that habillage =“none”.
select.ind,select.var

a selection of individuals/variables to be drawn. Allowed values are NULL or a list containing the arguments name, cos2 or contrib:

  • name: is a character vector containing individuals/variables to be drawn
  • cos2: if cos2 is in [0, 1], ex: 0.6, then individuals/variables with a cos2 > 0.6 are drawn. if cos2 > 1, ex: 5, then the top 5 individuals/variables with the highest cos2 are drawn.
  • contrib: if contrib > 1, ex: 5, then the top 5 individuals/variables with the highest cos2 are drawn
map
jitter a parameter used to jitter the points in order to reduce overplotting. It’s a list containing the objects what, width and height (Ex.; jitter = list(what, width, height)). what: the element to be jittered. Possible values are “point” or “p”; “label” or “l”; “both” or “b”. width: degree of jitter in x direction (ex: 0.2). height: degree of jitter in y direction (ex: 0.2).
col.quanti.sup, col.quali.sup a color for the quantitative/qualitative supplementary variables.
arrows Vector of two logicals specifying if the plot should contain points (FALSE, default) or arrows (TRUE). First value sets the rows and the second value sets the columns.
… Arguments to be passed to the function fviz_mca_biplot().

Details

The default plot of MCA is a “symmetric” plot in which both rows and columns are in principal coordinates. In this situation, it’s not possible to interpret the distance between row points and column points. To overcome this problem, the simplest way is to make an asymmetric plot. This means that, the column profiles must be presented in row space or vice-versa. The allowed options for the argument map are:

  • “rowprincipal” or “colprincipal”: asymmetric plots with either rows in principal coordinates and columns in standard coordinates, or vice versa. These plots preserve row metric or column metric respectively.

  • “symbiplot”: Both rows and columns are scaled to have variances equal to the singular values (square roots of eigenvalues), which gives a symmetric biplot but does not preserve row or column metrics.

  • “rowgab” or “colgab”: Asymmetric maps, proposed by Gabriel & Odoroff (1990), with rows (respectively, columns) in principal coordinates and columns (respectively, rows) in standard coordinates multiplied by the mass of the corresponding point.

  • “rowgreen” or “colgreen”: The so-called contribution biplots showing visually the most contributing points (Greenacre 2006b). These are similar to “rowgab” and “colgab” except that the points in standard coordinates are multiplied by the square root of the corresponding masses, giving reconstructions of the standardized residuals.

Value

A ggplot2 plot

Examples

Multiple Correspondence Analysis

A Multiple Correspondence Analysis (MCA) is performed using the function MCA() [in FactoMineR] and poison data [in FactoMineR]:

# Install and load FactoMineR to compute MCA
# install.packages("FactoMineR")
library("FactoMineR")
data(poison)
poison.active <- poison[1:55, 5:15]
head(poison.active[, 1:6])
    Nausea Vomiting Abdominals   Fever   Diarrhae   Potato
1 Nausea_y  Vomit_n     Abdo_y Fever_y Diarrhea_y Potato_y
2 Nausea_n  Vomit_n     Abdo_n Fever_n Diarrhea_n Potato_y
3 Nausea_n  Vomit_y     Abdo_y Fever_y Diarrhea_y Potato_y
4 Nausea_n  Vomit_n     Abdo_n Fever_n Diarrhea_n Potato_y
5 Nausea_n  Vomit_y     Abdo_y Fever_y Diarrhea_y Potato_y
6 Nausea_n  Vomit_n     Abdo_y Fever_y Diarrhea_y Potato_y
res.mca <- MCA(poison.active, graph=FALSE)

fviz_mca_ind(): Graph of individuals

# Default plot
fviz_mca_ind(res.mca)

fviz_mca: Quick Multiple Correspondence Analysis data visualization - R software and data mining

# Change title and axis labels
fviz_mca_ind(res.mca) +
 labs(title = "MCA", x = "Dim.1", y ="Dim.2" )

fviz_mca: Quick Multiple Correspondence Analysis data visualization - R software and data mining

# Change axis limits by specifying the min and max
fviz_mca_ind(res.mca) +
   xlim(-0.8, 1.5) + ylim (-1.5, 1.5)

fviz_mca: Quick Multiple Correspondence Analysis data visualization - R software and data mining

# Use text only
fviz_mca_ind(res.mca, geom = "text")

fviz_mca: Quick Multiple Correspondence Analysis data visualization - R software and data mining

# Use points only
fviz_mca_ind(res.mca, geom="point")

fviz_mca: Quick Multiple Correspondence Analysis data visualization - R software and data mining

# Change the size of points
fviz_mca_ind(res.mca, geom="point", pointsize = 4)

fviz_mca: Quick Multiple Correspondence Analysis data visualization - R software and data mining

# Change point color and theme
fviz_mca_ind(res.mca, col.ind = "blue")+
   theme_minimal()

fviz_mca: Quick Multiple Correspondence Analysis data visualization - R software and data mining

# Reduce overplotting
fviz_mca_ind(res.mca, 
             jitter = list(width = 0.2, height = 0.2))

fviz_mca: Quick Multiple Correspondence Analysis data visualization - R software and data mining

# Control automatically the color of individuals
# using the cos2 or the contributions
# cos2 = the quality of the individuals on the factor map
fviz_mca_ind(res.mca, col.ind="cos2")

fviz_mca: Quick Multiple Correspondence Analysis data visualization - R software and data mining

# Gradient color
fviz_mca_ind(res.mca, col.ind="cos2") +
      scale_color_gradient2(low="white", mid="blue",
      high="red", midpoint=0.4)

fviz_mca: Quick Multiple Correspondence Analysis data visualization - R software and data mining

# Change the theme and use only points
fviz_mca_ind(res.mca, col.ind="cos2", geom = "point") +
      scale_color_gradient2(low="white", mid="blue",
      high="red", midpoint=0.4)+ theme_minimal()

fviz_mca: Quick Multiple Correspondence Analysis data visualization - R software and data mining

# Color by the contributions
fviz_mca_ind(res.mca, col.ind="contrib") +
      scale_color_gradient2(low="white", mid="blue",
      high="red", midpoint=1.5)

fviz_mca: Quick Multiple Correspondence Analysis data visualization - R software and data mining

# Control the transparency of the color by the
# contributions
fviz_mca_ind(res.mca, alpha.ind="contrib") +
     theme_minimal()

fviz_mca: Quick Multiple Correspondence Analysis data visualization - R software and data mining

# Color individuals by groups
grp <- as.factor(poison.active[, "Vomiting"])
fviz_mca_ind(res.mca, label="none", habillage=grp)

fviz_mca: Quick Multiple Correspondence Analysis data visualization - R software and data mining

# Add ellipses
p <- fviz_mca_ind(res.mca, label="none", habillage=grp,
             addEllipses=TRUE, ellipse.level=0.95)
print(p)

fviz_mca: Quick Multiple Correspondence Analysis data visualization - R software and data mining

# Change group colors using RColorBrewer color palettes
p + scale_color_brewer(palette="Dark2") +
   theme_minimal()

fviz_mca: Quick Multiple Correspondence Analysis data visualization - R software and data mining

p + scale_color_brewer(palette="Paired") +
     theme_minimal()

fviz_mca: Quick Multiple Correspondence Analysis data visualization - R software and data mining

p + scale_color_brewer(palette="Set1") +
     theme_minimal()

fviz_mca: Quick Multiple Correspondence Analysis data visualization - R software and data mining

# Change color manually
p + scale_color_manual(values=c("#999999", "#E69F00", "#56B4E9"))

fviz_mca: Quick Multiple Correspondence Analysis data visualization - R software and data mining

# Select and visualize individuals with cos2 >= 0.4
fviz_mca_ind(res.mca, select.ind = list(cos2 = 0.4))

fviz_mca: Quick Multiple Correspondence Analysis data visualization - R software and data mining

# Select the top 20 according to the cos2
fviz_mca_ind(res.mca, select.ind = list(cos2 = 20))

fviz_mca: Quick Multiple Correspondence Analysis data visualization - R software and data mining

# Select the top 20 contributing individuals
fviz_mca_ind(res.mca, select.ind = list(contrib = 20))

fviz_mca: Quick Multiple Correspondence Analysis data visualization - R software and data mining

# Select by names
fviz_mca_ind(res.mca,
select.ind = list(name = c("44", "38", "53",  "39")))

fviz_mca: Quick Multiple Correspondence Analysis data visualization - R software and data mining

fviz_mca_var(): Graph of variable categories

# Default plot
fviz_mca_var(res.mca)

fviz_mca: Quick Multiple Correspondence Analysis data visualization - R software and data mining

# Change color and theme
fviz_mca_var(res.mca, col.var="steelblue")+
 theme_minimal()

fviz_mca: Quick Multiple Correspondence Analysis data visualization - R software and data mining

# Control variable colors using their contributions
fviz_mca_var(res.mca, col.var = "contrib")+
 scale_color_gradient2(low = "white", mid = "blue",
           high = "red", midpoint = 2) +
 theme_minimal()

fviz_mca: Quick Multiple Correspondence Analysis data visualization - R software and data mining

# Control the transparency of variables using their contributions
fviz_mca_var(res.mca, alpha.var = "contrib") +
   theme_minimal()

fviz_mca: Quick Multiple Correspondence Analysis data visualization - R software and data mining

# Select and visualize categories with cos2 >= 0.4
fviz_mca_var(res.mca, select.var = list(cos2 = 0.4))

fviz_mca: Quick Multiple Correspondence Analysis data visualization - R software and data mining

# Select the top 10 contributing variable categories
fviz_mca_var(res.mca, select.var = list(contrib = 10))

fviz_mca: Quick Multiple Correspondence Analysis data visualization - R software and data mining

# Select by names
fviz_mca_var(res.mca,
 select.var= list(name = c("Courg_n", "Fever_y", "Fever_n")))

fviz_mca: Quick Multiple Correspondence Analysis data visualization - R software and data mining

fviz_mca_biplot(): Biplot of individuals of variable categories

fviz_mca_biplot(res.mca)

fviz_mca: Quick Multiple Correspondence Analysis data visualization - R software and data mining

# Keep only the labels for variable categories
fviz_mca_biplot(res.mca, label ="var")

fviz_mca: Quick Multiple Correspondence Analysis data visualization - R software and data mining

# Keep only labels for individuals
fviz_mca_biplot(res.mca, label ="ind")

fviz_mca: Quick Multiple Correspondence Analysis data visualization - R software and data mining

# Hide variable categories
fviz_mca_biplot(res.mca, invisible ="var")

fviz_mca: Quick Multiple Correspondence Analysis data visualization - R software and data mining

# Hide individuals
fviz_mca_biplot(res.mca, invisible ="ind")

fviz_mca: Quick Multiple Correspondence Analysis data visualization - R software and data mining

# Control automatically the color of individuals using the cos2
fviz_mca_biplot(res.mca, label ="var", col.ind="cos2") +
       theme_minimal()

fviz_mca: Quick Multiple Correspondence Analysis data visualization - R software and data mining

# Change the color by groups, add ellipses
fviz_mca_biplot(res.mca, label="var", col.var ="blue",
   habillage=grp, addEllipses=TRUE, ellipse.level=0.95) +
   theme_minimal()

fviz_mca: Quick Multiple Correspondence Analysis data visualization - R software and data mining

# Select the top 30 contributing individuals
# And the top 10 variables
fviz_mca_biplot(res.mca,
               select.ind = list(contrib = 30),
               select.var = list(contrib = 10))

fviz_mca: Quick Multiple Correspondence Analysis data visualization - R software and data mining

Infos

This analysis has been performed using R software (ver. 3.2.1) and factoextra (ver. 1.0.3)


fviz_pca: Quick Principal Component Analysis data visualization - R software and data mining

$
0
0


Description

Draw the graph of individuals/variables from the output of Principal Component Analysis (PCA).

The following functions, from factoextra package are use:

  • fviz_pca_ind(): Graph of individuals
  • fviz_pca_var(): Graph of variables
  • fviz_pca_biplot() (or fviz_pca()): Biplot of individuals and variables

Install and load factoextra

The package devtools is required for the installation as factoextra is hosted on github.

# install.packages("devtools")
library("devtools")
install_github("kassambara/factoextra")

Load factoextra :

library("factoextra")

Usage

# Graph of individuals
fviz_pca_ind(X, axes = c(1, 2), geom = c("point", "text"),
       label = "all", invisible = "none", labelsize = 4,
       pointsize = 2, habillage = "none",
       addEllipses = FALSE, ellipse.level = 0.95, 
       col.ind = "black", col.ind.sup = "blue", alpha.ind = 1,
       select.ind = list(name = NULL, cos2 = NULL, contrib = NULL),
       jitter = list(what = "label", width = NULL, height = NULL),  ...)

# Graph of variables
fviz_pca_var(X, axes = c(1, 2), geom = c("arrow", "text"),
       label = "all", invisible = "none", labelsize = 4,
       col.var = "black", alpha.var = 1, col.quanti.sup = "blue",
       col.circle = "grey70",
       select.var = list(name =NULL, cos2 = NULL, contrib = NULL),
       jitter = list(what = "label", width = NULL, height = NULL))

# Biplot of individuals and variables
fviz_pca_biplot(X, axes = c(1, 2), geom = c("point", "text"),
   label = "all", invisible = "none", labelsize = 4, pointsize = 2,
    habillage = "none", addEllipses = FALSE, ellipse.level = 0.95,
    col.ind = "black", col.ind.sup = "blue", alpha.ind = 1,
    col.var = "steelblue", alpha.var = 1, col.quanti.sup = "blue",
    col.circle = "grey70", 
    select.var = list(name = NULL, cos2 = NULL, contrib= NULL), 
    select.ind = list(name = NULL, cos2 = NULL, contrib = NULL),
    jitter = list(what = "label", width = NULL, height = NULL), ...)

# An alias of fviz_pca_biplot()
fviz_pca(X, ...)

Arguments

Argument Description
X an object of class PCA [FactoMineR]; prcomp and princomp [stats]; dudi and pca [ade4].
axes a numeric vector of length 2 specifying the dimensions to be plotted.
geom a text specifying the geometry to be used for the graph. Allowed values are the combination of c(“point”, “arrow”, “text”). Use “point” (to show only points); “text” to show only labels; c(“point”, “text”) or c(“arrow”, “text”) to show both types.
label a text specifying the elements to be labelled. Default value is “all”. Allowed values are “none” or the combination of c(“ind”, “ind.sup”, “quali”, “var”, “quanti.sup”). “ind” can be used to label only active individuals. “ind.sup” is for supplementary individuals. “quali” is for supplementary qualitative variables. “var” is for active variables. “quanti.sup” is for quantitative supplementary variables.
invisible a text specifying the elements to be hidden on the plot. Default value is “none”. Allowed values are the combination of c(“ind”, “ind.sup”, “quali”, “var”, “quanti.sup”).
labelsize font size for the labels.
pointsize the size of points.
habillage an optional factor variable for coloring the observations by groups. Default value is “none”. If X is a PCA object from FactoMineR package, habillage can also specify the supplementary qualitative variable (by its index or name) to be used for coloring individuals by groups (see ?PCA in FactoMineR).
addEllipses logical value. If TRUE, draws ellipses around the individuals when habillage != “none”.
ellipse.level the size of the concentration ellipse in normal probability.
col.ind,col.var colors for individuals and variables, respectively. Possible values include also : “cos2”, “contrib”, “coord”, “x” or “y”. In this case, the colors for individuals/variables are automatically controlled by their qualities of representation (“cos2”), contributions (“contrib”), coordinates (x^2 + y^2, “coord”), x values (“x”) or y values (“y”). To use automatic coloring (by cos2, contrib, ….), make sure that habillage =“none”.
col.ind.sup color for supplementary individuals.
alpha.ind,alpha.var controls the transparency of individual and variable colors, respectively. The value can variate from 0 (total transparency) to 1 (no transparency). Default value is 1. Possible values include also : “cos2”, “contrib”, “coord”, “x” or “y”. In this case, the transparency for the individual/variable colors are automatically controlled by their qualities (“cos2”), contributions (“contrib”), coordinates (x^2 + y^2 , “coord”), x values(“x”) or y values(“y”). To use this, make sure that habillage =“none”.
select.ind,select.var

a selection of individuals/variables to be drawn. Allowed values are NULL or a list containing the arguments name, cos2 or contrib:

  • name: is a character vector containing individuals/variables to be drawn
  • cos2: if cos2 is in [0, 1], ex: 0.6, then individuals/variables with a cos2 > 0.6 are drawn. if cos2 > 1, ex: 5, then the top 5 individuals/variables with the highest cos2 are drawn.
  • contrib: if contrib > 1, ex: 5, then the top 5 individuals/variables with the highest cos2 are drawn
jitter a parameter used to jitter the points in order to reduce overplotting. It’s a list containing the objects what, width and height (Ex.; jitter = list(what, width, height)). what: the element to be jittered. Possible values are “point” or “p”; “label” or “l”; “both” or “b”. width: degree of jitter in x direction (ex: 0.2). height: degree of jitter in y direction (ex: 0.2).
col.quanti.sup a color for the quantitative supplementary variables.
col.circle a color for the correlation circle.
… Arguments to be passed to the function fviz_pca_biplot().

Value

A ggplot2 plot

Examples

Principal component analysis

A principal component analysis (PCA) is performed using the built-in R function prcomp() and iris data:

data(iris)
head(iris)
  Sepal.Length Sepal.Width Petal.Length Petal.Width Species
1          5.1         3.5          1.4         0.2  setosa
2          4.9         3.0          1.4         0.2  setosa
3          4.7         3.2          1.3         0.2  setosa
4          4.6         3.1          1.5         0.2  setosa
5          5.0         3.6          1.4         0.2  setosa
6          5.4         3.9          1.7         0.4  setosa
# The variable Species (index = 5) is removed
# before the PCA analysis
res.pca <- prcomp(iris[, -5],  scale = TRUE)

fviz_pca_ind(): Graph of individuals

# Default plot
fviz_pca_ind(res.pca)

fviz_pca: Quick Principal Component Analysis data visualization - R software and data mining

# Change title and axis labels
fviz_pca_ind(res.pca) +
  labs(title ="PCA", x = "PC1", y = "PC2")

fviz_pca: Quick Principal Component Analysis data visualization - R software and data mining

# Change axis limits by specifying the min and max
fviz_pca_ind(res.pca) +
   xlim(-4, 4) + ylim (-4, 4)

fviz_pca: Quick Principal Component Analysis data visualization - R software and data mining

# Use text only
fviz_pca_ind(res.pca, geom="text")

fviz_pca: Quick Principal Component Analysis data visualization - R software and data mining

# Use points only
fviz_pca_ind(res.pca, geom="point")

fviz_pca: Quick Principal Component Analysis data visualization - R software and data mining

# Change the size of points
fviz_pca_ind(res.pca, geom="point", pointsize = 4)

fviz_pca: Quick Principal Component Analysis data visualization - R software and data mining

# Change point color and theme
fviz_pca_ind(res.pca, col.ind = "blue")+
   theme_minimal()

fviz_pca: Quick Principal Component Analysis data visualization - R software and data mining

# Control automatically the color of individuals
# using the cos2 or the contributions
# cos2 = the quality of the individuals on the factor map
fviz_pca_ind(res.pca, col.ind="cos2")

fviz_pca: Quick Principal Component Analysis data visualization - R software and data mining

# Gradient color
fviz_pca_ind(res.pca, col.ind="cos2") +
      scale_color_gradient2(low="white", mid="blue",
      high="red", midpoint=0.6)

fviz_pca: Quick Principal Component Analysis data visualization - R software and data mining

# Change the theme and use only points
fviz_pca_ind(res.pca, col.ind="cos2", geom = "point") +
      scale_color_gradient2(low="white", mid="blue",
      high="red", midpoint=0.6)+ theme_minimal()

fviz_pca: Quick Principal Component Analysis data visualization - R software and data mining

# Color by the contributions
fviz_pca_ind(res.pca, col.ind="contrib") +
      scale_color_gradient2(low="white", mid="blue",
      high="red", midpoint=4)

fviz_pca: Quick Principal Component Analysis data visualization - R software and data mining

# Control the transparency of the color by the
# contributions
fviz_pca_ind(res.pca, alpha.ind="contrib") +
     theme_minimal()

fviz_pca: Quick Principal Component Analysis data visualization - R software and data mining

# Color individuals by groups
fviz_pca_ind(res.pca, label="none", habillage=iris$Species)

fviz_pca: Quick Principal Component Analysis data visualization - R software and data mining

# Add ellipses
p <- fviz_pca_ind(res.pca, label="none", habillage=iris$Species,
             addEllipses=TRUE, ellipse.level=0.95)
print(p)

fviz_pca: Quick Principal Component Analysis data visualization - R software and data mining

# Change group colors using RColorBrewer color palettes
p + scale_color_brewer(palette="Dark2") +
     theme_minimal()

fviz_pca: Quick Principal Component Analysis data visualization - R software and data mining

p + scale_color_brewer(palette="Paired") +
     theme_minimal()

fviz_pca: Quick Principal Component Analysis data visualization - R software and data mining

p + scale_color_brewer(palette="Set1") +
     theme_minimal()

fviz_pca: Quick Principal Component Analysis data visualization - R software and data mining

# Change color manually
p + scale_color_manual(values=c("#999999", "#E69F00", "#56B4E9"))

fviz_pca: Quick Principal Component Analysis data visualization - R software and data mining

# Select and visualize individuals with cos2 > 0.96
fviz_pca_ind(res.pca, select.ind = list(cos2 = 0.96))

fviz_pca: Quick Principal Component Analysis data visualization - R software and data mining

# Select the top 20 according the cos2
fviz_pca_ind(res.pca, select.ind = list(cos2 = 20))

fviz_pca: Quick Principal Component Analysis data visualization - R software and data mining

# Select the top 20 contributing individuals
fviz_pca_ind(res.pca, select.ind = list(contrib = 20))

fviz_pca: Quick Principal Component Analysis data visualization - R software and data mining

# Select by names
fviz_pca_ind(res.pca,
select.ind = list(name = c("23", "42", "119")))

fviz_pca: Quick Principal Component Analysis data visualization - R software and data mining

fviz_pca_var(): Graph of variables

# Default plot
fviz_pca_var(res.pca)

fviz_pca: Quick Principal Component Analysis data visualization - R software and data mining

# Use points and text
fviz_pca_var(res.pca, geom = c("point", "text"))

fviz_pca: Quick Principal Component Analysis data visualization - R software and data mining

# Change color and theme
fviz_pca_var(res.pca, col.var="steelblue")+
 theme_minimal()

fviz_pca: Quick Principal Component Analysis data visualization - R software and data mining

# Control variable colors using their contributions
fviz_pca_var(res.pca, col.var="contrib")+
 scale_color_gradient2(low="white", mid="blue",
           high="red", midpoint=96) +
 theme_minimal()

fviz_pca: Quick Principal Component Analysis data visualization - R software and data mining

# Control the transparency of variables using their contributions
fviz_pca_var(res.pca, alpha.var="contrib") +
   theme_minimal()

fviz_pca: Quick Principal Component Analysis data visualization - R software and data mining

# Select and visualize variables with cos2 >= 0.96
fviz_pca_var(res.pca, select.var = list(cos2 = 0.96))

fviz_pca: Quick Principal Component Analysis data visualization - R software and data mining

# Select the top 3 contributing variables
fviz_pca_var(res.pca, select.var = list(contrib = 3))

fviz_pca: Quick Principal Component Analysis data visualization - R software and data mining

# Select by names
fviz_pca_var(res.pca,
   select.var= list(name = c("Sepal.Width", "Petal.Length")))

fviz_pca: Quick Principal Component Analysis data visualization - R software and data mining

fviz_pca_biplot(): Biplot of individuals of variables

fviz_pca_biplot(res.pca)

fviz_pca: Quick Principal Component Analysis data visualization - R software and data mining

# Keep only the labels for variables
fviz_pca_biplot(res.pca, label ="var")

fviz_pca: Quick Principal Component Analysis data visualization - R software and data mining

# Keep only labels for individuals
fviz_pca_biplot(res.pca, label ="ind")

fviz_pca: Quick Principal Component Analysis data visualization - R software and data mining

# Hide variables
fviz_pca_biplot(res.pca, invisible ="var")

fviz_pca: Quick Principal Component Analysis data visualization - R software and data mining

# Hide individuals
fviz_pca_biplot(res.pca, invisible ="ind")

fviz_pca: Quick Principal Component Analysis data visualization - R software and data mining

# Control automatically the color of individuals using the cos2
fviz_pca_biplot(res.pca, label ="var", col.ind="cos2") +
       theme_minimal()

fviz_pca: Quick Principal Component Analysis data visualization - R software and data mining

# Change the color by groups, add ellipses
fviz_pca_biplot(res.pca, label="var", habillage=iris$Species,
               addEllipses=TRUE, ellipse.level=0.95)

fviz_pca: Quick Principal Component Analysis data visualization - R software and data mining

# Select the top 30 contributing individuals
fviz_pca_biplot(res.pca, label="var",
               select.ind = list(contrib = 30))

fviz_pca: Quick Principal Component Analysis data visualization - R software and data mining

Infos

This analysis has been performed using R software (ver. 3.2.1) and factoextra (ver. 1.0.3)

qplot: Quick plot with ggplot2 - R software and data visualization

$
0
0


The function qplot() [in ggplot2] is very similar to the basic plot() function from the R base package. It can be used to create and combine easily different types of plots. However, it remains less flexible than the function ggplot().

This chapter provides a brief introduction to qplot(), which stands for quick plot. Concerning the function ggplot(), many articles are available at the end of this web page for creating and customizing different plots using ggplot().

Data format

The data must be a data.frame (columns are variables and rows are observations).

The data set mtcars is used in the examples below:

data(mtcars)
df <- mtcars[, c("mpg", "cyl", "wt")]
head(df)
##                    mpg cyl    wt
## Mazda RX4         21.0   6 2.620
## Mazda RX4 Wag     21.0   6 2.875
## Datsun 710        22.8   4 2.320
## Hornet 4 Drive    21.4   6 3.215
## Hornet Sportabout 18.7   8 3.440
## Valiant           18.1   6 3.460


mtcars : Motor Trend Car Road Tests.

Description: The data comprises fuel consumption and 10 aspects of automobile design and performance for 32 automobiles (1973 - 74 models).

Format: A data frame with 32 observations on 3 variables.

  • [, 1] mpg Miles/(US) gallon
  • [, 2] cyl Number of cylinders
  • [, 3] wt Weight (lb/1000)


Usage of qplot() function

A simplified format of qplot() is :

qplot(x, y=NULL, data, geom="auto", 
      xlim = c(NA, NA), ylim =c(NA, NA))

  • x : x values
  • y : y values (optional)
  • data : data frame to use (optional).
  • geom : Character vector specifying geom to use. Defaults to “point” if x and y are specified, and “histogram” if only x is specified.
  • xlim, ylim: x and y axis limits


Other arguments including main, xlab, ylab and log can be used also:

  • main: Plot title
  • xlab, ylab: x and y axis labels
  • log: which variables to log transform. Allowed values are “x”, “y” or “xy”

Scatter plots

Basic scatter plots

The plot can be created using data from either numeric vectors or a data frame:

# Use data from numeric vectors
x <- 1:10; y = x*x
# Basic plot
qplot(x,y)

# Add line
qplot(x, y, geom=c("point", "line"))

# Use data from a data frame
qplot(mpg, wt, data=mtcars)

qplot: Quick plot with ggplot2 - R software and data visualizationqplot: Quick plot with ggplot2 - R software and data visualizationqplot: Quick plot with ggplot2 - R software and data visualization

Scatter plots with linear fits

The option smooth is used to add a smoothed line with its standard error:

# Smoothing
qplot(mpg, wt, data = mtcars, geom = c("point", "smooth"))

# Regression line
qplot(mpg, wt, data = mtcars, geom = c("point", "smooth"),
      method="lm")

qplot: Quick plot with ggplot2 - R software and data visualizationqplot: Quick plot with ggplot2 - R software and data visualization

To draw a regression line the argument method = “lm” is used in combination with geom = “smoth”.

The allowed values for the argument method includes:

  • method = “loess”: This is the default value for small number of observations. It computes a smooth local regression. You can read more about loess using the R code ?loess.
  • method =“lm”: It fits a linear model. Note that, it’s also possible to indicate the formula as formula = y ~ poly(x, 3) to specify a degree 3 polynomial.

Linear fits by groups

The argument color is used to tell R that we want to color the points by groups:

# Linear fits by group
qplot(mpg, wt, data = mtcars, color = factor(cyl),
      geom=c("point", "smooth"),
      method="lm")

qplot: Quick plot with ggplot2 - R software and data visualization

Change scatter plot colors

Points can be colored according to the values of a continuous or a discrete variable. The argument colour is used.

# Change the color by a continuous numeric variable
qplot(mpg, wt, data = mtcars, colour = cyl)

# Change the color by groups (factor)
df <- mtcars
df[,'cyl'] <- as.factor(df[,'cyl'])
qplot(mpg, wt, data = df, colour = cyl)

# Add lines
qplot(mpg, wt, data = df, colour = cyl,
      geom=c("point", "line"))

qplot: Quick plot with ggplot2 - R software and data visualizationqplot: Quick plot with ggplot2 - R software and data visualizationqplot: Quick plot with ggplot2 - R software and data visualization


Note that you can also use the following R code to generate the second plot :

qplot(mpg, wt, data=df, colour= factor(cyl))


Change the shape and the size of points

Like color, the shape and the size of points can be controlled by a continuous or discrete variable.

# Change the size of points according to 
  # the values of a continuous variable
qplot(mpg, wt, data = mtcars, size = mpg)

# Change point shapes by groups
qplot(mpg, wt, data = mtcars, shape = factor(cyl))

qplot: Quick plot with ggplot2 - R software and data visualizationqplot: Quick plot with ggplot2 - R software and data visualization

Scatter plot with texts

The argument label is used to specify the texts to be used for each points:

qplot(mpg, wt, data = mtcars, label = rownames(mtcars), 
      geom=c("point", "text"),
      hjust=0, vjust=0)

qplot: Quick plot with ggplot2 - R software and data visualization

Bar plot

It’s possible to draw a bar plot using the argument geom = “bar”.

If you want y to represent counts of cases, use stat = “bin” and don’t map a variable to y. If you want y to represent values in the data, use stat = “identity”.

# y represents the count of cases
qplot(mpg, data = mtcars, geom = "bar")

# y represents values in the data
index <- 1:nrow(mtcars)
qplot(index, mpg, data = mtcars, 
      geom = "bar", stat = "identity")

qplot: Quick plot with ggplot2 - R software and data visualizationqplot: Quick plot with ggplot2 - R software and data visualization

Change bar plot fill color

# Order the data by cyl and then by mpg values
df <- mtcars[order(mtcars[, "cyl"], mtcars[, "mpg"]),]
df[,'cyl'] <- as.factor(df[,'cyl'])
index <- 1:nrow(df)

# Change fill color by group (cyl)
qplot(index, mpg, data = df, 
      geom = "bar", stat = "identity", fill = cyl)

qplot: Quick plot with ggplot2 - R software and data visualization

Box plot, dot plot and violin plot

PlantGrowth data set is used in the following example :

head(PlantGrowth)
##   weight group
## 1   4.17  ctrl
## 2   5.58  ctrl
## 3   5.18  ctrl
## 4   6.11  ctrl
## 5   4.50  ctrl
## 6   4.61  ctrl
  • geom = “boxplot”: draws a box plot
  • geom = “dotplot”: draws a dot plot. The supplementary arguments stackdir = “center” and binaxis = “y” are required.
  • geom = “violin”: draws a violin plot. The argument trim is set to FALSE
# Basic box plot from a numeric vector
x <- "1"
y <- rnorm(100)
qplot(x, y, geom="boxplot")

# Basic box plot from data frame
qplot(group, weight, data = PlantGrowth, 
      geom=c("boxplot"))

# Dot plot
qplot(group, weight, data = PlantGrowth, 
      geom=c("dotplot"), 
      stackdir = "center", binaxis = "y")

# Violin plot
qplot(group, weight, data = PlantGrowth, 
      geom=c("violin"), trim = FALSE)

qplot: Quick plot with ggplot2 - R software and data visualizationqplot: Quick plot with ggplot2 - R software and data visualizationqplot: Quick plot with ggplot2 - R software and data visualizationqplot: Quick plot with ggplot2 - R software and data visualization

Change the color by groups:

# Box plot from a data frame
# Add jitter and change fill color by group
qplot(group, weight, data = PlantGrowth, 
      geom=c("boxplot", "jitter"), fill = group)

# Dot plot
qplot(group, weight, data = PlantGrowth, 
      geom = "dotplot", stackdir = "center", binaxis = "y",
      color = group, fill = group)

qplot: Quick plot with ggplot2 - R software and data visualizationqplot: Quick plot with ggplot2 - R software and data visualization

Histogram and density plots

The histogram and density plots are used to display the distribution of data.

Generate some data

The R code below generates some data containing the weights by sex (M for male; F for female):

set.seed(1234)
mydata = data.frame(
        sex = factor(rep(c("F", "M"), each=200)),
        weight = c(rnorm(200, 55), rnorm(200, 58)))
head(mydata)
##   sex   weight
## 1   F 53.79293
## 2   F 55.27743
## 3   F 56.08444
## 4   F 52.65430
## 5   F 55.42912
## 6   F 55.50606

Histogram plot

# Basic histogram
qplot(weight, data = mydata, geom = "histogram")

# Change histogram fill color by group (sex)
qplot(weight, data = mydata, geom = "histogram",
    fill = sex, position = "dodge")

qplot: Quick plot with ggplot2 - R software and data visualizationqplot: Quick plot with ggplot2 - R software and data visualization

Density plot

# Basic density plot
qplot(weight, data = mydata, geom = "density")

# Change density plot line color by group (sex)
# change line type
qplot(weight, data = mydata, geom = "density",
    color = sex, linetype = sex)

qplot: Quick plot with ggplot2 - R software and data visualizationqplot: Quick plot with ggplot2 - R software and data visualization

Main titles and axis labels

Titles can be added to the plot as follow:

qplot(weight, data = mydata, geom = "density",
      xlab = "Weight (kg)", ylab = "Density", 
      main = "Density plot of Weight")

qplot: Quick plot with ggplot2 - R software and data visualization

Infos

This analysis was performed using R (ver. 3.2.1) and ggplot2 (ver 1.0.1).

ggplot2 area plot : Quick start guide - R software and data visualization

$
0
0


This R tutorial describes how to create an area plot using R software and ggplot2 package. We’ll see also, how to color under density curve using geom_area.

The function geom_area() is used. You can also add a line for the mean using the function geom_vline.

ggplot2 geom_area - R software and data visualization

Prepare the data

This data will be used for the examples below :

set.seed(1234)

df <- data.frame(
  sex=factor(rep(c("F", "M"), each=200)),
  weight=round(c(rnorm(200, mean=55, sd=5),
                 rnorm(200, mean=65, sd=5)))
  )

head(df)
##   sex weight
## 1   F     49
## 2   F     56
## 3   F     60
## 4   F     43
## 5   F     57
## 6   F     58

Basic area plots

library(ggplot2)
p <- ggplot(df, aes(x=weight))

# Basic area plot
p + geom_area(stat = "bin")

# y axis as density value
p + geom_area(aes(y = ..density..), stat = "bin")

# Add mean line
p + geom_area(stat = "bin", fill = "lightblue")+
  geom_vline(aes(xintercept=mean(weight)),
            color="blue", linetype="dashed", size=1)

ggplot2 geom_area - R software and data visualizationggplot2 geom_area - R software and data visualizationggplot2 geom_area - R software and data visualization

Change line types and colors

# Change line color and fill color
p + geom_area(stat ="bin", color="darkblue",
              fill="lightblue")

# Change line type
p + geom_area(stat = "bin", color= "black",
              fill="lightgrey", linetype="dashed")

ggplot2 geom_area - R software and data visualizationggplot2 geom_area - R software and data visualization

Read more on ggplot2 line types : ggplot2 line types

Change colors by groups

Calculate the mean of each group :

library(plyr)
mu <- ddply(df, "sex", summarise, grp.mean=mean(weight))
head(mu)
##   sex grp.mean
## 1   F    54.70
## 2   M    65.36

Change fill colors

Area plot fill colors can be automatically controlled by the levels of sex :

# Change area plot fill colors by groups
ggplot(df, aes(x=weight, fill=sex)) +
  geom_area(stat ="bin")

# Use semi-transparent fill
p<-ggplot(df, aes(x=weight, fill=sex)) +
  geom_area(stat ="bin", alpha=0.6) +
  theme_classic()
p

# Add mean lines
p+geom_vline(data=mu, aes(xintercept=grp.mean, color=sex),
             linetype="dashed")

ggplot2 geom_area - R software and data visualizationggplot2 geom_area - R software and data visualizationggplot2 geom_area - R software and data visualization

It is also possible to change manually the area plot fill colors using the functions :

  • scale_fill_manual() : to use custom colors
  • scale_fill_brewer() : to use color palettes from RColorBrewer package
  • scale_fill_grey() : to use grey color palettes
# Use custom color palettes
p+scale_fill_manual(values=c("#999999", "#E69F00")) 

# use brewer color palettes
p+scale_fill_brewer(palette="Dark2") 

# Use grey scale
p + scale_fill_grey()

ggplot2 geom_area - R software and data visualizationggplot2 geom_area - R software and data visualizationggplot2 geom_area - R software and data visualization

Read more on ggplot2 colors here : ggplot2 colors

Change the legend position

p + theme(legend.position="top")

p + theme(legend.position="bottom")

p + theme(legend.position="none") # Remove legend

ggplot2 geom_area - R software and data visualizationggplot2 geom_area - R software and data visualizationggplot2 geom_area - R software and data visualization

The allowed values for the arguments legend.position are : “left”,“top”, “right”, “bottom”.

Read more on ggplot legends : ggplot2 legends

Use facets

Split the plot in multiple panels :

p<-ggplot(df, aes(x=weight))+
  geom_area(stat ="bin")+facet_grid(sex ~ .)
p

# Add mean lines
p+geom_vline(data=mu, aes(xintercept=grp.mean, color="red"),
             linetype="dashed")

ggplot2 geom_area - R software and data visualizationggplot2 geom_area - R software and data visualization

Read more on facets : ggplot2 facets

Contrasting bar plot and area plot

An area plot is the continuous analog of a stacked bar chart. In the following example, we’ll use diamonds data set [in ggplot2 package]:

# Load the data
data("diamonds")
p <- ggplot(diamonds, aes(x = price, fill = cut))
head(diamonds)
##   carat       cut color clarity depth table price    x    y    z
## 1  0.23     Ideal     E     SI2  61.5    55   326 3.95 3.98 2.43
## 2  0.21   Premium     E     SI1  59.8    61   326 3.89 3.84 2.31
## 3  0.23      Good     E     VS1  56.9    65   327 4.05 4.07 2.31
## 4  0.29   Premium     I     VS2  62.4    58   334 4.20 4.23 2.63
## 5  0.31      Good     J     SI2  63.3    58   335 4.34 4.35 2.75
## 6  0.24 Very Good     J    VVS2  62.8    57   336 3.94 3.96 2.48
# Bar plot
p + geom_bar()

ggplot2 geom_area - R software and data visualization

# Area plot
p + geom_area(stat = "bin") +
  scale_fill_brewer(palette="Dark2") 

ggplot2 geom_area - R software and data visualization

Coloring under density curve using geom_area

dat <- with(density(df$weight), data.frame(x, y))
ggplot(data = dat, mapping = aes(x = x, y = y)) +
    geom_line()+
    geom_area(mapping = aes(x = ifelse(x>65 & x< 70 , x, 0)), fill = "red") +
    xlim(30, 80)

ggplot2 geom_area - R software and data visualization

Infos

This analysis has been performed using R software (ver. 3.2.1) and ggplot2 (ver. 1.0.1)
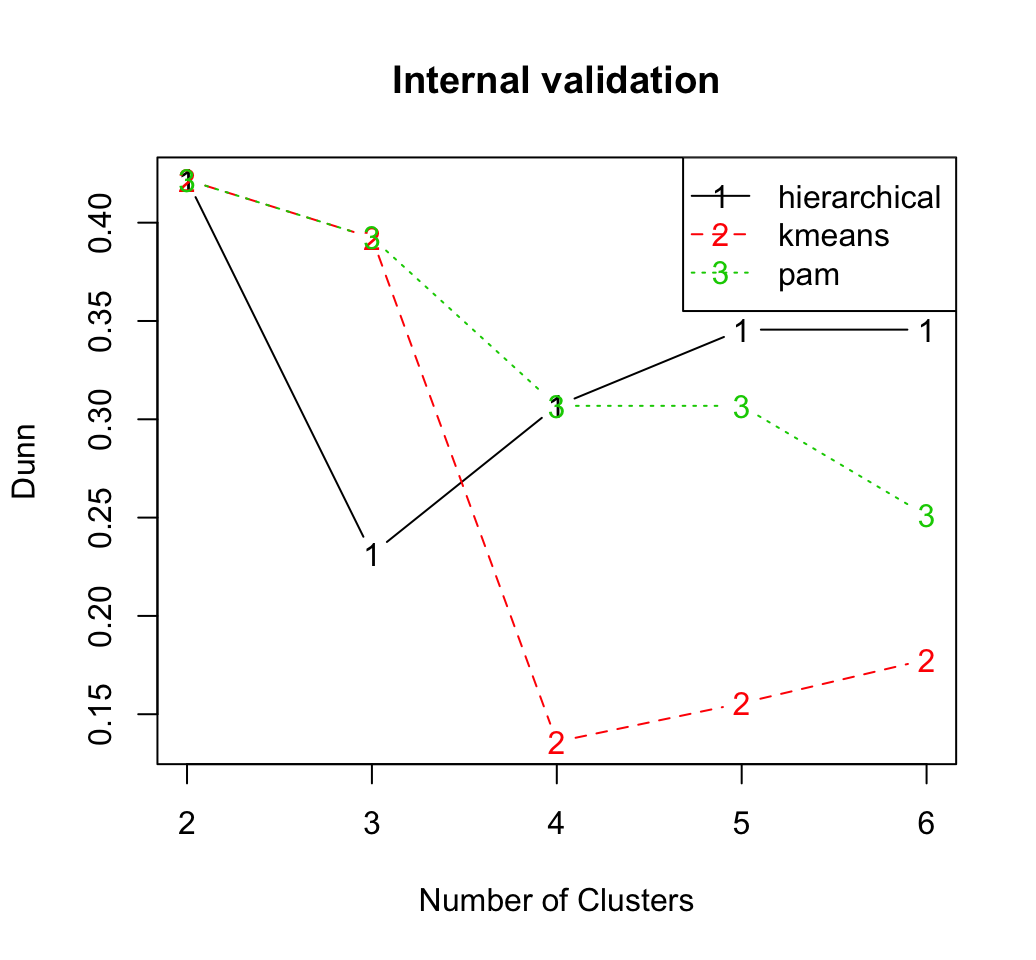
ggplot2 line plot : Quick start guide - R software and data visualization

$
0
0


This R tutorial describes how to create line plots using R software and ggplot2 package.

In a line graph, observations are ordered by x value and connected.

The functions geom_line(), geom_step(), or geom_path() can be used.

x value (for x axis) can be :

  • date : for a time series data
  • texts
  • discrete numeric values
  • continuous numeric values

ggplot2 line plot - R software and data visualization

Basic line plots

Data

Data derived from ToothGrowth data sets are used. ToothGrowth describes the effect of Vitamin C on tooth growth in Guinea pigs.

df <- data.frame(dose=c("D0.5", "D1", "D2"),
                len=c(4.2, 10, 29.5))

head(df)
##   dose  len
## 1 D0.5  4.2
## 2   D1 10.0
## 3   D2 29.5
  • len : Tooth length
  • dose : Dose in milligrams (0.5, 1, 2)

Create line plots with points

library(ggplot2)
# Basic line plot with points
ggplot(data=df, aes(x=dose, y=len, group=1)) +
  geom_line()+
  geom_point()

# Change the line type
ggplot(data=df, aes(x=dose, y=len, group=1)) +
  geom_line(linetype = "dashed")+
  geom_point()

# Change the color
ggplot(data=df, aes(x=dose, y=len, group=1)) +
  geom_line(color="red")+
  geom_point()

ggplot2 line plot - R software and data visualizationggplot2 line plot - R software and data visualizationggplot2 line plot - R software and data visualization

Read more on line types : ggplot2 line types

You can add an arrow to the line using the grid package :

library(grid)
# Add an arrow
ggplot(data=df, aes(x=dose, y=len, group=1)) +
  geom_line(arrow = arrow())+
  geom_point()

# Add a closed arrow to the end of the line
myarrow=arrow(angle = 15, ends = "both", type = "closed")
ggplot(data=df, aes(x=dose, y=len, group=1)) +
  geom_line(arrow=myarrow)+
  geom_point()

ggplot2 line plot - R software and data visualizationggplot2 line plot - R software and data visualization

Observations can be also connected using the functions geom_step() or geom_path() :

ggplot(data=df, aes(x=dose, y=len, group=1)) +
  geom_step()+
  geom_point()


ggplot(data=df, aes(x=dose, y=len, group=1)) +
  geom_path()+
  geom_point()

ggplot2 line plot - R software and data visualizationggplot2 line plot - R software and data visualization


  • geom_line : Connecting observations, ordered by x value
  • geom_path() : Observations are connected in original order
  • geom_step : Connecting observations by stairs


Line plot with multiple groups

Data

Data derived from ToothGrowth data sets are used. ToothGrowth describes the effect of Vitamin C on tooth growth in Guinea pigs. Three dose levels of Vitamin C (0.5, 1, and 2 mg) with each of two delivery methods [orange juice (OJ) or ascorbic acid (VC)] are used :

df2 <- data.frame(supp=rep(c("VC", "OJ"), each=3),
                dose=rep(c("D0.5", "D1", "D2"),2),
                len=c(6.8, 15, 33, 4.2, 10, 29.5))

head(df2)
##   supp dose  len
## 1   VC D0.5  6.8
## 2   VC   D1 15.0
## 3   VC   D2 33.0
## 4   OJ D0.5  4.2
## 5   OJ   D1 10.0
## 6   OJ   D2 29.5
  • len : Tooth length
  • dose : Dose in milligrams (0.5, 1, 2)
  • supp : Supplement type (VC or OJ)

Create line plots

In the graphs below, line types, colors and sizes are the same for the two groups :

# Line plot with multiple groups
ggplot(data=df2, aes(x=dose, y=len, group=supp)) +
  geom_line()+
  geom_point()

# Change line types
ggplot(data=df2, aes(x=dose, y=len, group=supp)) +
  geom_line(linetype="dashed", color="blue", size=1.2)+
  geom_point(color="red", size=3)

ggplot2 line plot - R software and data visualizationggplot2 line plot - R software and data visualization

Change line types by groups

In the graphs below, line types and point shapes are controlled automatically by the levels of the variable supp :

# Change line types by groups (supp)
ggplot(df2, aes(x=dose, y=len, group=supp)) +
  geom_line(aes(linetype=supp))+
  geom_point()

# Change line types and point shapes
ggplot(df2, aes(x=dose, y=len, group=supp)) +
  geom_line(aes(linetype=supp))+
  geom_point(aes(shape=supp))

ggplot2 line plot - R software and data visualizationggplot2 line plot - R software and data visualization

It is also possible to change manually the line types using the function scale_linetype_manual().

# Set line types manually
ggplot(df2, aes(x=dose, y=len, group=supp)) +
  geom_line(aes(linetype=supp))+
  geom_point()+
  scale_linetype_manual(values=c("twodash", "dotted"))

ggplot2 line plot - R software and data visualization

You can read more on line types here : ggplot2 line types

If you want to change also point shapes, read this article : ggplot2 point shapes

Change line colors by groups

Line colors are controlled automatically by the levels of the variable supp :

p<-ggplot(df2, aes(x=dose, y=len, group=supp)) +
  geom_line(aes(color=supp))+
  geom_point(aes(color=supp))
p

ggplot2 line plot - R software and data visualization

It is also possible to change manually line colors using the functions :

  • scale_color_manual() : to use custom colors
  • scale_color_brewer() : to use color palettes from RColorBrewer package
  • scale_color_grey() : to use grey color palettes
# Use custom color palettes
p+scale_color_manual(values=c("#999999", "#E69F00", "#56B4E9"))

# Use brewer color palettes
p+scale_color_brewer(palette="Dark2")

# Use grey scale
p + scale_color_grey() + theme_classic()

ggplot2 line plot - R software and data visualizationggplot2 line plot - R software and data visualizationggplot2 line plot - R software and data visualization

Read more on ggplot2 colors here : ggplot2 colors

Change the legend position

p <- p + scale_color_brewer(palette="Paired")+
  theme_minimal()

p + theme(legend.position="top")

p + theme(legend.position="bottom")

# Remove legend
p + theme(legend.position="none")

ggplot2 line plot - R software and data visualizationggplot2 line plot - R software and data visualizationggplot2 line plot - R software and data visualization

The allowed values for the arguments legend.position are : “left”,“top”, “right”, “bottom”.

Read more on ggplot legend : ggplot2 legend

Line plot with a numeric x-axis

If the variable on x-axis is numeric, it can be useful to treat it as a continuous or a factor variable depending on what you want to do :

# Create some data
df2 <- data.frame(supp=rep(c("VC", "OJ"), each=3),
                dose=rep(c("0.5", "1", "2"),2),
                len=c(6.8, 15, 33, 4.2, 10, 29.5))
head(df2)
##   supp dose  len
## 1   VC  0.5  6.8
## 2   VC    1 15.0
## 3   VC    2 33.0
## 4   OJ  0.5  4.2
## 5   OJ    1 10.0
## 6   OJ    2 29.5
# x axis treated as continuous variable
df2$dose <- as.numeric(as.vector(df2$dose))
ggplot(data=df2, aes(x=dose, y=len, group=supp, color=supp)) +
  geom_line() + geom_point()+
  scale_color_brewer(palette="Paired")+
  theme_minimal()

# Axis treated as discrete variable
df2$dose<-as.factor(df2$dose)
ggplot(data=df2, aes(x=dose, y=len, group=supp, color=supp)) +
  geom_line() + geom_point()+
  scale_color_brewer(palette="Paired")+
  theme_minimal()

ggplot2 line plot - R software and data visualizationggplot2 line plot - R software and data visualization

Line plot with dates on x-axis

economics time series data sets are used :

head(economics)
##         date   pce    pop psavert uempmed unemploy
## 1 1967-06-30 507.8 198712     9.8     4.5     2944
## 2 1967-07-31 510.9 198911     9.8     4.7     2945
## 3 1967-08-31 516.7 199113     9.0     4.6     2958
## 4 1967-09-30 513.3 199311     9.8     4.9     3143
## 5 1967-10-31 518.5 199498     9.7     4.7     3066
## 6 1967-11-30 526.2 199657     9.4     4.8     3018

Plots :

# Basic line plot
ggplot(data=economics, aes(x=date, y=pop))+
  geom_line()

# Plot a subset of the data
ggplot(data=subset(economics, date > as.Date("2006-1-1")), 
       aes(x=date, y=pop))+geom_line()

ggplot2 line plot - R software and data visualizationggplot2 line plot - R software and data visualization

Change line size :

# Change line size
ggplot(data=economics, aes(x=date, y=pop, size=unemploy/pop))+
  geom_line()

ggplot2 line plot - R software and data visualization

Line graph with error bars

The function below will be used to calculate the mean and the standard deviation, for the variable of interest, in each group :

#+++++++++++++++++++++++++
# Function to calculate the mean and the standard deviation
  # for each group
#+++++++++++++++++++++++++
# data : a data frame
# varname : the name of a column containing the variable
  #to be summariezed
# groupnames : vector of column names to be used as
  # grouping variables
data_summary <- function(data, varname, groupnames){
  require(plyr)
  summary_func <- function(x, col){
    c(mean = mean(x[[col]], na.rm=TRUE),
      sd = sd(x[[col]], na.rm=TRUE))
  }
  data_sum<-ddply(data, groupnames, .fun=summary_func,
                  varname)
  data_sum <- rename(data_sum, c("mean" = varname))
 return(data_sum)
}

Summarize the data :

df3 <- data_summary(ToothGrowth, varname="len", 
                    groupnames=c("supp", "dose"))
head(df3)
##   supp dose   len       sd
## 1   OJ  0.5 13.23 4.459709
## 2   OJ  1.0 22.70 3.910953
## 3   OJ  2.0 26.06 2.655058
## 4   VC  0.5  7.98 2.746634
## 5   VC  1.0 16.77 2.515309
## 6   VC  2.0 26.14 4.797731

The function geom_errorbar() can be used to produce a line graph with error bars :

# Standard deviation of the mean
ggplot(df3, aes(x=dose, y=len, group=supp, color=supp)) + 
    geom_errorbar(aes(ymin=len-sd, ymax=len+sd), width=.1) +
    geom_line() + geom_point()+
   scale_color_brewer(palette="Paired")+theme_minimal()

# Use position_dodge to move overlapped errorbars horizontally
ggplot(df3, aes(x=dose, y=len, group=supp, color=supp)) + 
    geom_errorbar(aes(ymin=len-sd, ymax=len+sd), width=.1, 
    position=position_dodge(0.05)) +
    geom_line() + geom_point()+
   scale_color_brewer(palette="Paired")+theme_minimal()

ggplot2 line plot - R software and data visualizationggplot2 line plot - R software and data visualization

Customized line graphs

# Simple line plot
# Change point shapes and line types by groups
ggplot(df3, aes(x=dose, y=len, group = supp, shape=supp, linetype=supp))+ 
    geom_errorbar(aes(ymin=len-sd, ymax=len+sd), width=.1, 
    position=position_dodge(0.05)) +
    geom_line() +
    geom_point()+
    labs(title="Plot of lengthby dose",x="Dose (mg)", y = "Length")+
    theme_classic()


# Change color by groups
# Add error bars
p <- ggplot(df3, aes(x=dose, y=len, group = supp, color=supp))+ 
    geom_errorbar(aes(ymin=len-sd, ymax=len+sd), width=.1, 
    position=position_dodge(0.05)) +
    geom_line(aes(linetype=supp)) + 
    geom_point(aes(shape=supp))+
    labs(title="Plot of lengthby dose",x="Dose (mg)", y = "Length")+
    theme_classic()

p + theme_classic() + scale_color_manual(values=c('#999999','#E69F00'))

ggplot2 line plot - R software and data visualizationggplot2 line plot - R software and data visualization

Change colors manually :

p + scale_color_brewer(palette="Paired") + theme_minimal()

# Greens
p + scale_color_brewer(palette="Greens") + theme_minimal()

# Reds
p + scale_color_brewer(palette="Reds") + theme_minimal()

ggplot2 line plot - R software and data visualizationggplot2 line plot - R software and data visualizationggplot2 line plot - R software and data visualization

Infos

This analysis has been performed using R software (ver. 3.1.2) and ggplot2 (ver. 1.0.0)

ggplot2 : Quick correlation matrix heatmap - R software and data visualization

$
0
0


This R tutorial describes how to compute and visualize a correlation matrix using R software and ggplot2 package.

Prepare the data

mtcars data are used :

mydata <- mtcars[, c(1,3,4,5,6,7)]
head(mydata)
##                    mpg disp  hp drat    wt  qsec
## Mazda RX4         21.0  160 110 3.90 2.620 16.46
## Mazda RX4 Wag     21.0  160 110 3.90 2.875 17.02
## Datsun 710        22.8  108  93 3.85 2.320 18.61
## Hornet 4 Drive    21.4  258 110 3.08 3.215 19.44
## Hornet Sportabout 18.7  360 175 3.15 3.440 17.02
## Valiant           18.1  225 105 2.76 3.460 20.22

Compute the correlation matrix

Correlation matrix can be created using the R function cor() :

cormat <- round(cor(mydata),2)
head(cormat)
##        mpg  disp    hp  drat    wt  qsec
## mpg   1.00 -0.85 -0.78  0.68 -0.87  0.42
## disp -0.85  1.00  0.79 -0.71  0.89 -0.43
## hp   -0.78  0.79  1.00 -0.45  0.66 -0.71
## drat  0.68 -0.71 -0.45  1.00 -0.71  0.09
## wt   -0.87  0.89  0.66 -0.71  1.00 -0.17
## qsec  0.42 -0.43 -0.71  0.09 -0.17  1.00

Read more about correlation matrix data visualization : correlation data visualization in R

Create the correlation heatmap with ggplot2

The package reshape is required to melt the correlation matrix :

library(reshape2)
melted_cormat <- melt(cormat)
head(melted_cormat)
##   Var1 Var2 value
## 1  mpg  mpg  1.00
## 2 disp  mpg -0.85
## 3   hp  mpg -0.78
## 4 drat  mpg  0.68
## 5   wt  mpg -0.87
## 6 qsec  mpg  0.42

The function geom_tile()[ggplot2 package] is used to visualize the correlation matrix :

library(ggplot2)
ggplot(data = melted_cormat, aes(x=Var1, y=Var2, fill=value)) + 
  geom_tile()

ggplot2 correlation heatmap - R software and data visualization

The default plot is very ugly. We’ll see in the next sections, how to change the appearance of the heatmap.

Note that, if you have lot of data, it’s preferred to use the function geom_raster() which can be much faster.

Get the lower and upper triangles of the correlation matrix

Note that, a correlation matrix has redundant information. We’ll use the functions below to set half of it to NA.

Helper functions :

# Get lower triangle of the correlation matrix
  get_lower_tri<-function(cormat){
    cormat[upper.tri(cormat)] <- NA
    return(cormat)
  }

  # Get upper triangle of the correlation matrix
  get_upper_tri <- function(cormat){
    cormat[lower.tri(cormat)]<- NA
    return(cormat)
  }

Usage :

upper_tri <- get_upper_tri(cormat)
upper_tri
##      mpg  disp    hp  drat    wt  qsec
## mpg    1 -0.85 -0.78  0.68 -0.87  0.42
## disp  NA  1.00  0.79 -0.71  0.89 -0.43
## hp    NA    NA  1.00 -0.45  0.66 -0.71
## drat  NA    NA    NA  1.00 -0.71  0.09
## wt    NA    NA    NA    NA  1.00 -0.17
## qsec  NA    NA    NA    NA    NA  1.00

Finished correlation matrix heatmap

Melt the correlation data and drop the rows with NA values :

# Melt the correlation matrix
library(reshape2)
melted_cormat <- melt(upper_tri, na.rm = TRUE)

# Heatmap
library(ggplot2)
ggplot(data = melted_cormat, aes(Var2, Var1, fill = value))+
 geom_tile(color = "white")+
 scale_fill_gradient2(low = "blue", high = "red", mid = "white", 
   midpoint = 0, limit = c(-1,1), space = "Lab", 
   name="Pearson\nCorrelation") +
  theme_minimal()+ 
 theme(axis.text.x = element_text(angle = 45, vjust = 1, 
    size = 12, hjust = 1))+
 coord_fixed()

ggplot2 correlation heatmap - R software and data visualization

In the figure above :

  • negative correlations are in blue color and positive correlations in red. The function scale_fill_gradient2 is used with the argument limit = c(-1,1) as correlation coefficients range from -1 to 1.
  • coord_fixed() : this function ensures that one unit on the x-axis is the same length as one unit on the y-axis.

Reorder the correlation matrix

This section describes how to reorder the correlation matrix according to the correlation coefficient. This is useful to identify the hidden pattern in the matrix. hclust for hierarchical clustering order is used in the example below.

Helper function to reorder the correlation matrix :

reorder_cormat <- function(cormat){
# Use correlation between variables as distance
dd <- as.dist((1-cormat)/2)
hc <- hclust(dd)
cormat <-cormat[hc$order, hc$order]
}

Reordered correlation data visualization :

# Reorder the correlation matrix
cormat <- reorder_cormat(cormat)
upper_tri <- get_upper_tri(cormat)

# Melt the correlation matrix
melted_cormat <- melt(upper_tri, na.rm = TRUE)

# Create a ggheatmap
ggheatmap <- ggplot(melted_cormat, aes(Var2, Var1, fill = value))+
 geom_tile(color = "white")+
 scale_fill_gradient2(low = "blue", high = "red", mid = "white", 
   midpoint = 0, limit = c(-1,1), space = "Lab", 
    name="Pearson\nCorrelation") +
  theme_minimal()+ # minimal theme
 theme(axis.text.x = element_text(angle = 45, vjust = 1, 
    size = 12, hjust = 1))+
 coord_fixed()

# Print the heatmap
print(ggheatmap)

ggplot2 correlation heatmap - R software and data visualization

Add correlation coefficients on the heatmap

  1. Use geom_text() to add the correlation coefficients on the graph
  2. Use a blank theme (remove axis labels, panel grids and background, and axis ticks)
  3. Use guides() to change the position of the legend title
ggheatmap + 
geom_text(aes(Var2, Var1, label = value), color = "black", size = 4) +
theme(
  axis.title.x = element_blank(),
  axis.title.y = element_blank(),
  panel.grid.major = element_blank(),
  panel.border = element_blank(),
  panel.background = element_blank(),
  axis.ticks = element_blank(),
  legend.justification = c(1, 0),
  legend.position = c(0.6, 0.7),
  legend.direction = "horizontal")+
  guides(fill = guide_colorbar(barwidth = 7, barheight = 1,
                title.position = "top", title.hjust = 0.5))

ggplot2 correlation heatmap - R software and data visualization

Read more about correlation matrix data visualization : correlation data visualization in R

Infos

This analysis has been performed using R software (ver. 3.2.1) and ggplot2 (ver. 1.0.1)

Clustering Validation Statistics: 4 Vital Things Everyone Should Know - Unsupervised Machine Learning

$
0
0


Clustering is an unsupervised machine learning method for partitioning dataset into a set of groups or clusters. A big issue is that clustering methods will return clusters even if the data does not contain any clusters. Therefore, it’s necessary i) to assess clustering tendency before the analysis and ii) to validate the quality of the result after clustering.

A variety of measures has been proposed in the literature for evaluating clustering results. The term clustering validation is used to design the procedure of evaluating the results of a clustering algorithm.

Generally, clustering validation statistics can be categorized into 4 classes (Theodoridis and Koutroubas, 2008; G. Brock et al., 2008, Charrad et al., 2014):


  1. Relative clustering validation, which evaluates the clustering structure by varying different parameter values for the same algorithm (e.g.,: varying the number of clusters k). It’s generally used for determining the optimal number of clusters.

  2. External clustering validation, which consists in comparing the results of a cluster analysis to an externally known result, such as externally provided class labels. Since we know the “true” cluster number in advance, this approach is mainly used for selecting the right clustering algorithm for a specific dataset.

  3. Internal clustering validation, which use the internal information of the clustering process to evaluate the goodness of a clustering structure without reference to external information. It can be also used for estimating the number of clusters and the appropriate clustering algorithm without any external data.

  4. Clustering stability validation, which is a special version of internal validation. It evaluates the consistency of a clustering result by comparing it with the clusters obtained after each column is removed, one at a time. Clustering stability measures will be described in a future chapter.


The aim of this article is to:

  • describe the different methods for clustering validation
  • compare the quality of clustering results obtained with different clustering algorithms
  • provide R lab section for validating clustering results

In all the examples presented here, we’ll apply k-means, PAM and hierarchical clustering. Note that, the functions used in this article can be applied to evaluate the validity of any other clustering methods.

1 Required packages

The following packages will be used:

  • cluster for computing PAM clustering and for analyzing cluster silhouettes
  • factoextra for simplifying clustering workflows and for visualizing clusters using ggplot2 plotting system
  • NbClust for determining the optimal number of clusters in the data
  • fpc for computing clustering validation statistics

Install factoextra package as follow:

if(!require(devtools)) install.packages("devtools")
devtools::install_github("kassambara/factoextra")

The remaining packages can be installed using the code below:

pkgs <- c("cluster", "fpc", "NbClust")
install.packages(pkgs)

Load packages:

library(factoextra)
library(cluster)
library(fpc)
library(NbClust)

2 Data preparation

The data set iris is used. We start by excluding the column “Species” and scaling the data using the function scale():

# Load the data
data(iris)
head(iris)
##   Sepal.Length Sepal.Width Petal.Length Petal.Width Species
## 1          5.1         3.5          1.4         0.2  setosa
## 2          4.9         3.0          1.4         0.2  setosa
## 3          4.7         3.2          1.3         0.2  setosa
## 4          4.6         3.1          1.5         0.2  setosa
## 5          5.0         3.6          1.4         0.2  setosa
## 6          5.4         3.9          1.7         0.4  setosa
# Remove species column (5) and scale the data
iris.scaled <- scale(iris[, -5])

Iris data set gives the measurements in centimeters of the variables sepal length and width and petal length and width, respectively, for 50 flowers from each of 3 species of iris. The species are Iris setosa, versicolor, and virginica.

3 Relative measures: Determine the optimal number of clusters

Many indices (more than 30) has been published in the literature for finding the right number of clusters in a dataset. The process has been covered in my previous article: Determining the optimal number of clusters.

In this section we’ll use the package NbClust which will compute, with a single function call, 30 indices for deciding the right number of clusters in the dataset:

# Compute the number of clusters
library(NbClust)
nb <- NbClust(iris.scaled, distance = "euclidean", min.nc = 2,
        max.nc = 10, method = "complete", index ="all")
# Visualize the result
library(factoextra)
fviz_nbclust(nb) + theme_minimal()
## Among all indices: 
## ===================
## * 2 proposed  0 as the best number of clusters
## * 1 proposed  1 as the best number of clusters
## * 2 proposed  2 as the best number of clusters
## * 18 proposed  3 as the best number of clusters
## * 3 proposed  10 as the best number of clusters
## 
## Conclusion
## =========================
## * Accoridng to the majority rule, the best number of clusters is  3 .

Clustering validation statistics - Unsupervised Machine Learning

4 Clustering analysis

We’ll use the function eclust() [in factoextra] which provides several advantages as described in the previous chapter: Visual Enhancement of Clustering Analysis.

eclust() stands for enhanced clustering. It simplifies the workflow of clustering analysis and, it can be used to compute hierarchical clustering and partititioning clustering in a single line function call.

4.1 Example of partitioning method results

K-means and PAM clustering are described in this section. We’ll split the data into 3 clusters as follow:

# K-means clustering
km.res <- eclust(iris.scaled, "kmeans", k = 3,
                 nstart = 25, graph = FALSE)
# k-means group number of each observation
km.res$cluster
##   [1] 1 1 1 1 1 1 1 1 1 1 1 1 1 1 1 1 1 1 1 1 1 1 1 1 1 1 1 1 1 1 1 1 1 1 1
##  [36] 1 1 1 1 1 1 1 1 1 1 1 1 1 1 1 2 2 2 3 3 3 2 3 3 3 3 3 3 3 3 2 3 3 3 3
##  [71] 2 3 3 3 3 2 2 2 3 3 3 3 3 3 3 2 2 3 3 3 3 3 3 3 3 3 3 3 3 3 2 3 2 2 2
## [106] 2 3 2 2 2 2 2 2 3 3 2 2 2 2 3 2 3 2 3 2 2 3 2 2 2 2 2 2 3 3 2 2 2 3 2
## [141] 2 2 3 2 2 2 3 2 2 3
# Visualize k-means clusters
fviz_cluster(km.res, geom = "point", frame.type = "norm")

Clustering validation statistics - Unsupervised Machine Learning

# PAM clustering
pam.res <- eclust(iris.scaled, "pam", k = 3, graph = FALSE)
pam.res$cluster
##   [1] 1 1 1 1 1 1 1 1 1 1 1 1 1 1 1 1 1 1 1 1 1 1 1 1 1 1 1 1 1 1 1 1 1 1 1
##  [36] 1 1 1 1 1 1 1 1 1 1 1 1 1 1 1 2 2 2 3 3 3 2 3 3 3 3 3 3 3 3 2 3 3 3 3
##  [71] 3 3 3 3 3 2 2 2 3 3 3 3 3 3 3 3 2 3 3 3 3 3 3 3 3 3 3 3 3 3 2 3 2 2 2
## [106] 2 3 2 2 2 2 2 2 3 2 2 2 2 2 3 2 3 2 3 2 2 3 3 2 2 2 2 2 3 3 2 2 2 3 2
## [141] 2 2 3 2 2 2 3 2 2 3
# Visualize pam clusters
fviz_cluster(pam.res, geom = "point", frame.type = "norm")

Clustering validation statistics - Unsupervised Machine Learning

Read more about partitioning methods: Partitioning clustering

4.2 Example of hierarchical clustering results

# Enhanced hierarchical clustering
res.hc <- eclust(iris.scaled, "hclust", k = 3,
                method = "complete", graph = FALSE) 
head(res.hc$cluster, 15)
##  1  2  3  4  5  6  7  8  9 10 11 12 13 14 15 
##  1  1  1  1  1  1  1  1  1  1  1  1  1  1  1
# Dendrogram
fviz_dend(res.hc, rect = TRUE, show_labels = FALSE) 

Clustering validation statistics - Unsupervised Machine Learning

Read more about hierarchical clustering: Hierarchical clustering

5 Internal clustering validation measures

In this section, we describe the most widely used clustering validation indices. Recall that the goal of clustering algorithms is to split the dataset into clusters of objects, such that:

  • the objects in the same cluster are similar as much as possible,
  • and the objects in different clusters are highly distinct

That is, we want the average distance within cluster to be as small as possible; and the average distance between clusters to be as large as possible.

Internal validation measures reflect often the compactness, the connectedness and separation of the cluster partitions.


  1. Compactness measures evaluate how close are the objects within the same cluster. A lower within-cluster variation is an indicator of a good compactness (i.e., a good clustering). The different indices for evaluating the compactness of clusters are base on distance measures such as the cluster-wise within average/median distances between observations.

  2. Separation measures determine how well-separated a cluster is from other clusters. The indices used as separation measures include:
    • distances between cluster centers
    • the pairwise minimum distances between objects in different clusters
  3. Connectivity corresponds to what extent items are placed in the same cluster as their nearest neighbors in the data space. The connectivity has a value between 0 and infinity and should be minimized.


Generally most of the indices used for internal clustering validation combine compactness and separation measures as follow:

\[ Index = \frac{(\alpha \times Separation)}{(\beta \times Compactness)} \]

Where \(\alpha\) and \(\beta\) are weights.

In this section, we’ll describe the two commonly used indices for assessing the goodness of clustering: silhouette width and Dunn index.

Recall that, more than 30 indices has been published in literature. They can be easily computed using the function NbClust which has been described in my previous article: Determining the optimal number of clusters.

5.1 Silhouette analysis

5.1.1 Concept and algorithm

Silhouette analysis measures how well an observation is clustered and it estimates the average distance between clusters. The silhouette plot displays a measure of how close each point in one cluster is to points in the neighboring clusters.

For each observation \(i\), the silhouette width \(s_i\) is calculated as follows:


  1. For each observation \(i\), calculate the average dissimilarity \(a_i\) between \(i\) and all other points of the cluster to which i belongs.
  2. For all other clusters \(C\), to which i does not belong, calculate the average dissimilarity \(d(i, C)\) of \(i\) to all observations of C. The smallest of these \(d(i,C)\) is defined as \(b_i= \min_C d(i,C)\). The value of \(b_i\) can be seen as the dissimilarity between \(i\) and its “neighbor” cluster, i.e., the nearest one to which it does not belong.

  3. Finally the silhouette width of the observation \(i\) is defined by the formula: \(S_i = (b_i - a_i)/max(a_i, b_i)\).


5.1.2 Interpretation of silhouette width

Silhouette width can be interpreted as follow:


  • Observations with a large \(S_i\) (almost 1) are very well clustered

  • A small \(S_i\) (around 0) means that the observation lies between two clusters

  • Observations with a negative \(S_i\) are probably placed in the wrong cluster.


5.1.3 R functions for silhouette analysis

The silhouette coefficient of observations can be computed using the function silhouette() [in cluster package]:

silhouette(x, dist, ...)
  • x: an integer vector containing the cluster assignment of observations
  • dist: a dissimilarity object created by the function dist()

The function silhouette() returns an object, of class silhouette containing:

  • The cluster number of each observation i
  • The neighbor cluster of i (the cluster, not containing i, for which the average dissimilarity between its observations and i is minimal)
  • The silhouette width\(s_i\) of each observation

The R code below computes silhouette analysis and draw the result using R base plot:

# Silhouette coefficient of observations
library("cluster")
sil <- silhouette(km.res$cluster, dist(iris.scaled))
head(sil[, 1:3], 10)
##       cluster neighbor sil_width
##  [1,]       1        3 0.7341949
##  [2,]       1        3 0.5682739
##  [3,]       1        3 0.6775472
##  [4,]       1        3 0.6205016
##  [5,]       1        3 0.7284741
##  [6,]       1        3 0.6098848
##  [7,]       1        3 0.6983835
##  [8,]       1        3 0.7308169
##  [9,]       1        3 0.4882100
## [10,]       1        3 0.6315409
# Silhouette plot
plot(sil, main ="Silhouette plot - K-means")

Clustering validation statistics - Unsupervised Machine Learning

Use factoextra for elegant data visualization:

library(factoextra)
fviz_silhouette(sil)

The summary of the silhouette analysis can be computed using the function summary.silhouette() as follow:

# Summary of silhouette analysis
si.sum <- summary(sil)
# Average silhouette width of each cluster
si.sum$clus.avg.widths
##         1         2         3 
## 0.6363162 0.3473922 0.3933772
# The total average (mean of all individual silhouette widths)
si.sum$avg.width
## [1] 0.4599482
# The size of each clusters
si.sum$clus.sizes
## cl
##  1  2  3 
## 50 47 53

Note that, if the clustering analysis is done using the function eclust(), cluster silhouettes are computed automatically and stored in the object silinfo. The results can be easily visualized as shown in the next sections.

5.1.4 Silhouette plot for k-means clustering

It’s possible to draw silhouette plot using the function fviz_silhouette() [in factoextra package], which will also print a summary of the silhouette analysis output. To avoid this, you can use the option print.summary = FALSE.

# Default plot
fviz_silhouette(km.res)
##   cluster size ave.sil.width
## 1       1   50          0.64
## 2       2   47          0.35
## 3       3   53          0.39

Clustering validation statistics - Unsupervised Machine Learning

# Change the theme and color
fviz_silhouette(km.res, print.summary = FALSE) +
  scale_fill_brewer(palette = "Dark2") +
  scale_color_brewer(palette = "Dark2") +
  theme_minimal()+
  theme(axis.text.x = element_blank(), axis.ticks.x = element_blank())

Clustering validation statistics - Unsupervised Machine Learning

Silhouette information can be extracted as follow:

# Silhouette information
silinfo <- km.res$silinfo
names(silinfo)
## [1] "widths"          "clus.avg.widths" "avg.width"
# Silhouette widths of each observation
head(silinfo$widths[, 1:3], 10)
##    cluster neighbor sil_width
## 1        1        3 0.7341949
## 41       1        3 0.7333345
## 8        1        3 0.7308169
## 18       1        3 0.7287522
## 5        1        3 0.7284741
## 40       1        3 0.7247047
## 38       1        3 0.7244191
## 12       1        3 0.7217939
## 28       1        3 0.7215103
## 29       1        3 0.7145192
# Average silhouette width of each cluster
silinfo$clus.avg.widths
## [1] 0.6363162 0.3473922 0.3933772
# The total average (mean of all individual silhouette widths)
silinfo$avg.width
## [1] 0.4599482
# The size of each clusters
km.res$size
## [1] 50 47 53

5.1.5 Silhouette plot for PAM clustering

fviz_silhouette(pam.res)
##   cluster size ave.sil.width
## 1       1   50          0.63
## 2       2   45          0.35
## 3       3   55          0.38

Clustering validation statistics - Unsupervised Machine Learning

5.1.6 Silhouette plot for hierarchical clustering

fviz_silhouette(res.hc)
##   cluster size ave.sil.width
## 1       1   49          0.75
## 2       2   75          0.37
## 3       3   26          0.51

Clustering validation statistics - Unsupervised Machine Learning

5.1.7 Samples with a negative silhouette coefficient

It can be seen that several samples have a negative silhouette coefficient in the hierarchical clustering. This means that they are not in the right cluster.

We can find the name of these samples and determine the clusters they are closer (neighbor cluster), as follow:

# Silhouette width of observation
sil <- res.hc$silinfo$widths[, 1:3]
# Objects with negative silhouette
neg_sil_index <- which(sil[, 'sil_width'] < 0)
sil[neg_sil_index, , drop = FALSE]
##     cluster neighbor   sil_width
## 51        2        3 -0.02848264
## 148       2        3 -0.03799687
## 129       2        3 -0.09622863
## 111       2        3 -0.14461589
## 109       2        3 -0.14991556
## 133       2        3 -0.18730218
## 42        2        1 -0.39515010

5.2 Dunn index

5.2.1 Concept and algorithm

Dunn index is another internal clustering validation measure which can be computed as follow:


  1. For each cluster, compute the distance between each of the objects in the cluster and the objects in the other clusters
  2. Use the minimum of this pairwise distance as the inter-cluster separation (min.separation)

  3. For each cluster, compute the distance between the objects in the same cluster.
  4. Use the maximal intra-cluster distance (i.e maximum diameter) as the intra-cluster compactness

  5. Calculate Dunn index (D) as follow:

\[ D = \frac{min.separation}{max.diameter} \]


If the data set contains compact and well-separated clusters, the diameter of the clusters is expected to be small and the distance between the clusters is expected to be large. Thus, Dunn index should be maximized.

5.2.2 R function for computing Dunn index

The function cluster.stats() [in fpc package] and the function NbClust() [in NbClust package] can be used to compute Dunn index and many other indices.

The function cluster.stats() is described in the next section.

5.3 Clustering validation statistics

In this section, we’ll describe the R function cluster.stats() [in fpc package] for computing a number of distance based statistics which can be used either for cluster validation, comparison between clustering and decision about the number of clusters.

The simplified format is:

cluster.stats(d = NULL, clustering, al.clustering = NULL)

  • d: a distance object between cases as generated by the dist() function
  • clustering: vector containing the cluster number of each observation
  • alt.clustering: vector such as for clustering, indicating an alternative clustering


The function cluster.stats() returns a list containing many components useful for analyzing the intrinsic characteristics of a clustering:

  • cluster.number: number of clusters
  • cluster.size: vector containing the number of points in each cluster
  • average.distance, median.distance: vector containing the cluster-wise within average/median distances
  • average.between: average distance between clusters. We want it to be as large as possible
  • average.within: average distance within clusters. We want it to be as small as possible
  • clus.avg.silwidths: vector of cluster average silhouette widths. Recall that, the silhouette width is also an estimate of the average distance between clusters. Its value is comprised between 1 and -1 with a value of 1 indicating a very good cluster.
  • within.cluster.ss: a generalization of the within clusters sum of squares (k-means objective function), which is obtained if d is a Euclidean distance matrix.
  • dunn, dunn2: Dunn index
  • corrected.rand, vi: Two indexes to assess the similarity of two clustering: the corrected Rand index and Meila’s VI

All the above elements can be used to evaluate the internal quality of clustering.

In the following sections, we’ll compute the clustering quality statistics for k-means, pam and hierarchical clustering. Look at the within.cluster.ss (within clusters sum of squares), the average.within (average distance within clusters) and clus.avg.silwidths (vector of cluster average silhouette widths).

5.3.0.1 Cluster statistics for k-means clustering

library(fpc)
# Compute pairwise-distance matrices
dd <- dist(iris.scaled, method ="euclidean")
# Statistics for k-means clustering
km_stats <- cluster.stats(dd,  km.res$cluster)
# (k-means) within clusters sum of squares
km_stats$within.cluster.ss
## [1] 138.8884
# (k-means) cluster average silhouette widths
km_stats$clus.avg.silwidths
##         1         2         3 
## 0.6363162 0.3473922 0.3933772
# Display all statistics
km_stats
## $n
## [1] 150
## 
## $cluster.number
## [1] 3
## 
## $cluster.size
## [1] 50 47 53
## 
## $min.cluster.size
## [1] 47
## 
## $noisen
## [1] 0
## 
## $diameter
## [1] 5.034198 3.343671 2.922371
## 
## $average.distance
## [1] 1.175155 1.307716 1.197061
## 
## $median.distance
## [1] 0.9884177 1.2383531 1.1559887
## 
## $separation
## [1] 1.5533592 0.1333894 0.1333894
## 
## $average.toother
## [1] 3.647912 3.081212 2.674298
## 
## $separation.matrix
##          [,1]      [,2]      [,3]
## [1,] 0.000000 2.4150235 1.5533592
## [2,] 2.415024 0.0000000 0.1333894
## [3,] 1.553359 0.1333894 0.0000000
## 
## $ave.between.matrix
##          [,1]     [,2]     [,3]
## [1,] 0.000000 4.129179 3.221129
## [2,] 4.129179 0.000000 2.092563
## [3,] 3.221129 2.092563 0.000000
## 
## $average.between
## [1] 3.130708
## 
## $average.within
## [1] 1.222246
## 
## $n.between
## [1] 7491
## 
## $n.within
## [1] 3684
## 
## $max.diameter
## [1] 5.034198
## 
## $min.separation
## [1] 0.1333894
## 
## $within.cluster.ss
## [1] 138.8884
## 
## $clus.avg.silwidths
##         1         2         3 
## 0.6363162 0.3473922 0.3933772 
## 
## $avg.silwidth
## [1] 0.4599482
## 
## $g2
## NULL
## 
## $g3
## NULL
## 
## $pearsongamma
## [1] 0.679696
## 
## $dunn
## [1] 0.02649665
## 
## $dunn2
## [1] 1.600166
## 
## $entropy
## [1] 1.097412
## 
## $wb.ratio
## [1] 0.3904057
## 
## $ch
## [1] 241.9044
## 
## $cwidegap
## [1] 1.3892251 0.9432249 0.7824508
## 
## $widestgap
## [1] 1.389225
## 
## $sindex
## [1] 0.3524812
## 
## $corrected.rand
## NULL
## 
## $vi
## NULL

Read the documentation of cluster.stats() for details about all the available indices.

The same statistics can be computed for pam clustering and hierarchical clustering.

5.3.0.2 Cluster statistics for PAM clustering

# Statistics for pam clustering
pam_stats <- cluster.stats(dd,  pam.res$cluster)
# (pam) within clusters sum of squares
pam_stats$within.cluster.ss
## [1] 140.2856
# (pam) cluster average silhouette widths
pam_stats$clus.avg.silwidths
##         1         2         3 
## 0.6346397 0.3496332 0.3823817

5.3.0.3 Cluster statistics for hierarchical clustering

# Statistics for hierarchical clustering
hc_stats <- cluster.stats(dd,  res.hc$cluster)
# (HCLUST) within clusters sum of squares
hc_stats$within.cluster.ss
## [1] 152.7107
# (HCLUST) cluster average silhouette widths
hc_stats$clus.avg.silwidths
##         1         2         3 
## 0.6688130 0.3154184 0.4488197

6 External clustering validation

The aim is to compare the identified clusters (by k-means, pam or hierarchical clustering) to a reference.

To compare two cluster solutions, use the cluster.stats() function as follow:

res.stat <- cluster.stats(d, solution1$cluster, solution2$cluster)

Among the values returned by the function cluster.stats(), there are two indexes to assess the similarity of two clustering, namely the corrected Rand index and Meila’s VI.

We know that the iris data contains exactly 3 groups of species.

Does the K-means clustering matches with the true structure of the data?

We can use the function cluster.stats() to answer to this question.

A cross-tabulation can be computed as follow:

table(iris$Species, km.res$cluster)
##             
##               1  2  3
##   setosa     50  0  0
##   versicolor  0 11 39
##   virginica   0 36 14

It can be seen that:

  • All setosa species (n = 50) has been classified in cluster 1
  • A large number of versicor species (n = 39 ) has been classified in cluster 3. Some of them ( n = 11) have been classified in cluster 2.
  • A large number of virginica species (n = 36 ) has been classified in cluster 2. Some of them (n = 14) have been classified in cluster 3.

It’s possible to quantify the agreement between Species and k-means clusters using either the corrected Rand index and Meila’s VI provided as follow:

library("fpc")
# Compute cluster stats
species <- as.numeric(iris$Species)
clust_stats <- cluster.stats(d = dist(iris.scaled), 
                             species, km.res$cluster)
# Corrected Rand index
clust_stats$corrected.rand
## [1] 0.6201352
# VI
clust_stats$vi
## [1] 0.7477749

The corrected Rand index provides a measure for assessing the similarity between two partitions, adjusted for chance. Its range is -1 (no agreement) to 1 (perfect agreement). Agreement between the specie types and the cluster solution is 0.62 using Rand index and 0.748 using Meila’s VI

The same analysis can be computed for both pam and hierarchical clustering:

# Agreement between species and pam clusters
table(iris$Species, pam.res$cluster)
##             
##               1  2  3
##   setosa     50  0  0
##   versicolor  0  9 41
##   virginica   0 36 14
cluster.stats(d = dist(iris.scaled), 
              species, pam.res$cluster)$vi
## [1] 0.7129034
# Agreement between species and HC clusters
table(iris$Species, res.hc$cluster)
##             
##               1  2  3
##   setosa     49  1  0
##   versicolor  0 50  0
##   virginica   0 24 26
cluster.stats(d = dist(iris.scaled), 
              species, res.hc$cluster)$vi
## [1] 0.6097098

External clustering validation, can be used to select suitable clustering algorithm for a given dataset.

7 Infos

This analysis has been performed using R software (ver. 3.2.1)

  • Malika Charrad, Nadia Ghazzali, Veronique Boiteau, Azam Niknafs (2014). NbClust: An R Package for Determining the Relevant Number of Clusters in a Data Set. Journal of Statistical Software, 61(6), 1-36. URL http://www.jstatsoft.org/v61/i06/.
  • Theodoridis S, Koutroubas K (2008). Pattern Recognition. 4th edition. Academic Press.

Determining the optimal number of clusters: 3 must known methods - Unsupervised Machine Learning

$
0
0


The first step in clustering analysis is to assess whether the dataset is clusterable. This has been described in a chapter entitled: Assessing Clustering Tendency.

Partitioning methods, such as k-means clustering require also the users to specify the number of clusters to be generated.

One fundamental question is: If the data is clusterable, then how to choose the right number of expected clusters (k)?

Unfortunately, there is no definitive answer to this question. The optimal clustering is somehow subjective and depend on the method used for measuring similarities and the parameters used for partitioning.

A simple and popular solution consists of inspecting the dendrogram produced using hierarchical clustering to see if it suggests a particular number of clusters. Unfortunately this approach is, again, subjective.

In this article, we’ll describe different methods for determining the optimal number of clusters for k-means, PAM and hierarchical clustering . These methods include direct methods and statistical testing methods.


  • Direct methods consists of optimizing a criterion, such as the within cluster sums of squares or the average silhouette. The corresponding methods are named elbow and silhouette methods, respectively.
  • Testing methods consists of comparing evidence against null hypothesis. An example is the gap statistic.


In addition to elbow, silhouette and gap statistic methods, there are more than thirty other indices and methods that have been published for identifying the optimal number of clusters. We’ll provide R codes for computing all these 30 indices in order to decide the best number of clusters using the “majority rule”.

For each of these methods:

  • We’ll describe the basic idea, the algorithm and the key mathematical concept
  • We’ll provide easy-o-use R codes with many examples for determining the optimal number of clusters and visualizing the output

1 Required packages

The following package will be used:

  • cluster for computing pam and for analyzing cluster silhouettes
  • factoextra for visualizing clusters using ggplot2 plotting system
  • NbClust for finding the optimal number of clusters

Install factoextra package as follow:

if(!require(devtools)) install.packages("devtools")
devtools::install_github("kassambara/factoextra")

The remaining packages can be installed using the code below:

pkgs <- c("cluster",  "NbClust")
install.packages(pkgs)

Load packages:

library(factoextra)
library(cluster)
library(NbClust)

2 Data preparation

The data set iris is used. We start by excluding the species column and scaling the data using the function scale():

# Load the data
data(iris)
head(iris)
##   Sepal.Length Sepal.Width Petal.Length Petal.Width Species
## 1          5.1         3.5          1.4         0.2  setosa
## 2          4.9         3.0          1.4         0.2  setosa
## 3          4.7         3.2          1.3         0.2  setosa
## 4          4.6         3.1          1.5         0.2  setosa
## 5          5.0         3.6          1.4         0.2  setosa
## 6          5.4         3.9          1.7         0.4  setosa
# Remove species column (5) and scale the data
iris.scaled <- scale(iris[, -5])

This iris data set gives the measurements in centimeters of the variables sepal length and width and petal length and width, respectively, for 50 flowers from each of 3 species of iris. The species are Iris setosa, versicolor, and virginica.

3 Example of partitioning method results

The functions kmeans() [in stats package] and pam() [in cluster package] are described in this section. We’ll split the data into 3 clusters as follow:

# K-means clustering
set.seed(123)
km.res <- kmeans(iris.scaled, 3, nstart = 25)
# k-means group number of each observation
km.res$cluster
##   [1] 1 1 1 1 1 1 1 1 1 1 1 1 1 1 1 1 1 1 1 1 1 1 1 1 1 1 1 1 1 1 1 1 1 1 1
##  [36] 1 1 1 1 1 1 1 1 1 1 1 1 1 1 1 2 2 2 3 3 3 2 3 3 3 3 3 3 3 3 2 3 3 3 3
##  [71] 2 3 3 3 3 2 2 2 3 3 3 3 3 3 3 2 2 3 3 3 3 3 3 3 3 3 3 3 3 3 2 3 2 2 2
## [106] 2 3 2 2 2 2 2 2 3 3 2 2 2 2 3 2 3 2 3 2 2 3 2 2 2 2 2 2 3 3 2 2 2 3 2
## [141] 2 2 3 2 2 2 3 2 2 3
# Visualize k-means clusters
fviz_cluster(km.res, data = iris.scaled, geom = "point",
             stand = FALSE, frame.type = "norm")

Optimal number of clusters - R data visualization

# PAM clustering
library("cluster")
pam.res <- pam(iris.scaled, 3)
pam.res$cluster
##   [1] 1 1 1 1 1 1 1 1 1 1 1 1 1 1 1 1 1 1 1 1 1 1 1 1 1 1 1 1 1 1 1 1 1 1 1
##  [36] 1 1 1 1 1 1 1 1 1 1 1 1 1 1 1 2 2 2 3 3 3 2 3 3 3 3 3 3 3 3 2 3 3 3 3
##  [71] 3 3 3 3 3 2 2 2 3 3 3 3 3 3 3 3 2 3 3 3 3 3 3 3 3 3 3 3 3 3 2 3 2 2 2
## [106] 2 3 2 2 2 2 2 2 3 2 2 2 2 2 3 2 3 2 3 2 2 3 3 2 2 2 2 2 3 3 2 2 2 3 2
## [141] 2 2 3 2 2 2 3 2 2 3
# Visualize pam clusters
fviz_cluster(pam.res, stand = FALSE, geom = "point",
             frame.type = "norm")

Optimal number of clusters - R data visualization

Read more about partitioning methods: Partitioning clustering

4 Example of hierarchical clustering results

The built-in R function hclust() is used:

# Compute pairewise distance matrices
dist.res <- dist(iris.scaled, method = "euclidean")
# Hierarchical clustering results
hc <- hclust(dist.res, method = "complete")
# Visualization of hclust
plot(hc, labels = FALSE, hang = -1)
# Add rectangle around 3 groups
rect.hclust(hc, k = 3, border = 2:4) 

Optimal number of clusters - R data visualization

# Cut into 3 groups
hc.cut <- cutree(hc, k = 3)
head(hc.cut, 20)
##  [1] 1 1 1 1 1 1 1 1 1 1 1 1 1 1 1 1 1 1 1 1

Read more about hierarchical clustering: Hierarchical clustering

6 NbClust: A Package providing 30 indices for determining the best number of clusters

6.1 Overview of NbClust package

As mentioned in the introduction of this article, many indices have been proposed in the literature for determining the optimal number of clusters in a partitioning of a data set during the clustering process.

NbClust package, published by Charrad et al., 2014, provides 30 indices for determining the relevant number of clusters and proposes to users the best clustering scheme from the different results obtained by varying all combinations of number of clusters, distance measures, and clustering methods.

An important advantage of NbClust is that the user can simultaneously computes multiple indices and determine the number of clusters in a single function call.

The indices provided in NbClust package includes the gap statistic, the silhouette method and 28 other indices described comprehensively in the original paper of Charrad et al., 2014.

6.2 NbClust R function

The simplified format of the function NbClust() is:

NbClust(data = NULL, diss = NULL, distance = "euclidean",
        min.nc = 2, max.nc = 15, method = NULL, index = "all")

  • data: matrix
  • diss: dissimilarity matrix to be used. By default, diss=NULL, but if it is replaced by a dissimilarity matrix, distance should be “NULL”
  • distance: the distance measure to be used to compute the dissimilarity matrix. Possible values include “euclidean”, “manhattan” or “NULL”.
  • min.nc, max.nc: minimal and maximal number of clusters, respectively
  • method: The cluster analysis method to be used including “ward.D”, “ward.D2”, “single”, “complete”, “average” and more
  • index: the index to be calculated including “silhouette”, “gap” and more.


The value of NbClust() function includes the following elements:

  • All.index: Values of indices for each partition of the dataset obtained with a number of clusters between min.nc and max.nc
  • All.CriticalValues: Critical values of some indices for each partition obtained with a number of clusters between min.nc and max.nc
  • Best.nc: Best number of clusters proposed by each index and the corresponding index value
  • Best.partition: Partition that corresponds to the best number of clusters

6.3 Examples of usage

Note that, user can request indices one by one, by setting the argument index to the name of the index of interest, for example index = “gap”.

In this case, NbClust function displays:

  • the gap statistic values of the partitions obtained with number of clusters varying from min.nc to max.nc ($All.index)
  • the optimal number of clusters ($Best.nc)
  • and the partition corresponding to the best number of clusters ($Best.partition)

6.3.1 Compute only an index of interest

The following example determine the number of clusters using gap statistics:

library("NbClust")
set.seed(123)
res.nb <- NbClust(iris.scaled, distance = "euclidean",
                  min.nc = 2, max.nc = 10, 
                  method = "complete", index ="gap") 
res.nb # print the results
## $All.index
##       2       3       4       5       6       7       8       9      10 
## -0.2899 -0.2303 -0.6915 -0.8606 -1.0506 -1.3223 -1.3303 -1.4759 -1.5551 
## 
## $All.CriticalValues
##       2       3       4       5       6       7       8       9      10 
## -0.0539  0.4694  0.1787  0.2009  0.2848  0.0230  0.1631  0.0988  0.1708 
## 
## $Best.nc
## Number_clusters     Value_Index 
##          3.0000         -0.2303 
## 
## $Best.partition
##   [1] 1 1 1 1 1 1 1 1 1 1 1 1 1 1 1 1 1 1 1 1 1 1 1 1 1 1 1 1 1 1 1 1 1 1 1
##  [36] 1 1 1 1 1 1 2 1 1 1 1 1 1 1 1 3 3 3 2 3 2 3 2 3 2 2 3 2 3 3 3 3 2 2 2
##  [71] 3 3 3 3 3 3 3 3 3 2 2 2 2 3 3 3 3 2 3 2 2 3 2 2 2 3 3 3 2 2 3 3 3 3 3
## [106] 3 2 3 3 3 3 3 3 3 3 3 3 3 3 2 3 3 3 3 3 3 3 3 3 3 3 3 3 3 3 3 3 3 3 3
## [141] 3 3 3 3 3 3 3 3 3 3

The elements returned by the function NbClust() are accessible using the R code below:

# All gap statistic values
res.nb$All.index

# Best number of clusters
res.nb$Best.nc

# Best partition
res.nb$Best.partition

6.3.2 Compute all the 30 indices

The following example compute all the 30 indices, in a single function call, for determining the number of clusters and suggests to user the best clustering scheme. The description of the indices are available in NbClust documentation (see ?NbClust).

To compute multiple indices simultaneously, the possible values for the argument index can be i) “alllong” or ii) “all”. The option “alllong” requires more time, as the run of some indices, such as Gamma, Tau, Gap and Gplus, is computationally very expensive. The user can avoid computing these four indices by setting the argument index to “all”. In this case, only 26 indices are calculated.

With the “alllong” option, the output of the NbClust function contains:


  • all validation indices
  • critical values for Duda, Gap, PseudoT2 and Beale indices
  • the number of clusters corresponding to the optimal score for each indice
  • the best number of clusters proposed by NbClust according to the majority rule
  • the best partition


The R code below computes NbClust() with index = “all”:

nb <- NbClust(iris.scaled, distance = "euclidean", min.nc = 2,
        max.nc = 10, method = "complete", index ="all")
# Print the result
nb

It’s possible to visualize the result using the function fviz_nbclust() [in factoextra], as follow:

fviz_nbclust(nb) + theme_minimal()
## Among all indices: 
## ===================
## * 2 proposed  0 as the best number of clusters
## * 1 proposed  1 as the best number of clusters
## * 2 proposed  2 as the best number of clusters
## * 18 proposed  3 as the best number of clusters
## * 3 proposed  10 as the best number of clusters
## 
## Conclusion
## =========================
## * Accoridng to the majority rule, the best number of clusters is  3 .

Optimal number of clusters - R data visualization


  • ….
  • 2 proposed 2 as the best number of clusters
  • 18 indices proposed 3 as the best number of clusters.
  • 3 proposed 10 as the best number of clusters
According to the majority rule, the best number of clusters is 3


7 Infos

This analysis has been performed using R software (ver. 3.2.1)

  • Charrad M., Ghazzali N., Boiteau V., Niknafs A. (2014). NbClust: An R Package for Determining the Relevant Number of Clusters in a Data Set. Journal of Statistical Software, 61(6), 1-36.
  • Kaufman, L. and Rousseeuw, P.J. (1990). Finding Groups in Data: An Introduction to Cluster Analysis. Wiley, New York.
  • Tibshirani, R., Walther, G. and Hastie, T. (2001). Estimating the number of data clusters via the Gap statistic. Journal of the Royal Statistical Society B, 63, 411–423. PDF

Hybrid hierarchical k-means clustering for optimizing clustering outputs - Unsupervised Machine Learning

$
0
0


Clustering algorithms are used to split a dataset into several groups (i.e clusters), so that the objects in the same group are as similar as possible and the objects in different groups are as dissimilar as possible.

The most popular clustering algorithms are:

However, each of these two standard clustering methods has its limitations. K-means clustering requires the user to specify the number of clusters in advance and selects initial centroids randomly. Agglomerative hierarchical clustering is good at identifying small clusters but not large ones.

In this article, we document hybrid approaches for easily mixing the best of k-means clustering and hierarchical clustering.

1 How this article is organized

We’ll start by demonstrating why we should combine k-means and hierarcical clustering. An application is provided using R software.

Finally, we’ll provide an easy to use R function (in factoextra package) for computing hybrid hierachical k-means clustering.

2 Required R packages

We’ll use the R package factoextra which is very helpful for simplifying clustering workflows and for visualizing clusters using ggplot2 plotting system

Install factoextra package as follow:

if(!require(devtools)) install.packages("devtools")
devtools::install_github("kassambara/factoextra")

Load the package:

library(factoextra)

3 Data preparation

We’ll use USArrest dataset and we start by scaling the data:

# Load the data
data(USArrests)
# Scale the data
df <- scale(USArrests)
head(df)
##                Murder   Assault   UrbanPop         Rape
## Alabama    1.24256408 0.7828393 -0.5209066 -0.003416473
## Alaska     0.50786248 1.1068225 -1.2117642  2.484202941
## Arizona    0.07163341 1.4788032  0.9989801  1.042878388
## Arkansas   0.23234938 0.2308680 -1.0735927 -0.184916602
## California 0.27826823 1.2628144  1.7589234  2.067820292
## Colorado   0.02571456 0.3988593  0.8608085  1.864967207

If you want to understand why the data are scaled before the analysis, then you should read this section: Distances and scaling.

4 R function for clustering analyses

We’ll use the function eclust() [in factoextra] which provides several advantages as described in the previous chapter: Visual Enhancement of Clustering Analysis.

eclust() stands for enhanced clustering. It simplifies the workflow of clustering analysis and, it can be used for computing hierarchical clustering and partititioning clustering in a single line function call.

4.1 Example of k-means clustering

We’ll split the data into 4 clusters using k-means clustering as follow:

library("factoextra")
# K-means clustering
km.res <- eclust(df, "kmeans", k = 4,
                 nstart = 25, graph = FALSE)
# k-means group number of each observation
head(km.res$cluster, 15)
##     Alabama      Alaska     Arizona    Arkansas  California    Colorado 
##           4           3           3           4           3           3 
## Connecticut    Delaware     Florida     Georgia      Hawaii       Idaho 
##           2           2           3           4           2           1 
##    Illinois     Indiana        Iowa 
##           3           2           1
# Visualize k-means clusters
fviz_cluster(km.res,  frame.type = "norm", frame.level = 0.68)

Clustering on principal component - Unsupervised Machine Learning

# Visualize the silhouette of clusters
fviz_silhouette(km.res)
##   cluster size ave.sil.width
## 1       1   13          0.37
## 2       2   16          0.34
## 3       3   13          0.27
## 4       4    8          0.39

Clustering on principal component - Unsupervised Machine Learning

Note that, silhouette coefficient measures how well an observation is clustered and it estimates the average distance between clusters (i.e, the average silhouette width). Observations with negative silhouette are probably placed in the wrong cluster. Read more here: cluster validation statistics

Samples with negative silhouette coefficient:

# Silhouette width of observation
sil <- km.res$silinfo$widths[, 1:3]
# Objects with negative silhouette
neg_sil_index <- which(sil[, 'sil_width'] < 0)
sil[neg_sil_index, , drop = FALSE]
##          cluster neighbor   sil_width
## Missouri       3        2 -0.07318144

Read more about k-means clustering: K-means clustering

4.2 Example of hierarchical clustering

# Enhanced hierarchical clustering
res.hc <- eclust(df, "hclust", k = 4,
                method = "ward.D2", graph = FALSE) 
head(res.hc$cluster, 15)
##     Alabama      Alaska     Arizona    Arkansas  California    Colorado 
##           1           2           2           3           2           2 
## Connecticut    Delaware     Florida     Georgia      Hawaii       Idaho 
##           4           3           2           1           3           4 
##    Illinois     Indiana        Iowa 
##           2           3           4
# Dendrogram
fviz_dend(res.hc, rect = TRUE, show_labels = TRUE, cex = 0.5) 

Clustering on principal component - Unsupervised Machine Learning

# Visualize the silhouette of clusters
fviz_silhouette(res.hc)
##   cluster size ave.sil.width
## 1       1    7          0.40
## 2       2   12          0.26
## 3       3   18          0.38
## 4       4   13          0.35

Clustering on principal component - Unsupervised Machine Learning

It can be seen that three samples have negative silhouette coefficient indicating that they are not in the right cluster. These samples are:

# Silhouette width of observation
sil <- res.hc$silinfo$widths[, 1:3]
# Objects with negative silhouette
neg_sil_index <- which(sil[, 'sil_width'] < 0)
sil[neg_sil_index, , drop = FALSE]
##             cluster neighbor    sil_width
## Alaska            2        1 -0.005212336
## Nebraska          4        3 -0.044172624
## Connecticut       4        3 -0.078016589

Read more about hierarchical clustering: Hierarchical clustering

5 Combining hierarchical clustering and k-means

5.1 Why?

Recall that, in k-means algorithm, a random set of observations are chosen as the initial centers.

The final k-means clustering solution is very sensitive to this initial random selection of cluster centers. The result might be (slightly) different each time you compute k-means.

To avoid this, a solution is to use an hybrid approach by combining the hierarchical clustering and the k-means methods. This process is named hybrid hierarchical k-means clustering (hkmeans).

5.2 How ?

The procedure is as follow:

  1. Compute hierarchical clustering and cut the tree into k-clusters
  2. compute the center (i.e the mean) of each cluster
  3. Compute k-means by using the set of cluster centers (defined in step 3) as the initial cluster centers

Note that, k-means algorithm will improve the initial partitioning generated at the step 2 of the algorithm. Hence, the initial partitioning can be slightly different from the final partitioning obtained in the step 4.

5.3 R codes

5.3.1 Compute hierarchical clustering and cut the tree into k-clusters:

res.hc <- eclust(df, "hclust", k = 4,
                method = "ward.D2", graph = FALSE) 
grp <- res.hc$cluster

5.3.2 Compute the centers of clusters defined by hierarchical clustering:

Cluster centers are defined as the means of variables in clusters. The function aggregate() can be used to compute the mean per group in a data frame.

# Compute cluster centers
clus.centers <- aggregate(df, list(grp), mean)
clus.centers
##   Group.1     Murder    Assault   UrbanPop        Rape
## 1       1  1.5803956  0.9662584 -0.7775109  0.04844071
## 2       2  0.7298036  1.1188219  0.7571799  1.32135653
## 3       3 -0.3250544 -0.3231032  0.3733701 -0.17068130
## 4       4 -1.0745717 -1.1056780 -0.7972496 -1.00946922
# Remove the first column
clus.centers <- clus.centers[, -1]
clus.centers
##       Murder    Assault   UrbanPop        Rape
## 1  1.5803956  0.9662584 -0.7775109  0.04844071
## 2  0.7298036  1.1188219  0.7571799  1.32135653
## 3 -0.3250544 -0.3231032  0.3733701 -0.17068130
## 4 -1.0745717 -1.1056780 -0.7972496 -1.00946922

5.3.3 K-means clustering using hierarchical clustering defined cluster-centers

km.res2 <- eclust(df, "kmeans", k = clus.centers, graph = FALSE)
fviz_silhouette(km.res2)
##   cluster size ave.sil.width
## 1       1    8          0.39
## 2       2   13          0.27
## 3       3   16          0.34
## 4       4   13          0.37

Clustering on principal component - Unsupervised Machine Learning

5.3.4 Compare the results of hierarchical clustering and hybrid approach

The R code below compares the initial clusters defined using only hierarchical clustering and the final ones defined using hierarchical clustering + k-means:

# res.hc$cluster: Initial clusters defined using hierarchical clustering
# km.res2$cluster: Final clusters defined using k-means
table(km.res2$cluster, res.hc$cluster)
##    
##      1  2  3  4
##   1  7  0  1  0
##   2  0 12  1  0
##   3  0  0 15  1
##   4  0  0  1 12

It can be seen that, 3 of the observations defined as belonging to cluster 3 by hierarchical clustering has been reclassified to cluster 1, 2, and 4 in the final solution defined by k-means clustering.

The difference can be easily visualized using the function fviz_dend() [in factoextra]. The labels are colored using k-means clusters:

fviz_dend(res.hc, k = 4, 
          k_colors = c("blue", "green3", "red", "black"),
          label_cols =  km.res$cluster[res.hc$order], cex = 0.6)

Clustering on principal component - Unsupervised Machine Learning

It can be seen that the hierarchical clustering result has been improved by the k-means algorithm.

5.3.5 Compare the results of standard k-means clustering and hybrid approach

# Final clusters defined using hierarchical k-means clustering
km.clust <- km.res$cluster

# Standard k-means clustering
set.seed(123)
res.km <- kmeans(df, centers = 4, iter.max = 100)


# comparison
table(km.clust, res.km$cluster)
##         
## km.clust  1  2  3  4
##        1 13  0  0  0
##        2  0 16  0  0
##        3  0  0 13  0
##        4  0  0  0  8

In our current example, there was no further improvement of the k-means clustering result by the hybrid approach. An improvement might be observed using another dataset.

5.4 hkmeans(): Easy-to-use function for hybrid hierarchical k-means clustering

The function hkmeans() [in factoextra] can be used to compute easily the hybrid approach of k-means on hierarchical clustering. The format of the result is similar to the one provided by the standard kmeans() function.

# Compute hierarchical k-means clustering
res.hk <-hkmeans(df, 4)
# Elements returned by hkmeans()
names(res.hk)
##  [1] "cluster"      "centers"      "totss"        "withinss"    
##  [5] "tot.withinss" "betweenss"    "size"         "iter"        
##  [9] "ifault"       "data"         "hclust"
# Print the results
res.hk
## Hierarchical K-means clustering with 4 clusters of sizes 8, 13, 16, 13
## 
## Cluster means:
##       Murder    Assault   UrbanPop        Rape
## 1  1.4118898  0.8743346 -0.8145211  0.01927104
## 2  0.6950701  1.0394414  0.7226370  1.27693964
## 3 -0.4894375 -0.3826001  0.5758298 -0.26165379
## 4 -0.9615407 -1.1066010 -0.9301069 -0.96676331
## 
## Clustering vector:
##        Alabama         Alaska        Arizona       Arkansas     California 
##              1              2              2              1              2 
##       Colorado    Connecticut       Delaware        Florida        Georgia 
##              2              3              3              2              1 
##         Hawaii          Idaho       Illinois        Indiana           Iowa 
##              3              4              2              3              4 
##         Kansas       Kentucky      Louisiana          Maine       Maryland 
##              3              4              1              4              2 
##  Massachusetts       Michigan      Minnesota    Mississippi       Missouri 
##              3              2              4              1              2 
##        Montana       Nebraska         Nevada  New Hampshire     New Jersey 
##              4              4              2              4              3 
##     New Mexico       New York North Carolina   North Dakota           Ohio 
##              2              2              1              4              3 
##       Oklahoma         Oregon   Pennsylvania   Rhode Island South Carolina 
##              3              3              3              3              1 
##   South Dakota      Tennessee          Texas           Utah        Vermont 
##              4              1              2              3              4 
##       Virginia     Washington  West Virginia      Wisconsin        Wyoming 
##              3              3              4              4              3 
## 
## Within cluster sum of squares by cluster:
## [1]  8.316061 19.922437 16.212213 11.952463
##  (between_SS / total_SS =  71.2 %)
## 
## Available components:
## 
##  [1] "cluster"      "centers"      "totss"        "withinss"    
##  [5] "tot.withinss" "betweenss"    "size"         "iter"        
##  [9] "ifault"       "data"         "hclust"
# Visualize the tree
fviz_dend(res.hk, cex = 0.6, rect = TRUE)

Clustering on principal component - Unsupervised Machine Learning

# Visualize the hkmeans final clusters
fviz_cluster(res.hk, frame.type = "norm", frame.level = 0.68)

Clustering on principal component - Unsupervised Machine Learning

6 Infos

This analysis has been performed using R software (ver. 3.2.1)

ggplot2 axis scales and transformations

$
0
0


This R tutorial describes how to modify x and y axis limits (minimum and maximum values) using ggplot2 package. Axis transformations (log scale, sqrt, …) and date axis are also covered in this article.

Prepare the data

ToothGrowth data is used in the following examples :

# Convert dose column dose from a numeric to a factor variable
ToothGrowth$dose <- as.factor(ToothGrowth$dose)
head(ToothGrowth)
##    len supp dose
## 1  4.2   VC  0.5
## 2 11.5   VC  0.5
## 3  7.3   VC  0.5
## 4  5.8   VC  0.5
## 5  6.4   VC  0.5
## 6 10.0   VC  0.5

Make sure that dose column is converted as a factor using the above R script.

Example of plots

library(ggplot2)
# Box plot 
bp <- ggplot(ToothGrowth, aes(x=dose, y=len)) + geom_boxplot()
bp

# scatter plot
sp<-ggplot(cars, aes(x = speed, y = dist)) + geom_point()
sp

ggplot2 axis scale, R programmingggplot2 axis scale, R programming

Change x and y axis limits

There are different functions to set axis limits :

  • xlim() and ylim()
  • expand_limits()
  • scale_x_continuous() and scale_y_continuous()

Use xlim() and ylim() functions

To change the range of a continuous axis, the functions xlim() and ylim() can be used as follow :

# x axis limits
sp + xlim(min, max)

# y axis limits
sp + ylim(min, max)

min and max are the minimum and the maximum values of each axis.

# Box plot : change y axis range
bp + ylim(0,50)

# scatter plots : change x and y limits
sp + xlim(5, 40)+ylim(0, 150)

ggplot2 axis scale, R programmingggplot2 axis scale, R programming

Use expand_limts() function

Note that, the function expand_limits() can be used to :

  • quickly set the intercept of x and y axes at (0,0)
  • change the limits of x and y axes
# set the intercept of x and y axis at (0,0)
sp + expand_limits(x=0, y=0)

# change the axis limits
sp + expand_limits(x=c(0,30), y=c(0, 150))

ggplot2 axis scale, R programmingggplot2 axis scale, R programming

Use scale_xx() functions

It is also possible to use the functions scale_x_continuous() and scale_y_continuous() to change x and y axis limits, respectively.

The simplified formats of the functions are :

scale_x_continuous(name, breaks, labels, limits, trans)

scale_y_continuous(name, breaks, labels, limits, trans)

  • name : x or y axis labels
  • breaks : to control the breaks in the guide (axis ticks, grid lines, …). Among the possible values, there are :
    • NULL : hide all breaks
    • waiver() : the default break computation
    • a character or numeric vector specifying the breaks to display
  • labels : labels of axis tick marks. Allowed values are :
    • NULL for no labels
    • waiver() for the default labels
    • character vector to be used for break labels
  • limits : a numeric vector specifying x or y axis limits (min, max)
  • trans for axis transformations. Possible values are “log2”, “log10”, …


The functions scale_x_continuous() and scale_y_continuous() can be used as follow :

# Change x and y axis labels, and limits
sp + scale_x_continuous(name="Speed of cars", limits=c(0, 30)) +
  scale_y_continuous(name="Stopping distance", limits=c(0, 150))

ggplot2 axis scale, R programming

Axis transformations

Log and sqrt transformations

Built in functions for axis transformations are :

  • scale_x_log10(), scale_y_log10() : for log10 transformation
  • scale_x_sqrt(), scale_y_sqrt() : for sqrt transformation
  • scale_x_reverse(), scale_y_reverse() : to reverse coordinates
  • coord_trans(x =“log10”, y=“log10”) : possible values for x and y are “log2”, “log10”, “sqrt”, …
  • scale_x_continuous(trans=‘log2’), scale_y_continuous(trans=‘log2’) : another allowed value for the argument trans is ‘log10’

These functions can be used as follow :

# Default scatter plot
sp <- ggplot(cars, aes(x = speed, y = dist)) + geom_point()
sp

# Log transformation using scale_xx()
# possible values for trans : 'log2', 'log10','sqrt'
sp + scale_x_continuous(trans='log2') +
  scale_y_continuous(trans='log2')

# Sqrt transformation
sp + scale_y_sqrt()

# Reverse coordinates
sp + scale_y_reverse() 

ggplot2 axis scale, R programmingggplot2 axis scale, R programmingggplot2 axis scale, R programmingggplot2 axis scale, R programming

The function coord_trans() can be used also for the axis transformation

# Possible values for x and y : "log2", "log10", "sqrt", ...
sp + coord_trans(x="log2", y="log2")

ggplot2 axis scale, R programming

Format axis tick mark labels

Axis tick marks can be set to show exponents. The scales package is required to access break formatting functions.

# Log2 scaling of the y axis (with visually-equal spacing)
library(scales)
sp + scale_y_continuous(trans = log2_trans())

# show exponents
sp + scale_y_continuous(trans = log2_trans(),
    breaks = trans_breaks("log2", function(x) 2^x),
    labels = trans_format("log2", math_format(2^.x)))

ggplot2 axis scale, R programmingggplot2 axis scale, R programming

Note that many transformation functions are available using the scales package : log10_trans(), sqrt_trans(), etc. Use help(trans_new) for a full list.

Format axis tick mark labels :

library(scales)
# Percent
sp + scale_y_continuous(labels = percent)

# dollar
sp + scale_y_continuous(labels = dollar)

# scientific
sp + scale_y_continuous(labels = scientific)

ggplot2 axis scale, R programmingggplot2 axis scale, R programmingggplot2 axis scale, R programming

Display log tick marks

It is possible to add log tick marks using the function annotation_logticks().

Note that, these tick marks make sense only for base 10

The Animals data sets, from the package MASS, are used :

library(MASS)
head(Animals)
##                     body brain
## Mountain beaver     1.35   8.1
## Cow               465.00 423.0
## Grey wolf          36.33 119.5
## Goat               27.66 115.0
## Guinea pig          1.04   5.5
## Dipliodocus     11700.00  50.0

The function annotation_logticks() can be used as follow :

library(MASS) # to access Animals data sets
library(scales) # to access break formatting functions
# x and y axis are transformed and formatted
p2 <- ggplot(Animals, aes(x = body, y = brain)) + geom_point() +
     scale_x_log10(breaks = trans_breaks("log10", function(x) 10^x),
              labels = trans_format("log10", math_format(10^.x))) +
     scale_y_log10(breaks = trans_breaks("log10", function(x) 10^x),
              labels = trans_format("log10", math_format(10^.x))) +
     theme_bw()
# log-log plot without log tick marks
p2

# Show log tick marks
p2 + annotation_logticks()  

ggplot2 axis scale, R programmingggplot2 axis scale, R programming

Note that, default log ticks are on bottom and left.

To specify the sides of the log ticks :

# Log ticks on left and right
p2 + annotation_logticks(sides="lr")

# All sides
p2+annotation_logticks(sides="trbl")

Allowed values for the argument sides are :

  • t : for top
  • r : for right
  • b : for bottom
  • l : for left
  • the combination of t, r, b and l

Format date axes

The functions scale_x_date() and scale_y_date() are used.

Example of data

Create some time serie data

df <- data.frame(
  date = seq(Sys.Date(), len=100, by="1 day")[sample(100, 50)],
  price = runif(50)
)
df <- df[order(df$date), ]
head(df)
##          date      price
## 15 2015-01-31 0.34336462
## 42 2015-02-01 0.13820774
## 7  2015-02-02 0.01554777
## 44 2015-02-03 0.27000225
## 10 2015-02-04 0.29162466
## 26 2015-02-06 0.58560998

Plot with dates

# Plot with date
dp <- ggplot(data=df, aes(x=date, y=price)) + geom_line()
dp

ggplot2 axis scale, R programming

Format axis tick mark labels

Load the package scales to access break formatting functions.

library(scales)
# Format : month/day
dp + scale_x_date(labels = date_format("%m/%d")) +
  theme(axis.text.x = element_text(angle=45))

# Format : Week
dp + scale_x_date(labels = date_format("%W"))

# Months only
dp + scale_x_date(breaks = date_breaks("months"),
  labels = date_format("%b"))

ggplot2 axis scale, R programmingggplot2 axis scale, R programmingggplot2 axis scale, R programming

Date axis limits

US economic time series data sets (from ggplot2 package) are used :

head(economics)
##         date   pce    pop psavert uempmed unemploy
## 1 1967-06-30 507.8 198712     9.8     4.5     2944
## 2 1967-07-31 510.9 198911     9.8     4.7     2945
## 3 1967-08-31 516.7 199113     9.0     4.6     2958
## 4 1967-09-30 513.3 199311     9.8     4.9     3143
## 5 1967-10-31 518.5 199498     9.7     4.7     3066
## 6 1967-11-30 526.2 199657     9.4     4.8     3018

Create the plot of psavert by date :

  • date : Month of data collection
  • psavert : personal savings rate
# Plot with dates
dp <- ggplot(data=economics, aes(x=date, y=psavert)) + geom_line()
dp

# Axis limits c(min, max)
min <- as.Date("2002-1-1")
max <- max(economics$date)
dp+ scale_x_date(limits = c(min, max))

ggplot2 axis scale, R programmingggplot2 axis scale, R programming

Go further

See also the function scale_x_datetime() and scale_y_datetime() to plot a data containing date and time.

Infos

This analysis has been performed using R software (ver. 3.1.2) and ggplot2 (ver. )

ggplot2 colors : How to change colors automatically and manually?

$
0
0


The goal of this article is to describe how to change the color of a graph generated using R software and ggplot2 package. A color can be specified either by name (e.g.: “red”) or by hexadecimal code (e.g. : “#FF1234”). The different color systems available in R are described at this link : colors in R.

In this R tutorial, you will learn how to :

  • change colors by groups (automatically and manually)
  • use RColorBrewer and Wes Anderson color palettes
  • use gradient colors

ggplot2 color, graph, R software

Prepare the data

ToothGrowth and mtcars data sets are used in the examples below.

# Convert dose and cyl columns from numeric to factor variables
ToothGrowth$dose <- as.factor(ToothGrowth$dose)
mtcars$cyl <- as.factor(mtcars$cyl)
head(ToothGrowth)
##    len supp dose
## 1  4.2   VC  0.5
## 2 11.5   VC  0.5
## 3  7.3   VC  0.5
## 4  5.8   VC  0.5
## 5  6.4   VC  0.5
## 6 10.0   VC  0.5
head(mtcars)
##                    mpg cyl disp  hp drat    wt  qsec vs am gear carb
## Mazda RX4         21.0   6  160 110 3.90 2.620 16.46  0  1    4    4
## Mazda RX4 Wag     21.0   6  160 110 3.90 2.875 17.02  0  1    4    4
## Datsun 710        22.8   4  108  93 3.85 2.320 18.61  1  1    4    1
## Hornet 4 Drive    21.4   6  258 110 3.08 3.215 19.44  1  0    3    1
## Hornet Sportabout 18.7   8  360 175 3.15 3.440 17.02  0  0    3    2
## Valiant           18.1   6  225 105 2.76 3.460 20.22  1  0    3    1

Make sure that the columns dose and cyl are converted as factor variables using the R script above.

Simple plots

library(ggplot2)
# Box plot
ggplot(ToothGrowth, aes(x=dose, y=len)) +geom_boxplot()

# scatter plot
ggplot(mtcars, aes(x=wt, y=mpg)) + geom_point()

ggplot2 color, graph, R softwareggplot2 color, graph, R software

Use a single color

# box plot
ggplot(ToothGrowth, aes(x=dose, y=len)) +
  geom_boxplot(fill='#A4A4A4', color="darkred")

# scatter plot
ggplot(mtcars, aes(x=wt, y=mpg)) + 
  geom_point(color='darkblue')

ggplot2 color, graph, R softwareggplot2 color, graph, R software

Change colors by groups

Default colors

The following R code changes the color of the graph by the levels of dose :

# Box plot
bp<-ggplot(ToothGrowth, aes(x=dose, y=len, fill=dose)) +
  geom_boxplot()
bp

# Scatter plot
sp<-ggplot(mtcars, aes(x=wt, y=mpg, color=cyl)) + geom_point()
sp

ggplot2 color, graph, R softwareggplot2 color, graph, R software

The lightness (l) and the chroma (c, intensity of color) of the default (hue) colors can be modified using the functions scale_hue as follow :

# Box plot
bp + scale_fill_hue(l=40, c=35)

# Scatter plot
sp + scale_color_hue(l=40, c=35)

ggplot2 color, graph, R softwareggplot2 color, graph, R software

Note that, the default values for l and c are : l = 65, c = 100.

Change colors manually

A custom color palettes can be specified using the functions :

  • scale_fill_manual() for box plot, bar plot, violin plot, etc
  • scale_color_manual() for lines and points
# Box plot
bp + scale_fill_manual(values=c("#999999", "#E69F00", "#56B4E9"))

# Scatter plot
sp + scale_color_manual(values=c("#999999", "#E69F00", "#56B4E9"))

ggplot2 color, graph, R softwareggplot2 color, graph, R software

Note that, the argument breaks can be used to control the appearance of the legend. This holds true also for the other scale_xx() functions.

# Box plot
bp + scale_fill_manual(breaks = c("2", "1", "0.5"), 
                       values=c("red", "blue", "green"))

# Scatter plot
sp + scale_color_manual(breaks = c("8", "6", "4"),
                        values=c("red", "blue", "green"))

ggplot2 color, graph, R softwareggplot2 color, graph, R software

The built-in color names and a color code chart are described here : color in R.

Use RColorBrewer palettes

The color palettes available in the RColorBrewer package are described here : color in R.

# Box plot
bp + scale_fill_brewer(palette="Dark2")

# Scatter plot
sp + scale_color_brewer(palette="Dark2")

ggplot2 color, graph, R softwareggplot2 color, graph, R software

The available color palettes in the RColorBrewer package are :

RColorBrewer palettes

Use Wes Anderson color palettes

Install and load the color palettes as follow :

# Install
install.packages("wesanderson")
# Load
library(wesanderson)

The available color palettes are :

wesanderson-color palettes

library(wesanderson)
# Box plot
bp+scale_fill_manual(values=wes_palette(n=3, name="GrandBudapest"))

# Scatter plot
sp+scale_color_manual(values=wes_palette(n=3, name="GrandBudapest"))

ggplot2 color, graph, R softwareggplot2 color, graph, R software

Use gray colors

The functions to use are :

  • scale_colour_grey() for points, lines, etc
  • scale_fill_grey() for box plot, bar plot, violin plot, etc
# Box plot
bp + scale_fill_grey() + theme_classic()

# Scatter plot
sp + scale_color_grey() + theme_classic()

ggplot2 color, graph, R softwareggplot2 color, graph, R software

Change the gray value at the low and the high ends of the palette :

# Box plot
bp + scale_fill_grey(start=0.8, end=0.2) + theme_classic()

# Scatter plot
sp + scale_color_grey(start=0.8, end=0.2) + theme_classic()

ggplot2 color, graph, R softwareggplot2 color, graph, R software

Note that, the default value for the arguments start and end are : start = 0.2, end = 0.8

Continuous colors

The graph can be colored according to the values of a continuous variable using the functions :

  • scale_color_gradient(), scale_fill_gradient() for sequential gradients between two colors
  • scale_color_gradient2(), scale_fill_gradient2() for diverging gradients
  • scale_color_gradientn(), scale_fill_gradientn() for gradient between n colors

Gradient colors for scatter plots

The graphs are colored using the qsec continuous variable :

# Color by qsec values
sp2<-ggplot(mtcars, aes(x=wt, y=mpg, color=qsec)) + geom_point()
sp2

# Change the low and high colors
# Sequential color scheme
sp2+scale_color_gradient(low="blue", high="red")

# Diverging color scheme
mid<-mean(mtcars$qsec)
sp2+scale_color_gradient2(midpoint=mid, low="blue", mid="white",
                     high="red", space ="Lab" )

ggplot2 color, graph, R softwareggplot2 color, graph, R softwareggplot2 color, graph, R software

Gradient colors for histogram plots

set.seed(1234)
x <- rnorm(200)
# Histogram
hp<-qplot(x =x, fill=..count.., geom="histogram") 
hp

# Sequential color scheme
hp+scale_fill_gradient(low="blue", high="red")

ggplot2 color, graph, R softwareggplot2 color, graph, R software

Note that, the functions scale_color_continuous() and scale_fill_continuous() can be used also to set gradient colors.

Gradient between n colors

# Scatter plot
# Color points by the mpg variable
sp3<-ggplot(mtcars, aes(x=wt, y=mpg, color=mpg)) + geom_point()
sp3

# Gradient between n colors
sp3+scale_color_gradientn(colours = rainbow(5))

ggplot2 color, graph, R softwareggplot2 color, graph, R software

Infos

This analysis has been performed using R software (ver. 3.1.2) and ggplot2 (ver. 1.0.0)

ggplot2 texts : Add text annotations to a graph in R software

$
0
0


To add a text to a plot generated using ggplot2, the functions below can be used :

  • geom_text()
  • annotate()
  • annotation_custom()

Create some data

df <- data.frame(x=1:3, y=1:3, 
               name=c("Text1", "Text with \n 2 lines", "Text3"))
head(df)
##   x y                 name
## 1 1 1                Text1
## 2 2 2 Text with \n 2 lines
## 3 3 3                Text3

Text annotations using the function geom_text

library(ggplot2)

# Simple scatter plot
sp <- ggplot(data = df, aes(x, y, label=name)) +
  geom_point()+xlim(0,3.5)+ylim(0,3.5)

# Add texts
sp + geom_text()

# Change the size of the texts
sp + geom_text(size=6)

# Change vertical and horizontal adjustement
sp +  geom_text(hjust=0, vjust=0)

# Change fontface. Allowed values : 1(normal),
# 2(bold), 3(italic), 4(bold.italic)
sp + geom_text(aes(fontface=2))

ggplot2 add texts to a graph in Rggplot2 add texts to a graph in Rggplot2 add texts to a graph in Rggplot2 add texts to a graph in R

Change the text color and size by groups

It’s possible to change the appearance of the texts using aesthetics (color, size,…) :

sp2 <- ggplot(mtcars, aes(x=wt, y=mpg, label=rownames(mtcars)))+
  geom_point()

# Color by groups
sp2 + geom_text(aes(color=factor(cyl)))

ggplot2 add texts to a graph in R

# Set the size of the text using a continuous variable
sp2 + geom_text(aes(size=wt))

ggplot2 add texts to a graph in R

sp2 + geom_text(aes(size=wt)) + scale_size(range=c(3,6))

ggplot2 add texts to a graph in R

Add a text annotation at a particular coordinate

The functions geom_text() and annotate() can be used :

# Solution 1
sp2 + geom_text(x=3, y=30, label="Scatter plot")

# Solution 2
sp2 + annotate(geom="text", x=3, y=30, label="Scatter plot",
              color="red")

ggplot2 add texts to a graph in Rggplot2 add texts to a graph in R

annotation_custom : Add a static text annotation in the top-right, top-left, …

The functions annotation_custom() and textGrob() are used to add static annotations which are the same in every panel.The grid package is required :

library(grid)
# Create a text
grob <- grobTree(textGrob("Scatter plot", x=0.1,  y=0.95, hjust=0,
  gp=gpar(col="red", fontsize=13, fontface="italic")))
# Plot
sp2 + annotation_custom(grob)

ggplot2 add texts to a graph in R

Facet : In the plot below, the annotation is at the same place (in each facet) even if the axis scales vary.

sp2 + annotation_custom(grob)+facet_wrap(~cyl, scales="free")

ggplot2 add texts to a graph in R

Infos

This analysis has been performed using R software (ver. 3.1.2) and ggplot2 (ver. )

GGally R package: Extension to ggplot2 for correlation matrix and survival plots - R software and data visualization

$
0
0


GGally extends ggplot2 by providing several functions including:

  • ggcor(): for pairwise correlation matrix plot
  • ggpairs(): for scatterplot plot matrix
  • ggsurv(): for survival plot

Installation

GGally can be installed from GitHub or CRAN:

# Github
if(!require(devtools)) install.packages("devtools")
devtools::install_github("ggobi/ggally")
# CRAN
install.packages("GGally")

Loading GGally package

library("GGally")

ggcorr(): Plot a correlation matrix

The function ggcorr() draws a correlation matrix plot using ggplot2.

The simplified format is:

ggcorr(data, palette = "RdYlGn", name = "rho", 
       label = FALSE, label_color = "black",  ...)

  • data: a numerical (continuous) data matrix
  • palette: a ColorBrewer palette to be used for correlation coefficients. Default value is “RdYlGn”.
  • name: a character string used for legend title.
  • label: logical value. If TRUE, the correlation coefficients are displayed on the plot.
  • label_color: color to be used for the correlation coefficient


The function ggcorr() can be used as follow:

# Prepare some data
df <- mtcars[, c(1,3,4,5,6,7)]

# Correlation plot
ggcorr(df, palette = "RdBu", label = TRUE)

ggplot2 and ggally - R software and data visualization

Read also: ggplot2 correlation matrix heatmap

ggpairs(): ggplot2 matrix of plots

The function ggpairs() produces a matrix of scatter plots for visualizing the correlation between variables.

The simplified format is:

ggpairs(data, columns = 1:ncol(data), title = "",  
  axisLabels = "show", columnLabels = colnames(data[, columns]))

  • data: data set. Can have both numerical and categorical data.
  • columns: columns to be used for the plots. Default is all columns.
  • title: title for the graph
  • axisLabels: Allowed values are either “show” to display axisLabels, “internal” for labels in the diagonal plots, or “none” for no axis labels
  • columnLabels: label names to be displayed. Defaults to names of columns being used.


ggpairs(df)

ggplot2 and ggally - R software and data visualization

ggsurv(): Plot survival curve using ggplot2

The function ggsurv() can be used to produces Kaplan-Meier plots using ggplot2 .

The simplified format is:

ggsurv(s, surv.col = "gg.def", plot.cens = TRUE, cens.col = "red",
       xlab = "Time", ylab = "Survival", main = "")

  • s: an object of class survfit
  • surv.col: color of the survival estimate. The default value is black for one stratum; default ggplot2 colors for multiple strata. It can be also a vector containing the color names for each stratum.
  • plot.cens: logical value. If TRUE, marks the censored observations.
  • cens.col: color of the points that mark censored observations.
  • xlab, ylab: label of x-axis and y-axis, respectively
  • main: the plot main title


Data

We’ll use lung data from the package survival:

require(survival)
data(lung, package = "survival")
head(lung[, 1:5])
##   inst time status age sex
## 1    3  306      2  74   1
## 2    3  455      2  68   1
## 3    3 1010      1  56   1
## 4    5  210      2  57   1
## 5    1  883      2  60   1
## 6   12 1022      1  74   1

The data above includes:

  • time: Survival time in days
  • status: censoring status 1 = censored, 2 = dead
  • sex: Male = 1; Female = 2

In the next section we’ll plot the survival curves of male and female.

Survival curves

require("survival")
# Fit survival functions
surv <- survfit(Surv(time, status) ~ sex, data = lung)

# Plot survival curves
surv.p <- ggsurv(surv)
surv.p

ggplot2 and ggally - R software and data visualization

It’s possible to change the legend of the plot as follow:

require(ggplot2)
surv.p + guides(linetype = FALSE) +
scale_colour_discrete(name   = 'Sex', breaks = c(1,2), 
                      labels = c('Male', 'Female'))

ggplot2 and ggally - R software and data visualization

Infos

This analysis has been performed using R software (ver. 3.2.1) and ggplot2 (ver. 1.0.1)
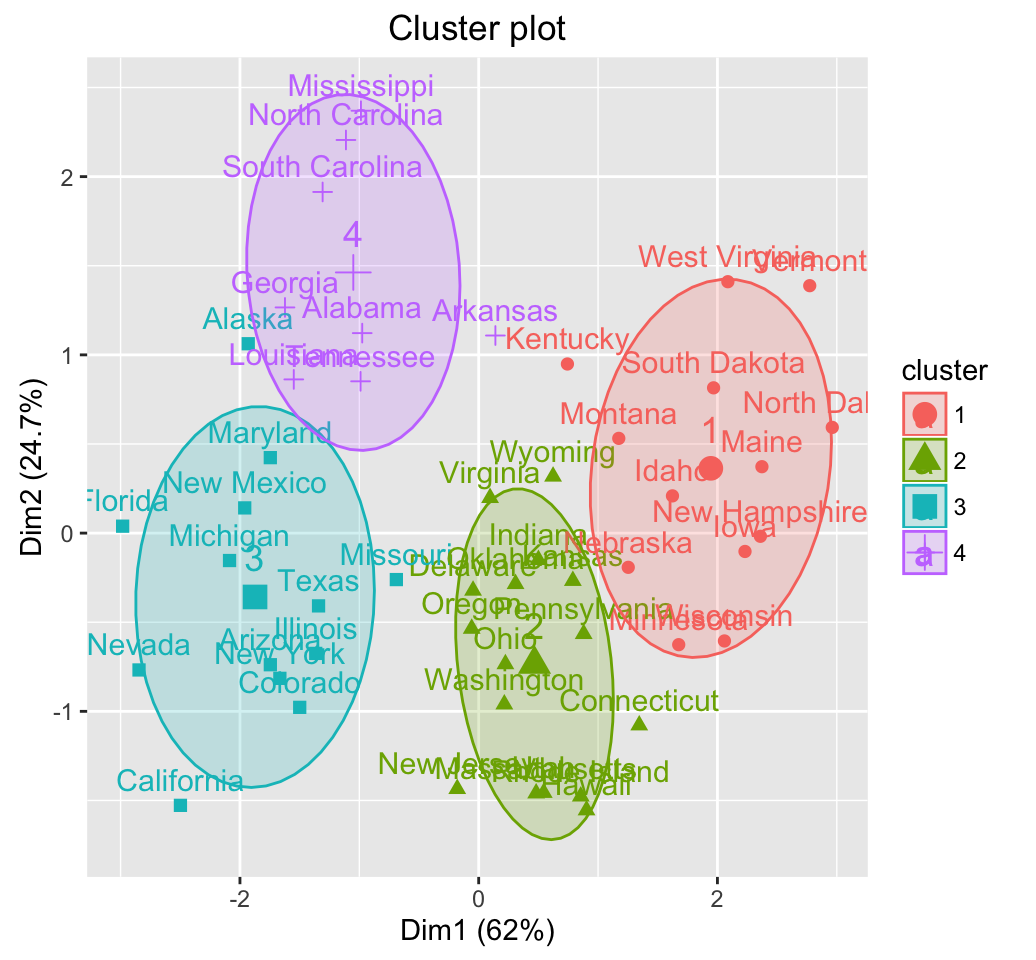
Viewing all 183 articles
Browse latest View live


<script src="https://jsc.adskeeper.com/r/s/rssing.com.1596347.js" async> </script>