Quantcast
Channel: Easy Guides
Viewing all 183 articles
Browse latest View live

Add P-values and Significance Levels to ggplots

$
0
0


In this article, we’ll describe how to easily i) compare means of two or multiple groups; ii) and to automatically add p-values and significance levels to a ggplot (such as box plots, dot plots, bar plots and line plots …).

Contents:

Prerequisites

Install and load required R packages

Required R package: ggpubr (version >= 0.1.3), for ggplot2-based publication ready plots.

  • Install from CRAN as follow:
install.packages("ggpubr")
  • Or, install the latest developmental version from GitHub as follow:
if(!require(devtools)) install.packages("devtools")
devtools::install_github("kassambara/ggpubr")
  • Load ggpubr:
library(ggpubr)

Official documentation of ggpubr is available at: http://www.sthda.com/english/rpkgs/ggpubr

Demo data sets

Data: ToothGrowth data sets.

data("ToothGrowth")
head(ToothGrowth)
   len supp dose
1  4.2   VC  0.5
2 11.5   VC  0.5
3  7.3   VC  0.5
4  5.8   VC  0.5
5  6.4   VC  0.5
6 10.0   VC  0.5

Methods for comparing means

The standard methods to compare the means of two or more groups in R, have been largely described at: comparing means in R.

The most common methods for comparing means include:

MethodsR functionDescription
T-testt.test()Compare two groups (parametric)
Wilcoxon testwilcox.test()Compare two groups (non-parametric)
ANOVAaov() or anova()Compare multiple groups (parametric)
Kruskal-Walliskruskal.test()Compare multiple groups (non-parametric)

A practical guide to compute and interpret the results of each of these methods are provided at the following links:

R functions to add p-values

Here we present two new R functions in the ggpubr package:

  • compare_means(): easy to use solution to performs one and multiple mean comparisons.
  • stat_compare_means(): easy to use solution to automatically add p-values and significance levels to a ggplot.

compare_means()

As we’ll show in the next sections, it has multiple useful options compared to the standard R functions.

The simplified format is as follow:

compare_means(formula, data, method = "wilcox.test", paired = FALSE,
  group.by = NULL, ref.group = NULL, ...)
  • formula: a formula of the form x ~ group, where x is a numeric variable and group is a factor with one or multiple levels. For example, formula = TP53 ~ cancer_group. It’s also possible to perform the test for multiple response variables at the same time. For example, formula = c(TP53, PTEN) ~ cancer_group.
  • data: a data.frame containing the variables in the formula.

  • method: the type of test. Default is “wilcox.test”. Allowed values include:
    • “t.test” (parametric) and “wilcox.test”" (non-parametric). Perform comparison between two groups of samples. If the grouping variable contains more than two levels, then a pairwise comparison is performed.
    • “anova” (parametric) and “kruskal.test” (non-parametric). Perform one-way ANOVA test comparing multiple groups.
  • paired: a logical indicating whether you want a paired test. Used only in t.test and in wilcox.test.

  • group.by: variables used to group the data set before applying the test. When specified the mean comparisons will be performed in each subset of the data formed by the different levels of the group.by variables.

  • ref.group: a character string specifying the reference group. If specified, for a given grouping variable, each of the group levels will be compared to the reference group (i.e. control group). ref.group can be also “.all.”. In this case, each of the grouping variable levels is compared to all (i.e. base-mean).

stat_compare_means()

This function extends ggplot2 for adding mean comparison p-values to a ggplot, such as box blots, dot plots, bar plots and line plots.

The simplified format is as follow:

stat_compare_means(mapping = NULL, comparisons = NULL hide.ns = FALSE,
                   label = NULL,  label.x = NULL, label.y = NULL,  ...)
  • mapping: Set of aesthetic mappings created by aes().

  • comparisons: A list of length-2 vectors. The entries in the vector are either the names of 2 values on the x-axis or the 2 integers that correspond to the index of the groups of interest, to be compared.

  • hide.ns: logical value. If TRUE, hide ns symbol when displaying significance levels.

  • label: character string specifying label type. Allowed values include “p.signif” (shows the significance levels), “p.format” (shows the formatted p value).

  • label.x,label.y: numeric values. coordinates (in data units) to be used for absolute positioning of the label. If too short they will be recycled.

  • : other arguments passed to the function compare_means() such as method, paired, ref.group.

Compare two independent groups

Perform the test:

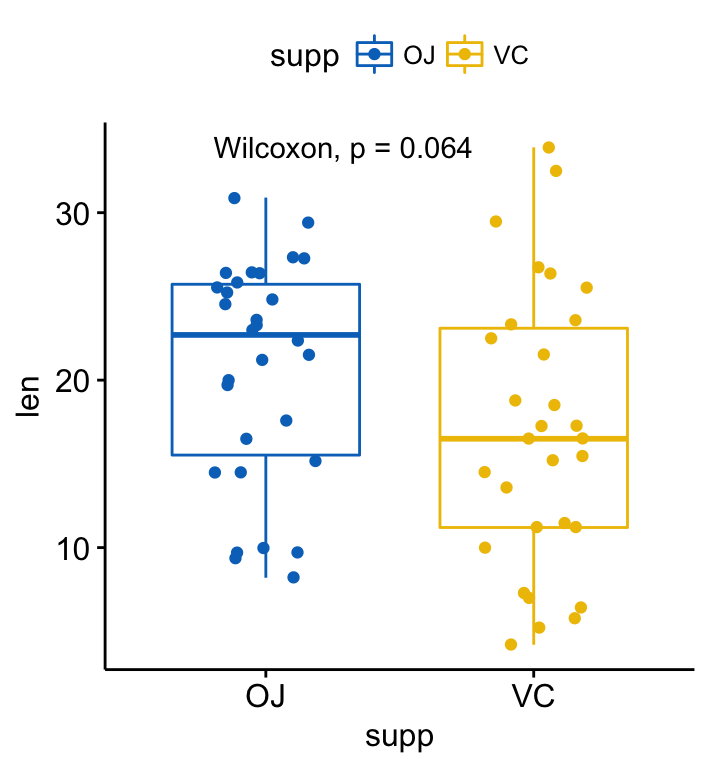
compare_means(len ~ supp, data = ToothGrowth)
# A tibble: 1 x 8
    .y. group1 group2          p      p.adj p.format p.signif   method
  
1   len     OJ     VC 0.06449067 0.06449067    0.064       ns Wilcoxon

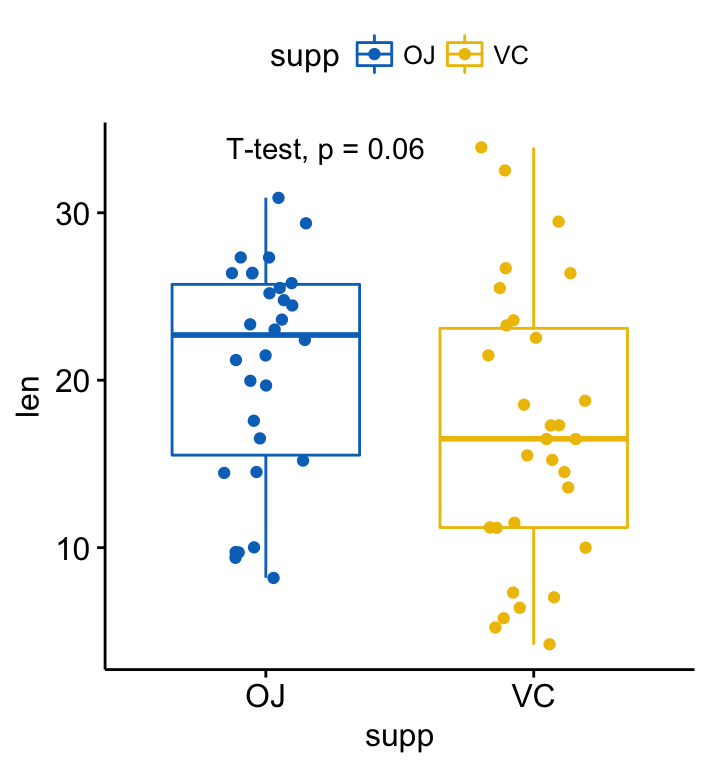
By default method = “wilcox.test” (non-parametric test). You can also specify method = “t.test” for a parametric t-test.

Returned value is a data frame with the following columns:

  • .y.: the y variable used in the test.
  • p: the p-value
  • p.adj: the adjusted p-value. Default value for p.adjust.method = “holm”
  • p.format: the formatted p-value
  • p.signif: the significance level.
  • method: the statistical test used to compare groups.

Create a box plot with p-values:

p <- ggboxplot(ToothGrowth, x = "supp", y = "len",
          color = "supp", palette = "jco",
          add = "jitter")
#  Add p-value
p + stat_compare_means()

# Change method
p + stat_compare_means(method = "t.test")
Add p-values and significance levels to ggplotsAdd p-values and significance levels to ggplots

Add p-values and significance levels to ggplots

Note that, the p-value label position can be adjusted using the arguments: label.x, label.y, hjust and vjust.

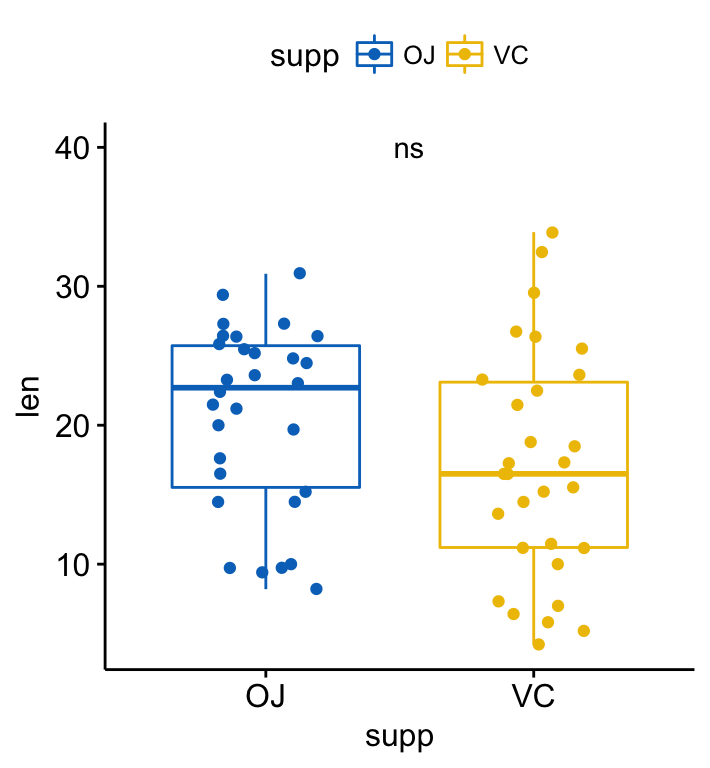
The default p-value label displayed is obtained by concatenating the method and the p columns of the returned data frame by the function compare_means(). You can specify other combinations using the aes() function.

For example,

  • aes(label = ..p.format..) or aes(label = paste0(“p =”, ..p.format..)): display only the formatted p-value (without the method name)
  • aes(label = ..p.signif..): display only the significance level.
  • aes(label = paste0(..method.., “\n”, “p =”, ..p.format..)): Use line break (“\n”) between the method name and the p-value.

As an illustration, type this:

p + stat_compare_means( aes(label = ..p.signif..), 
                        label.x = 1.5, label.y = 40)
Add p-values and significance levels to ggplots

Add p-values and significance levels to ggplots

If you prefer, it’s also possible to specify the argument label as a character vector:

p + stat_compare_means( label = "p.signif", label.x = 1.5, label.y = 40)

Compare two paired samples

Perform the test:

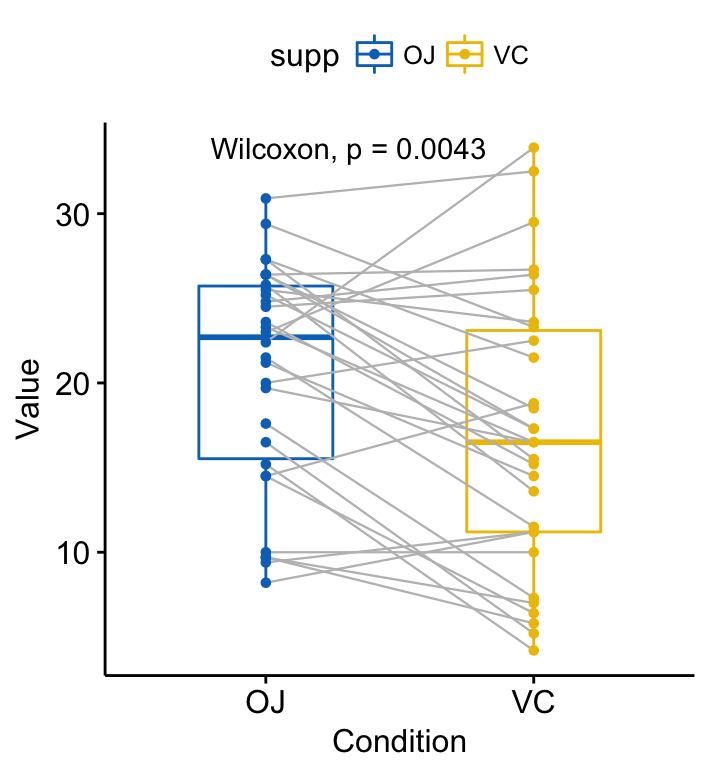
compare_means(len ~ supp, data = ToothGrowth, paired = TRUE)
# A tibble: 1 x 8
    .y. group1 group2           p       p.adj p.format p.signif   method
  
1   len     OJ     VC 0.004312554 0.004312554   0.0043       ** Wilcoxon

Visualize paired data using the ggpaired() function:

ggpaired(ToothGrowth, x = "supp", y = "len",
         color = "supp", line.color = "gray", line.size = 0.4,
         palette = "jco")+
  stat_compare_means(paired = TRUE)
Add p-values and significance levels to ggplots

Add p-values and significance levels to ggplots

Compare more than two groups

  • Global test:
# Global test
compare_means(len ~ dose,  data = ToothGrowth, method = "anova")
# A tibble: 1 x 6
    .y.            p        p.adj p.format p.signif method
  
1   len 9.532727e-16 9.532727e-16  9.5e-16     ****  Anova

Plot with global p-value:

# Default method = "kruskal.test" for multiple groups
ggboxplot(ToothGrowth, x = "dose", y = "len",
          color = "dose", palette = "jco")+
  stat_compare_means()

# Change method to anova
ggboxplot(ToothGrowth, x = "dose", y = "len",
          color = "dose", palette = "jco")+
  stat_compare_means(method = "anova")
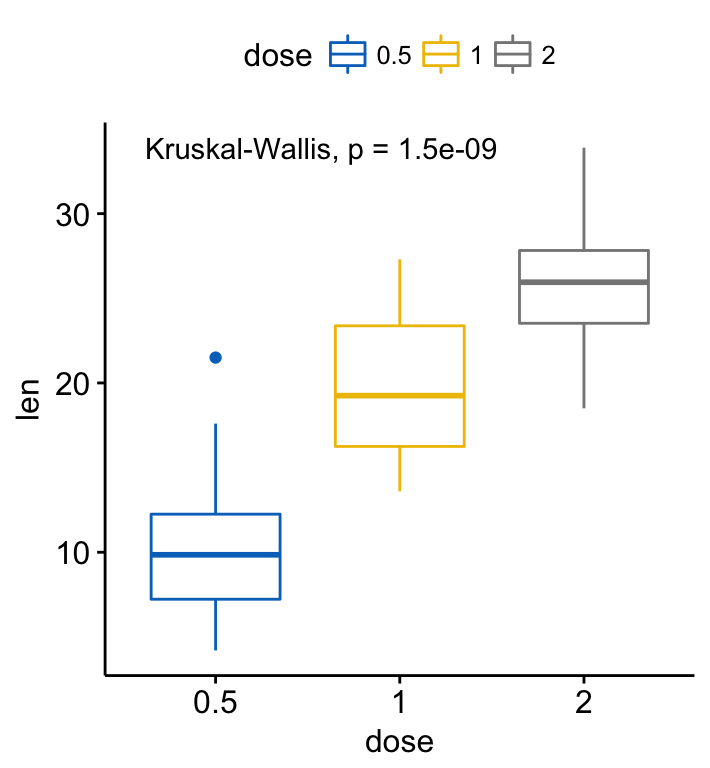
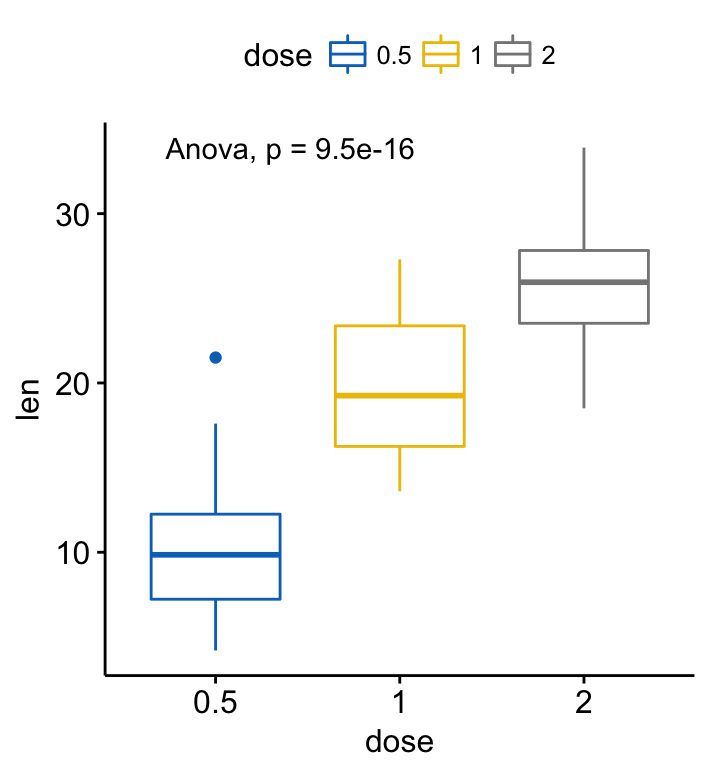
Add p-values and significance levels to ggplotsAdd p-values and significance levels to ggplots

Add p-values and significance levels to ggplots

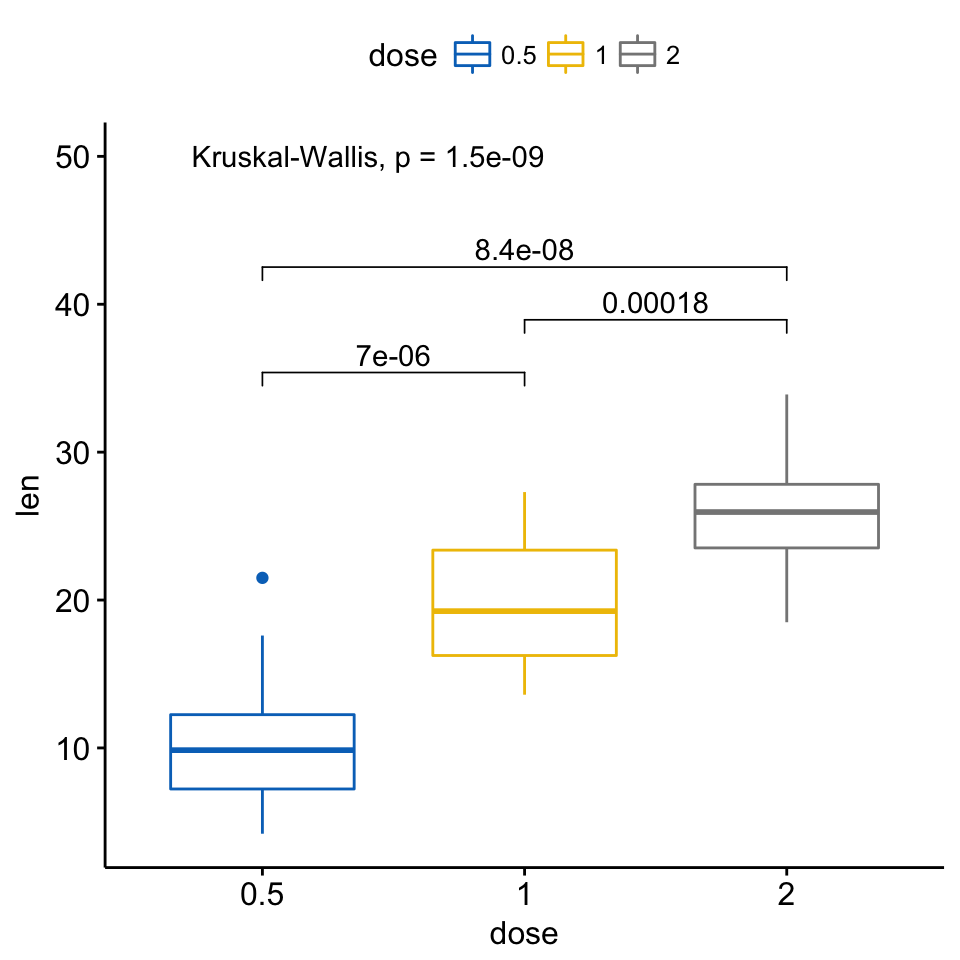
  • Pairwise comparisons. If the grouping variable contains more than two levels, then pairwise tests will be performed automatically. The default method is “wilcox.test”. You can change this to “t.test”.
# Perorm pairwise comparisons
compare_means(len ~ dose,  data = ToothGrowth)
# A tibble: 3 x 8
    .y. group1 group2            p        p.adj p.format p.signif   method
  
1   len    0.5      1 7.020855e-06 1.404171e-05  7.0e-06     **** Wilcoxon
2   len    0.5      2 8.406447e-08 2.521934e-07  8.4e-08     **** Wilcoxon
3   len      1      2 1.772382e-04 1.772382e-04  0.00018      *** Wilcoxon
# Visualize: Specify the comparisons you want
my_comparisons <- list( c("0.5", "1"), c("1", "2"), c("0.5", "2") )
ggboxplot(ToothGrowth, x = "dose", y = "len",
          color = "dose", palette = "jco")+ 
  stat_compare_means(comparisons = my_comparisons)+ # Add pairwise comparisons p-value
  stat_compare_means(label.y = 50)     # Add global p-value
Add p-values and significance levels to ggplots

Add p-values and significance levels to ggplots

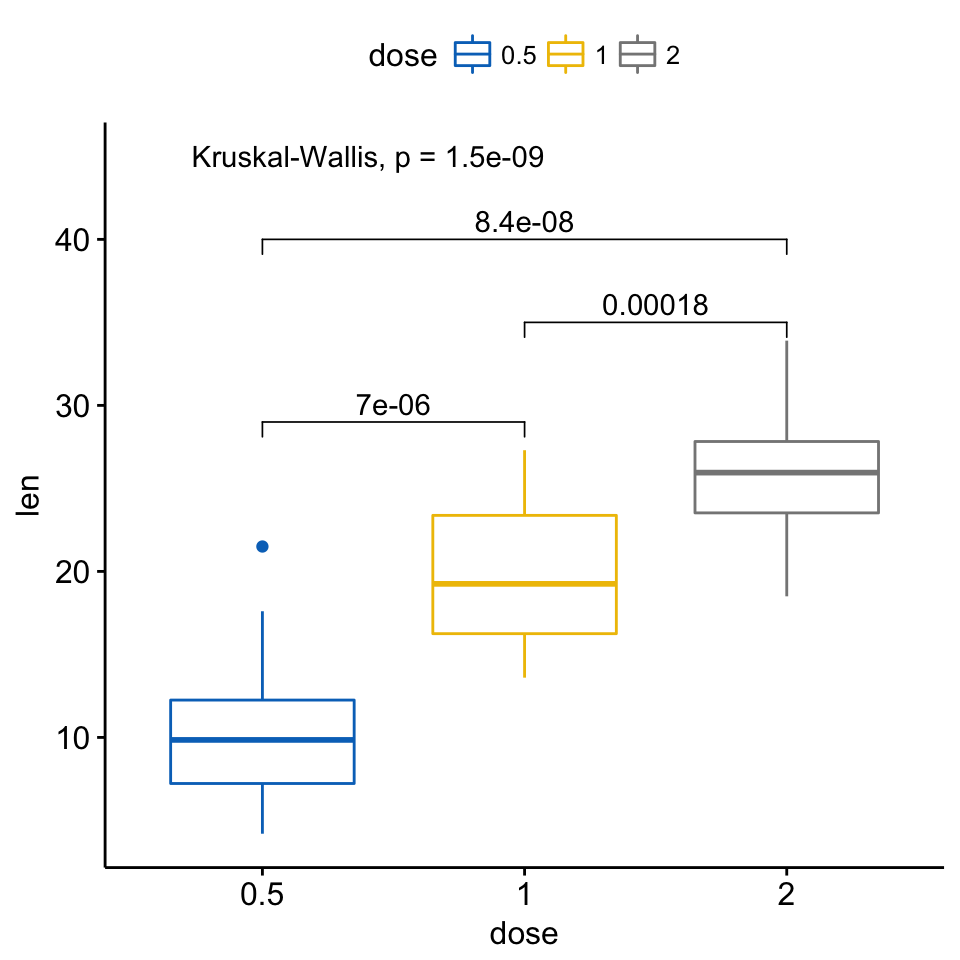
If you want to specify the precise y location of bars, use the argument label.y:

ggboxplot(ToothGrowth, x = "dose", y = "len",
          color = "dose", palette = "jco")+ 
  stat_compare_means(comparisons = my_comparisons, label.y = c(29, 35, 40))+
  stat_compare_means(label.y = 45)
Add p-values and significance levels to ggplots

Add p-values and significance levels to ggplots

(Adding bars, connecting compared groups, has been facilitated by the ggsignif R package )

  • Multiple pairwise tests against a reference group:
# Pairwise comparison against reference
compare_means(len ~ dose,  data = ToothGrowth, ref.group = "0.5",
              method = "t.test")
# A tibble: 2 x 8
    .y. group1 group2            p        p.adj p.format p.signif method
  
1   len    0.5      1 6.697250e-09 6.697250e-09  6.7e-09     **** T-test
2   len    0.5      2 1.469534e-16 2.939068e-16  < 2e-16     **** T-test
# Visualize
ggboxplot(ToothGrowth, x = "dose", y = "len",
          color = "dose", palette = "jco")+
  stat_compare_means(method = "anova", label.y = 40)+      # Add global p-value
  stat_compare_means(label = "p.signif", method = "t.test",
                     ref.group = "0.5")                    # Pairwise comparison against reference
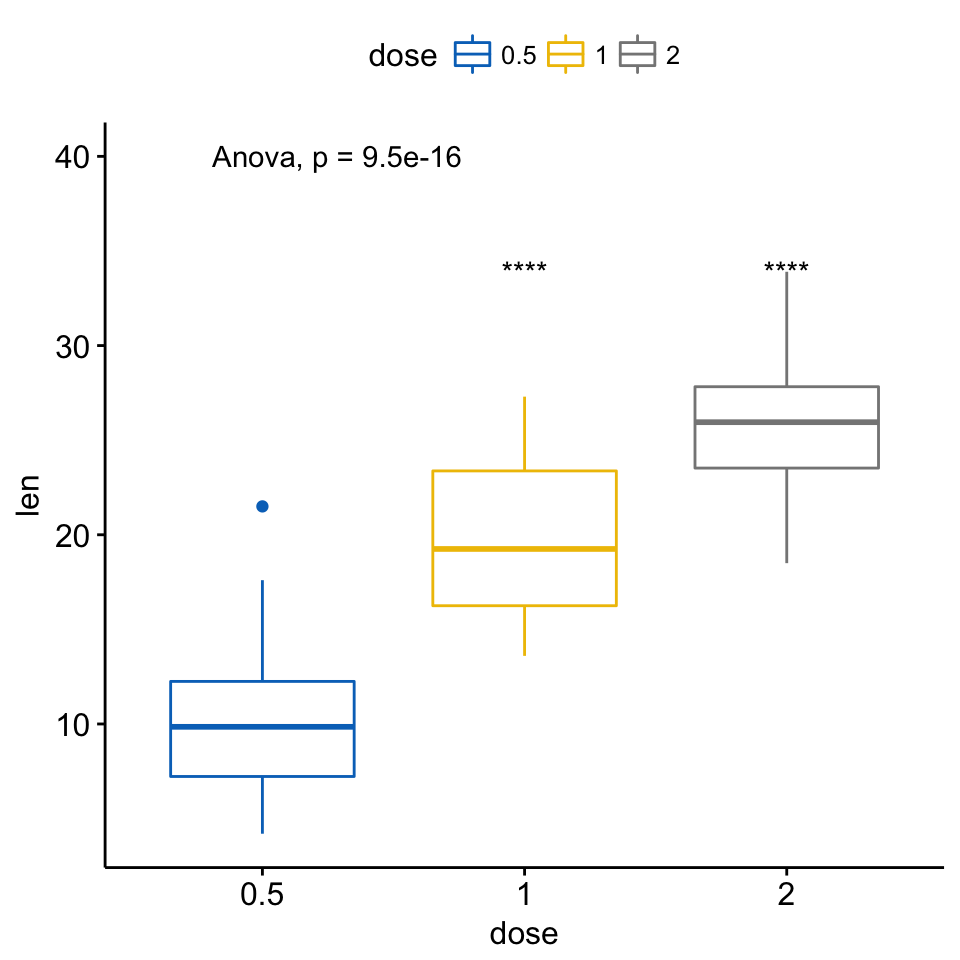
Add p-values and significance levels to ggplots

Add p-values and significance levels to ggplots

  • Multiple pairwise tests against all (base-mean):
# Comparison of each group against base-mean
compare_means(len ~ dose,  data = ToothGrowth, ref.group = ".all.",
              method = "t.test")
# A tibble: 3 x 8
    .y. group1 group2            p        p.adj p.format p.signif method
  
1   len  .all.    0.5 1.244626e-06 3.733877e-06  1.2e-06     **** T-test
2   len  .all.      1 5.667266e-01 5.667266e-01     0.57       ns T-test
3   len  .all.      2 1.371704e-05 2.743408e-05  1.4e-05     **** T-test
# Visualize
ggboxplot(ToothGrowth, x = "dose", y = "len",
          color = "dose", palette = "jco")+
  stat_compare_means(method = "anova", label.y = 40)+      # Add global p-value
  stat_compare_means(label = "p.signif", method = "t.test",
                     ref.group = ".all.")                  # Pairwise comparison against all
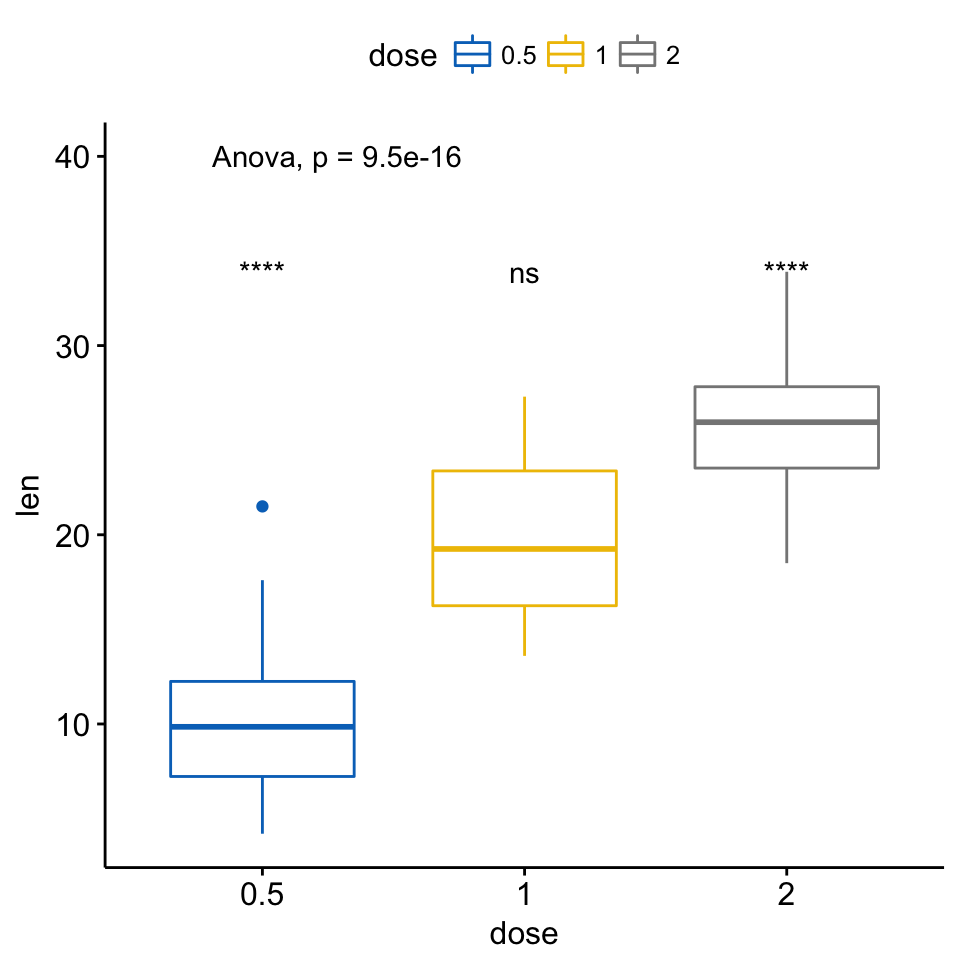
Add p-values and significance levels to ggplots

Add p-values and significance levels to ggplots

A typical situation, where pairwise comparisons against “all” can be useful, is illustrated here using the myeloma data set from the survminer package.

We’ll plot the expression profile of the DEPDC1 gene according to the patients’ molecular groups. We want to know if there is any difference between groups. If yes, where the difference is?

To answer to this question, you can perform a pairwise comparison between all the 7 groups. This will lead to a lot of comparisons between all possible combinations. If you have many groups, as here, it might be difficult to interpret.

Another easy solution is to compare each of the seven groups against “all” (i.e. base-mean). When the test is significant, then you can conclude that DEPDC1 is significantly overexpressed or downexpressed in a group xxx compared to all.

# Load myeloma data from survminer package
if(!require(survminer)) install.packages("survminer")
data("myeloma", package = "survminer")

# Perform the test
compare_means(DEPDC1 ~ molecular_group,  data = myeloma,
              ref.group = ".all.", method = "t.test")
# A tibble: 7 x 8
     .y. group1           group2            p        p.adj p.format p.signif method
   
1 DEPDC1  .all.       Cyclin D-1 1.496896e-01 4.490687e-01  0.14969       ns T-test
2 DEPDC1  .all.       Cyclin D-2 5.231428e-01 1.000000e+00  0.52314       ns T-test
3 DEPDC1  .all.     Hyperdiploid 2.815333e-04 1.689200e-03  0.00028      *** T-test
4 DEPDC1  .all. Low bone disease 5.083985e-03 2.541992e-02  0.00508       ** T-test
5 DEPDC1  .all.              MAF 8.610664e-02 3.444265e-01  0.08611       ns T-test
6 DEPDC1  .all.            MMSET 5.762908e-01 1.000000e+00  0.57629       ns T-test
7 DEPDC1  .all.    Proliferation 1.241416e-09 8.689910e-09  1.2e-09     **** T-test
# Visualize the expression profile
ggboxplot(myeloma, x = "molecular_group", y = "DEPDC1", color = "molecular_group", 
          add = "jitter", legend = "none") +
  rotate_x_text(angle = 45)+
  geom_hline(yintercept = mean(myeloma$DEPDC1), linetype = 2)+ # Add horizontal line at base mean
  stat_compare_means(method = "anova", label.y = 1600)+        # Add global annova p-value
  stat_compare_means(label = "p.signif", method = "t.test",
                     ref.group = ".all.")                      # Pairwise comparison against all
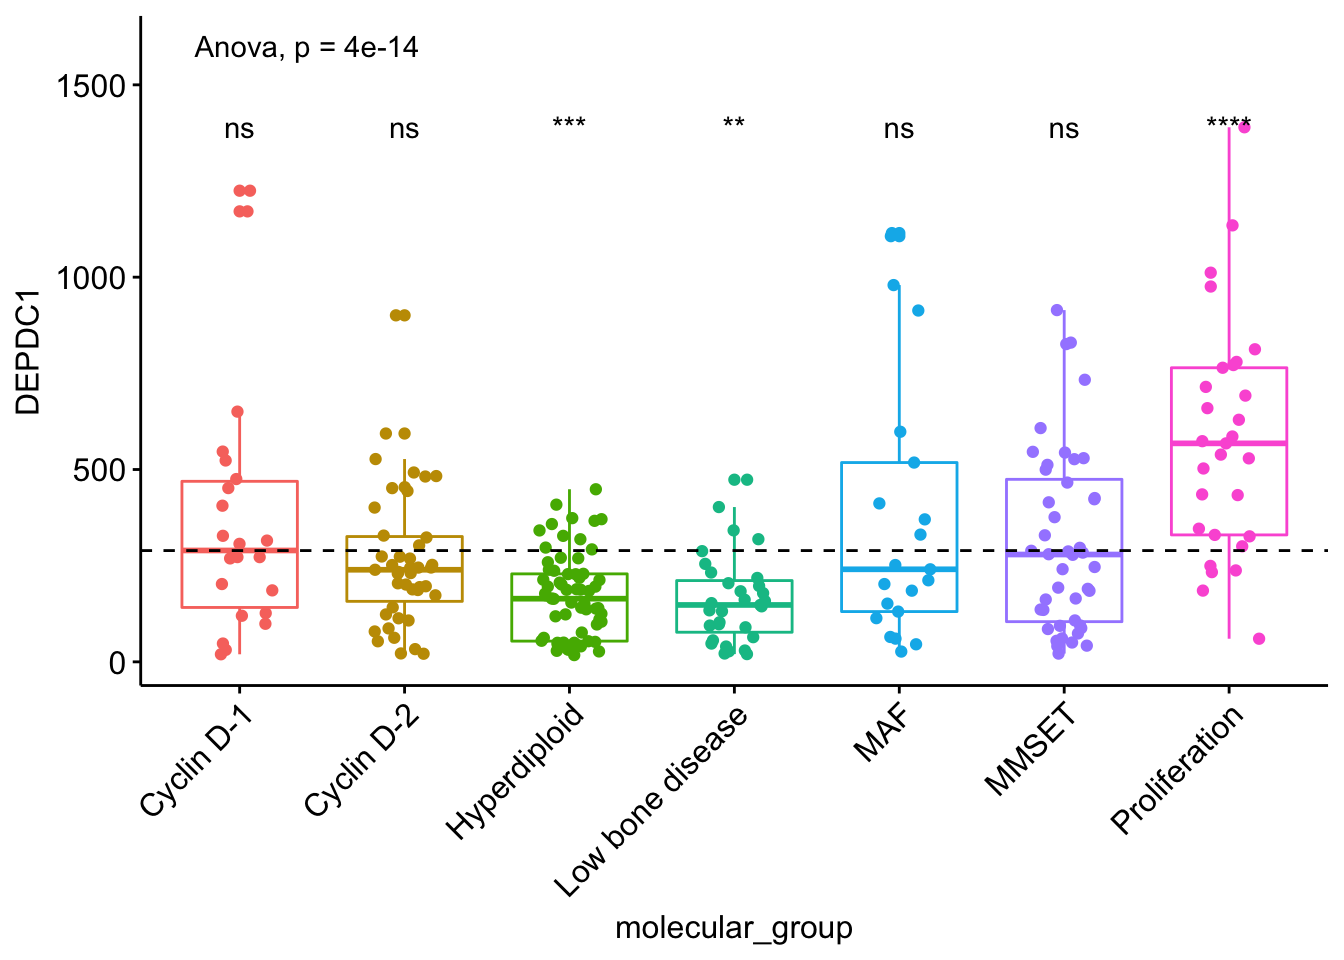
Add p-values and significance levels to ggplots

Add p-values and significance levels to ggplots

From the plot above, we can conclude that DEPDC1 is significantly overexpressed in proliferation group and, it’s significantly downexpressed in Hyperdiploid and Low bone disease compared to all.

Note that, if you want to hide the ns symbol, specify the argument hide.ns = TRUE.

# Visualize the expression profile
ggboxplot(myeloma, x = "molecular_group", y = "DEPDC1", color = "molecular_group", 
          add = "jitter", legend = "none") +
  rotate_x_text(angle = 45)+
  geom_hline(yintercept = mean(myeloma$DEPDC1), linetype = 2)+ # Add horizontal line at base mean
  stat_compare_means(method = "anova", label.y = 1600)+        # Add global annova p-value
  stat_compare_means(label = "p.signif", method = "t.test",
                     ref.group = ".all.", hide.ns = TRUE)      # Pairwise comparison against all
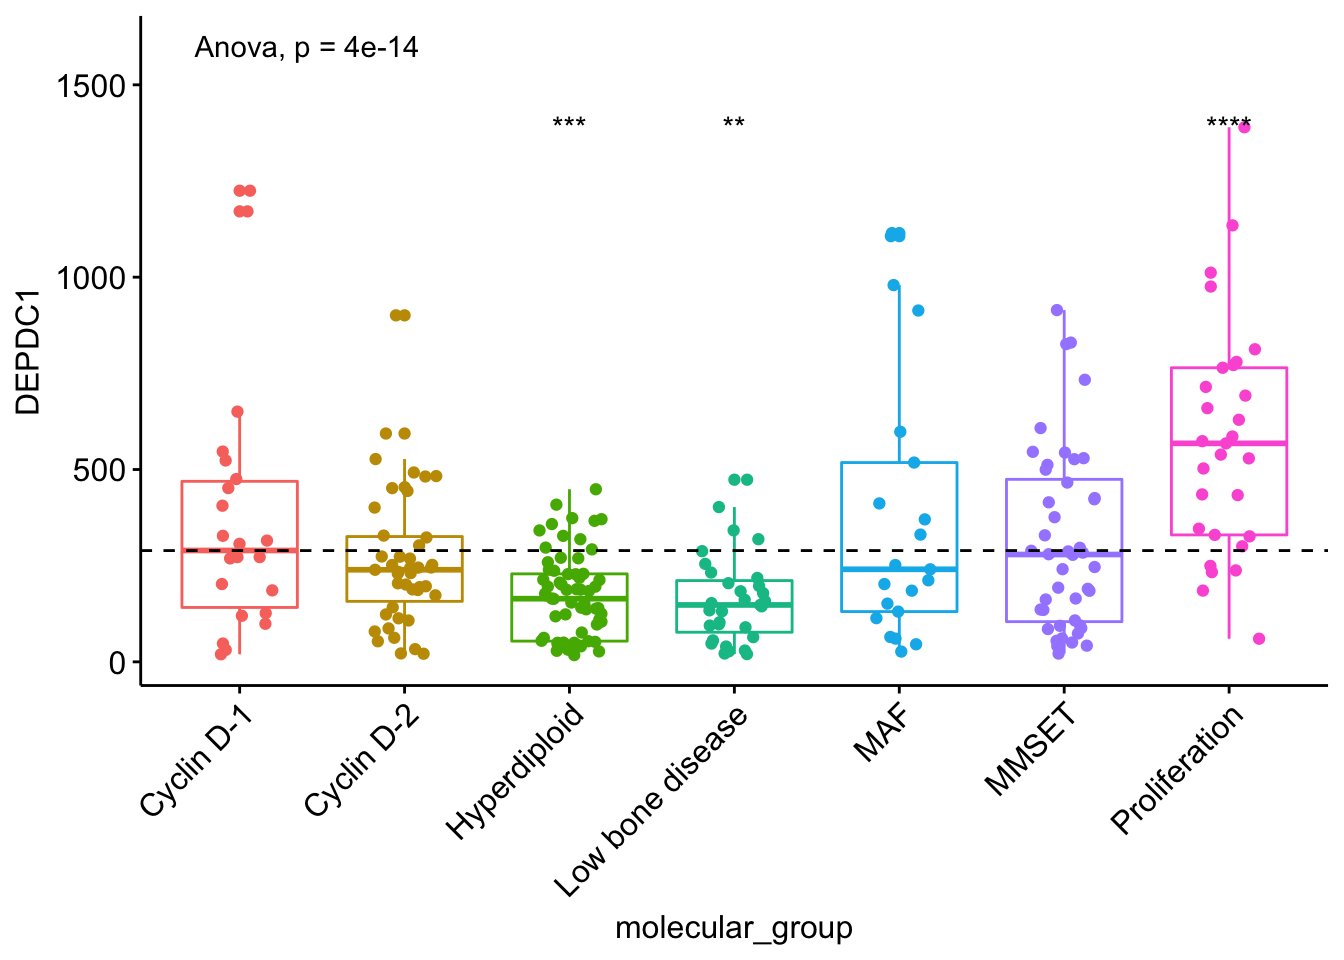
Add p-values and significance levels to ggplots

Add p-values and significance levels to ggplots

Multiple grouping variables

  • Two independent sample comparisons after grouping the data by another variable:

Perform the test:

compare_means(len ~ supp, data = ToothGrowth, 
              group.by = "dose")
# A tibble: 3 x 9
   dose   .y. group1 group2           p      p.adj p.format p.signif   method
  
1   0.5   len     OJ     VC 0.023186427 0.04637285    0.023        * Wilcoxon
2   1.0   len     OJ     VC 0.004030367 0.01209110    0.004       ** Wilcoxon
3   2.0   len     OJ     VC 1.000000000 1.00000000    1.000       ns Wilcoxon

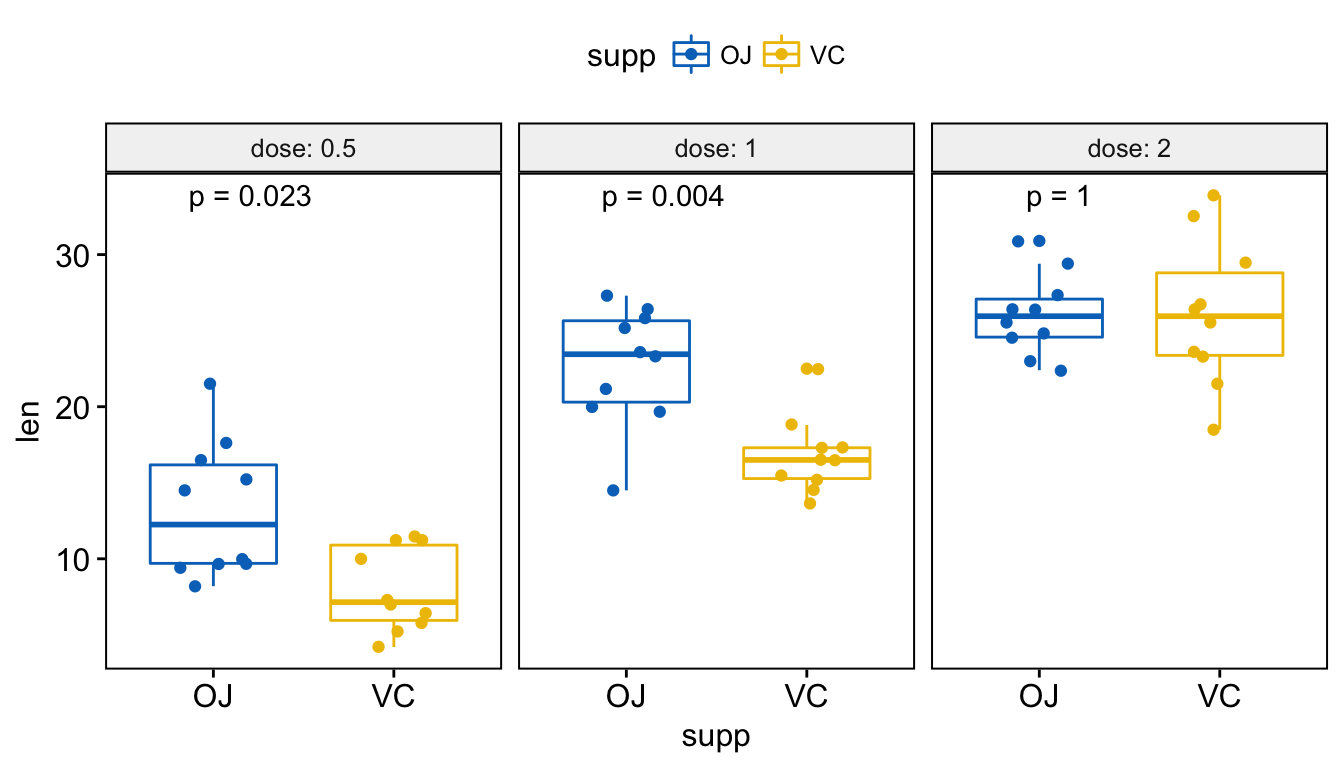
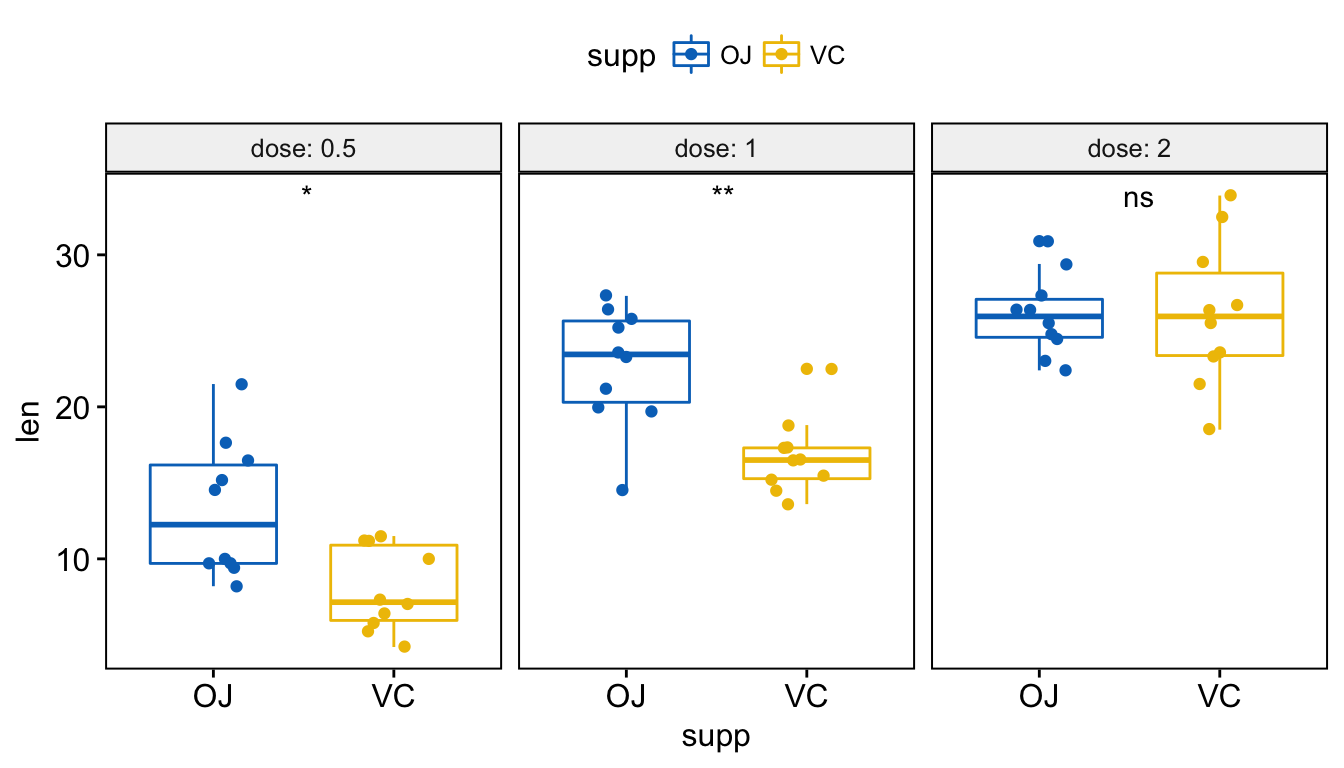
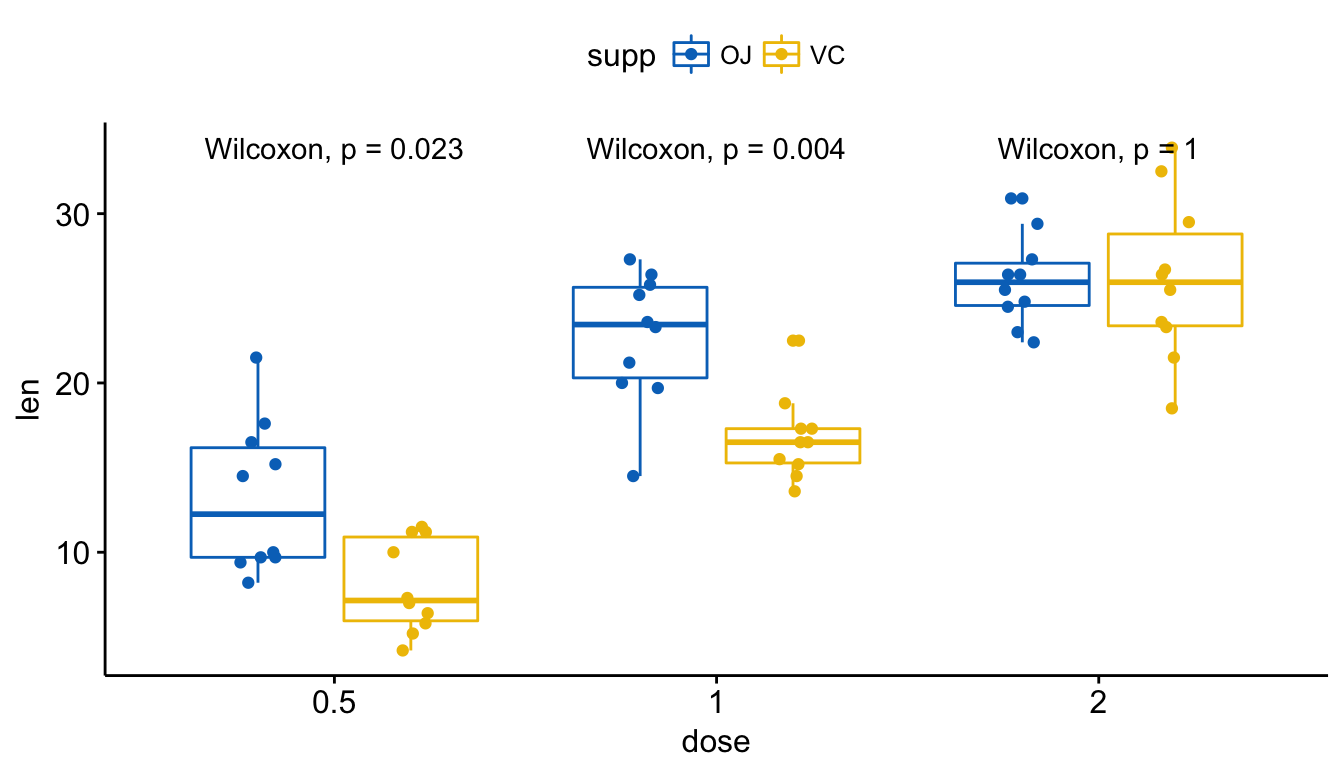
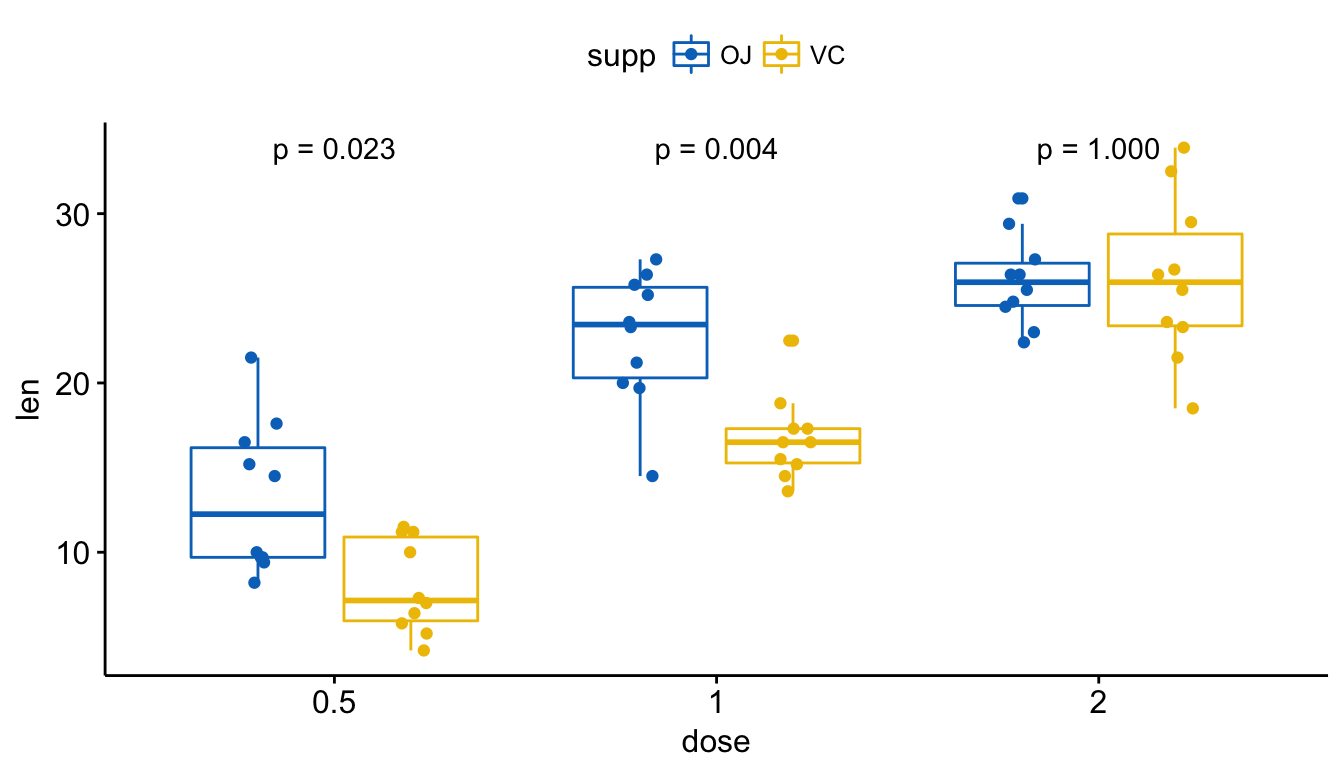
In the example above, for each level of the variable “dose”, we compare the means of the variable “len” in the different groups formed by the grouping variable “supp”.

Visualize (1/2). Create a multi-panel box plots facetted by group (here, “dose”):

# Box plot facetted by "dose"
p <- ggboxplot(ToothGrowth, x = "supp", y = "len",
          color = "supp", palette = "jco",
          add = "jitter",
          facet.by = "dose", short.panel.labs = FALSE)
# Use only p.format as label. Remove method name.
p + stat_compare_means(label = "p.format")
Add p-values and significance levels to ggplots

Add p-values and significance levels to ggplots

# Or use significance symbol as label
p + stat_compare_means(label =  "p.signif", label.x = 1.5)
Add p-values and significance levels to ggplots

Add p-values and significance levels to ggplots

To hide the ‘ns’ symbol, use the argument hide.ns = TRUE.

Visualize (2/2). Create one single panel with all box plots. Plot y = “len” by x = “dose” and color by “supp”:

p <- ggboxplot(ToothGrowth, x = "dose", y = "len",
          color = "supp", palette = "jco",
          add = "jitter")
p + stat_compare_means(aes(group = supp))
Add p-values and significance levels to ggplots

Add p-values and significance levels to ggplots

# Show only p-value
p + stat_compare_means(aes(group = supp), label = "p.format")
Add p-values and significance levels to ggplots

Add p-values and significance levels to ggplots

# Use significance symbol as label
p + stat_compare_means(aes(group = supp), label = "p.signif")
Add p-values and significance levels to ggplots

Add p-values and significance levels to ggplots

  • Paired sample comparisons after grouping the data by another variable:

Perform the test:

compare_means(len ~ supp, data = ToothGrowth, 
              group.by = "dose", paired = TRUE)
# A tibble: 3 x 9
   dose   .y. group1 group2          p      p.adj p.format p.signif   method
  
1   0.5   len     OJ     VC 0.03296938 0.06593876    0.033        * Wilcoxon
2   1.0   len     OJ     VC 0.01905889 0.05717667    0.019        * Wilcoxon
3   2.0   len     OJ     VC 1.00000000 1.00000000    1.000       ns Wilcoxon

Visualize. Create a multi-panel box plots facetted by group (here, “dose”):

# Box plot facetted by "dose"
p <- ggpaired(ToothGrowth, x = "supp", y = "len",
          color = "supp", palette = "jco", 
          line.color = "gray", line.size = 0.4,
          facet.by = "dose", short.panel.labs = FALSE)
# Use only p.format as label. Remove method name.
p + stat_compare_means(label = "p.format", paired = TRUE)
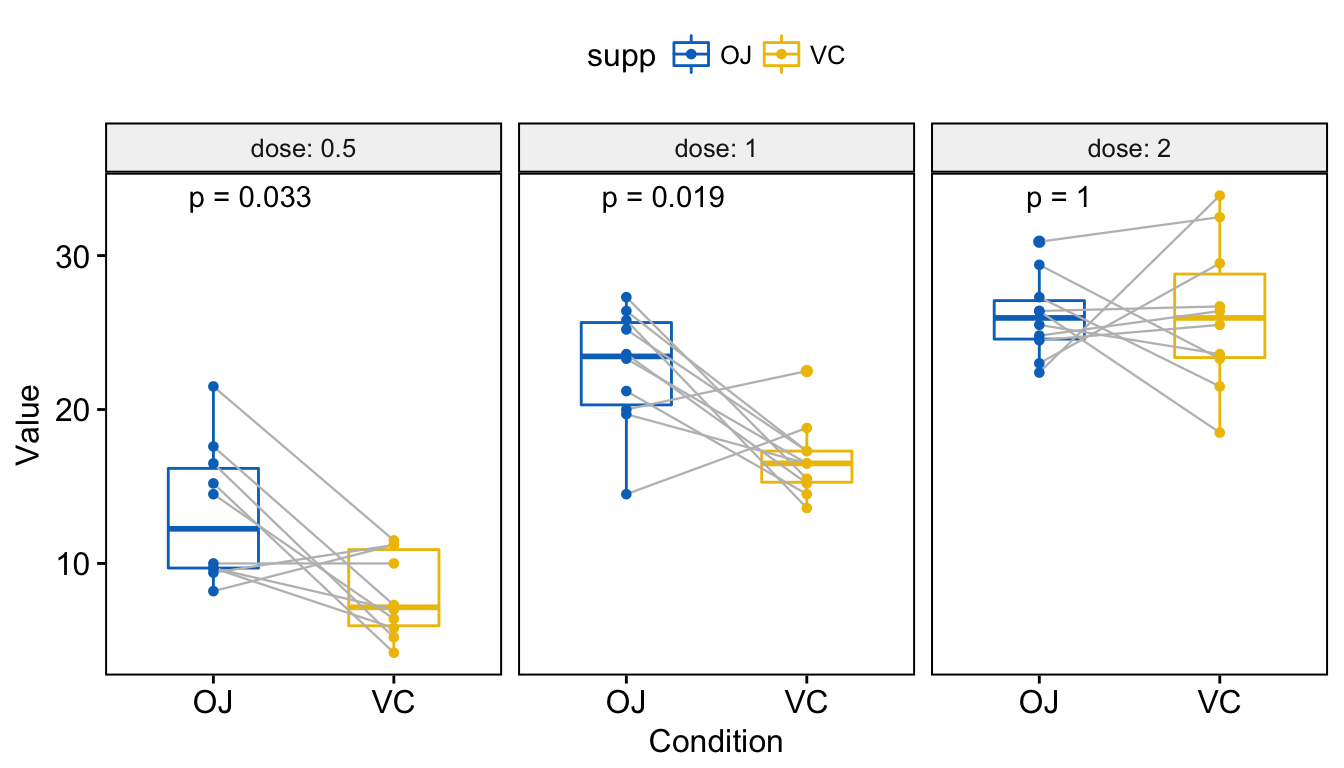
Add p-values and significance levels to ggplots

Add p-values and significance levels to ggplots

Other plot types

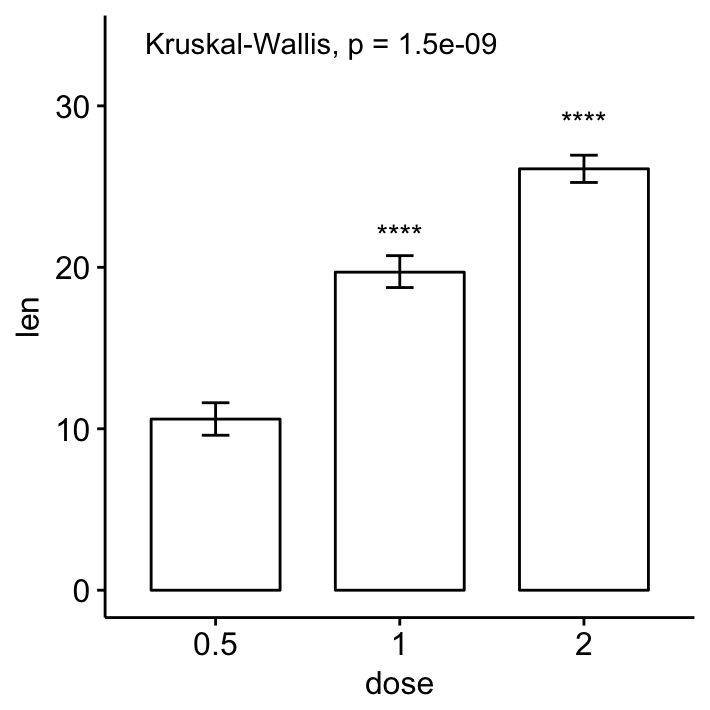
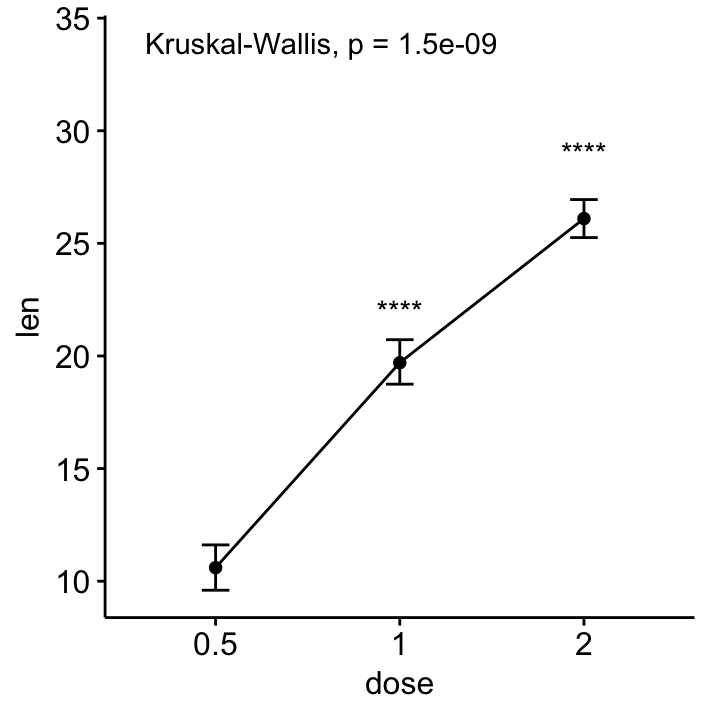
  • Bar and line plots (one grouping variable):
# Bar plot of mean +/-se
ggbarplot(ToothGrowth, x = "dose", y = "len", add = "mean_se")+
  stat_compare_means() +                                         # Global p-value
  stat_compare_means(ref.group = "0.5", label = "p.signif",
                     label.y = c(22, 29))                   # compare to ref.group
# Line plot of mean +/-se
ggline(ToothGrowth, x = "dose", y = "len", add = "mean_se")+
  stat_compare_means() +                                         # Global p-value
  stat_compare_means(ref.group = "0.5", label = "p.signif",
                     label.y = c(22, 29))     
Add p-values and significance levels to ggplotsAdd p-values and significance levels to ggplots

Add p-values and significance levels to ggplots

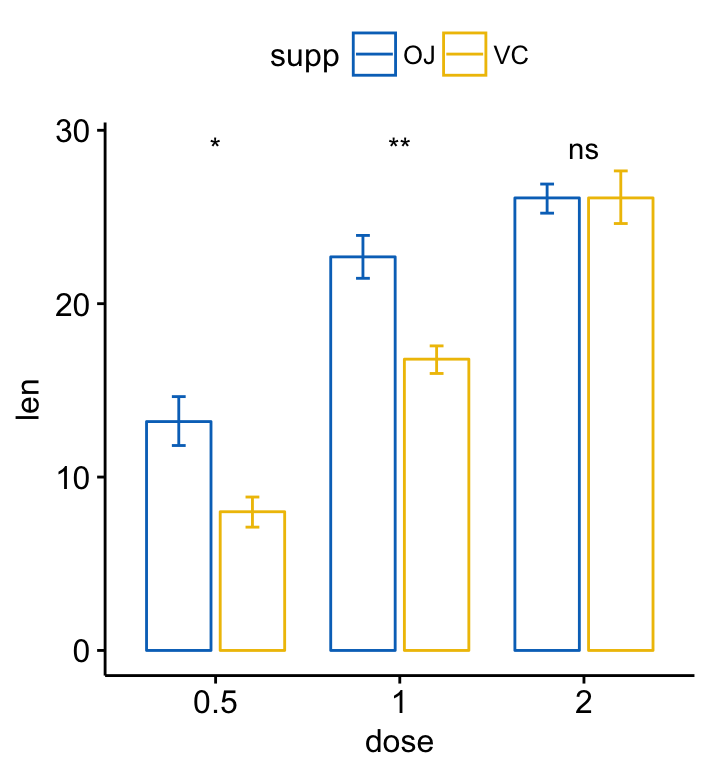
  • Bar and line plots (two grouping variables):
ggbarplot(ToothGrowth, x = "dose", y = "len", add = "mean_se",
          color = "supp", palette = "jco", 
          position = position_dodge(0.8))+
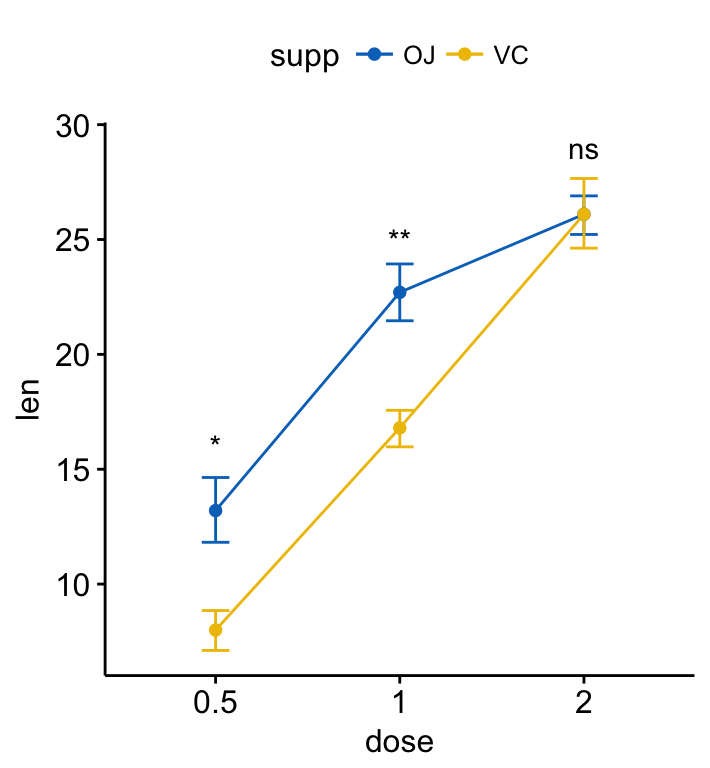
  stat_compare_means(aes(group = supp), label = "p.signif", label.y = 29)

ggline(ToothGrowth, x = "dose", y = "len", add = "mean_se",
          color = "supp", palette = "jco")+
  stat_compare_means(aes(group = supp), label = "p.signif", 
                     label.y = c(16, 25, 29))
Add p-values and significance levels to ggplotsAdd p-values and significance levels to ggplots

Add p-values and significance levels to ggplots

Infos

This analysis has been performed using R software (ver. 3.3.2) and ggpubr (ver. 0.1.3).

Facilitating Exploratory Data Visualization: Application to TCGA Genomic Data

$
0
0


In genomic fields, it’s very common to explore the gene expression profile of one or a list of genes involved in a pathway of interest. Here, we present some helper functions in the ggpubr R package to facilitate exploratory data analysis (EDA) for life scientists.

Exploratory Data visualization: Gene Expression Data

Exploratory Data visualization: Gene Expression Data

Standard graphical techniques used in EDA, include:

  • Box plot
  • Violin plot
  • Stripchart
  • Dot plot
  • Histogram and density plots
  • ECDF plot
  • Q-Q plot

All these plots can be created using the ggplot2 R package, which is highly flexible.

However, to customize a ggplot, the syntax might appear opaque for a beginner and this raises the level of difficulty for researchers with no advanced R programming skills. If you’re not familiar with ggplot2 system, you can start by reading our Guide to Create Beautiful Graphics in R.

Previously, we described how to Add P-values and Significance Levels to ggplots. In this article, we present the ggpubr package, a wrapper around ggplot2, which provides some easy-to-use functions for creating ‘ggplot2’- based publication ready plots. We’ll use the ggpubr functions to visualize gene expression profile from TCGA genomic data sets.

Contents:

Prerequisites

ggpubr package

Required R package: ggpubr (version >= 0.1.3).

  • Install from CRAN as follow:
install.packages("ggpubr")
  • Or, install the latest developmental version from GitHub as follow:
if(!require(devtools)) install.packages("devtools")
devtools::install_github("kassambara/ggpubr")
  • Load ggpubr:
library(ggpubr)

TCGA data

The Cancer Genome Atlas (TCGA) data is a publicly available data containing clinical and genomic data across 33 cancer types. These data include gene expression, CNV profiling, SNP genotyping, DNA methylation, miRNA profiling, exome sequencing, and other types of data.

The RTCGA R package, by Marcin Marcin Kosinski et al., provides a convenient solution to access to clinical and genomic data available in TCGA. Each of the data packages is a separate package, and must be installed (once) individually.

The following R code installs the core RTCGA package as well as the clinical and mRNA gene expression data packages.

# Load the bioconductor installer. 
source("https://bioconductor.org/biocLite.R")

# Install the main RTCGA package
biocLite("RTCGA")

# Install the clinical and mRNA gene expression data packages
biocLite("RTCGA.clinical")
biocLite("RTCGA.mRNA")

To see the type of data available for each cancer type, use this:

library(RTCGA)
infoTCGA()
# A tibble: 38 x 13
     Cohort    BCR Clinical     CN   LowP Methylation   mRNA mRNASeq    miR miRSeq   RPPA    MAF rawMAF
 *   
 1      ACC     92       92     90      0          80      0      79      0     80     46     90      0
 2     BLCA    412      412    410    112         412      0     408      0    409    344    130    395
 3     BRCA   1098     1097   1089     19        1097    526    1093      0   1078    887    977      0
 4     CESC    307      307    295     50         307      0     304      0    307    173    194      0
 5     CHOL     51       45     36      0          36      0      36      0     36     30     35      0
 6     COAD    460      458    451     69         457    153     457      0    406    360    154    367
 7 COADREAD    631      629    616    104         622    222     623      0    549    491    223    489
 8     DLBC     58       48     48      0          48      0      48      0     47     33     48      0
 9     ESCA    185      185    184     51         185      0     184      0    184    126    185      0
10     FPPP     38       38      0      0           0      0       0      0     23      0      0      0
# ... with 28 more rows

More information about the disease names can be found at: http://gdac.broadinstitute.org/

Gene expression data

The R function expressionsTCGA() [in RTCGA package] can be used to easily extract the expression values of genes of interest in one or multiple cancer types.

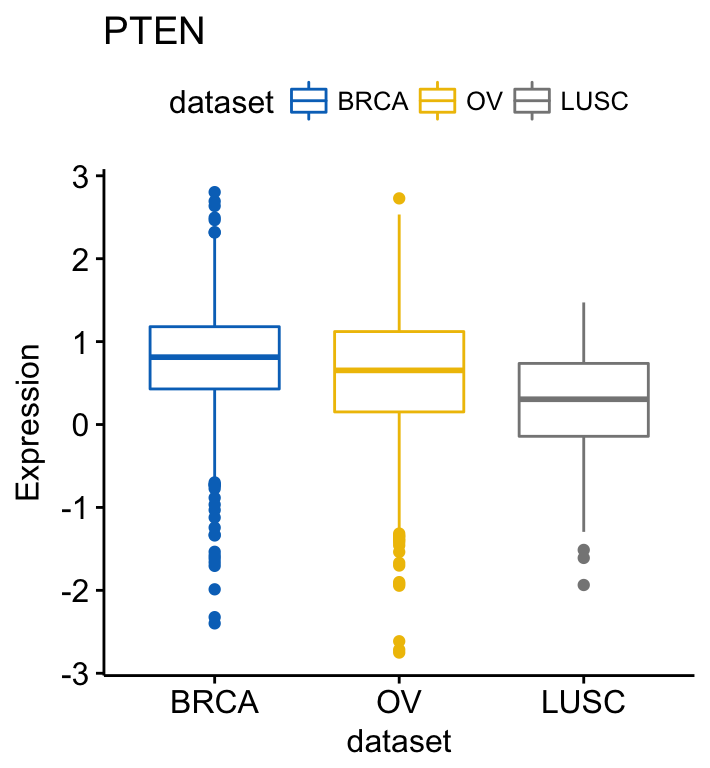
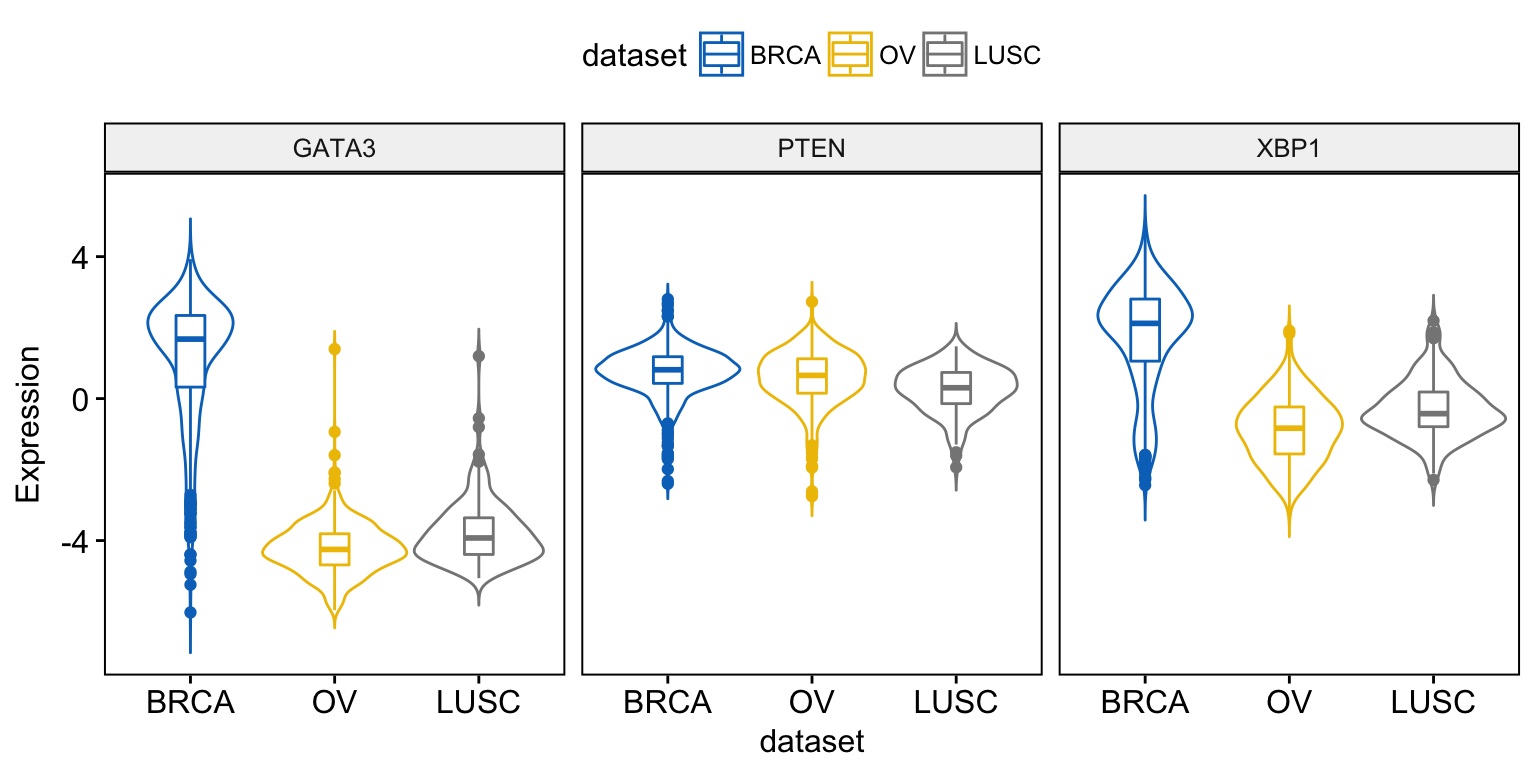
In the following R code, we start by extracting the mRNA expression for five genes of interest - GATA3, PTEN, XBP1, ESR1 and MUC1 - from 3 different data sets:

  • Breast invasive carcinoma (BRCA),
  • Ovarian serous cystadenocarcinoma (OV) and
  • Lung squamous cell carcinoma (LUSC)
library(RTCGA)
library(RTCGA.mRNA)
expr <- expressionsTCGA(BRCA.mRNA, OV.mRNA, LUSC.mRNA,
                        extract.cols = c("GATA3", "PTEN", "XBP1","ESR1", "MUC1"))
expr
# A tibble: 1,305 x 7
            bcr_patient_barcode   dataset     GATA3       PTEN      XBP1       ESR1      MUC1
                          
 1 TCGA-A1-A0SD-01A-11R-A115-07 BRCA.mRNA  2.870500  1.3613571  2.983333  3.0842500  1.652125
 2 TCGA-A1-A0SE-01A-11R-A084-07 BRCA.mRNA  2.166250  0.4283571  2.550833  2.3860000  3.080250
 3 TCGA-A1-A0SH-01A-11R-A084-07 BRCA.mRNA  1.323500  1.3056429  3.020417  0.7912500  2.985250
 4 TCGA-A1-A0SJ-01A-11R-A084-07 BRCA.mRNA  1.841625  0.8096429  3.131333  2.4954167 -1.918500
 5 TCGA-A1-A0SK-01A-12R-A084-07 BRCA.mRNA -6.025250  0.2508571 -1.451750 -4.8606667 -1.171500
 6 TCGA-A1-A0SM-01A-11R-A084-07 BRCA.mRNA  1.804500  1.3107857  4.041083  2.7970000  3.529750
 7 TCGA-A1-A0SO-01A-22R-A084-07 BRCA.mRNA -4.879250 -0.2369286 -0.724750 -4.4860833 -1.455750
 8 TCGA-A1-A0SP-01A-11R-A084-07 BRCA.mRNA -3.143250 -1.2432143 -1.193083 -1.6274167 -0.986750
 9 TCGA-A2-A04N-01A-11R-A115-07 BRCA.mRNA  2.034000  1.2074286  2.278833  4.1155833  0.668000
10 TCGA-A2-A04P-01A-31R-A034-07 BRCA.mRNA -0.293125  0.2883571 -1.605083  0.4731667  0.011500
# ... with 1,295 more rows

To display the number of sample in each data set, type this:

nb_samples <- table(expr$dataset)
nb_samples

BRCA.mRNA LUSC.mRNA   OV.mRNA 
      590       154       561 

We can simplify data set names by removing the “mRNA” tag. This can be done using the R base function gsub().

expr$dataset <- gsub(pattern = ".mRNA", replacement = "",  expr$dataset)

Let’s simplify also the patients’ barcode column. The following R code will change the barcodes into BRCA1, BRCA2, …, OV1, OV2, …., etc

expr$bcr_patient_barcode <- paste0(expr$dataset, c(1:590, 1:561, 1:154))
expr
# A tibble: 1,305 x 7
   bcr_patient_barcode dataset     GATA3       PTEN      XBP1       ESR1      MUC1
                 
 1               BRCA1    BRCA  2.870500  1.3613571  2.983333  3.0842500  1.652125
 2               BRCA2    BRCA  2.166250  0.4283571  2.550833  2.3860000  3.080250
 3               BRCA3    BRCA  1.323500  1.3056429  3.020417  0.7912500  2.985250
 4               BRCA4    BRCA  1.841625  0.8096429  3.131333  2.4954167 -1.918500
 5               BRCA5    BRCA -6.025250  0.2508571 -1.451750 -4.8606667 -1.171500
 6               BRCA6    BRCA  1.804500  1.3107857  4.041083  2.7970000  3.529750
 7               BRCA7    BRCA -4.879250 -0.2369286 -0.724750 -4.4860833 -1.455750
 8               BRCA8    BRCA -3.143250 -1.2432143 -1.193083 -1.6274167 -0.986750
 9               BRCA9    BRCA  2.034000  1.2074286  2.278833  4.1155833  0.668000
10              BRCA10    BRCA -0.293125  0.2883571 -1.605083  0.4731667  0.011500
# ... with 1,295 more rows

The above (expr) dataset has been saved at https://raw.githubusercontent.com/kassambara/data/master/expr_tcga.txt. This data is required to practice the R code provided in this tutotial.

If you experience some issues in installing the RTCGA packages, You can simply load the data as follow:

expr <- read.delim("https://raw.githubusercontent.com/kassambara/data/master/expr_tcga.txt",
                   stringsAsFactors = FALSE)

Box plots

(ggplot2 way of creating box plot)

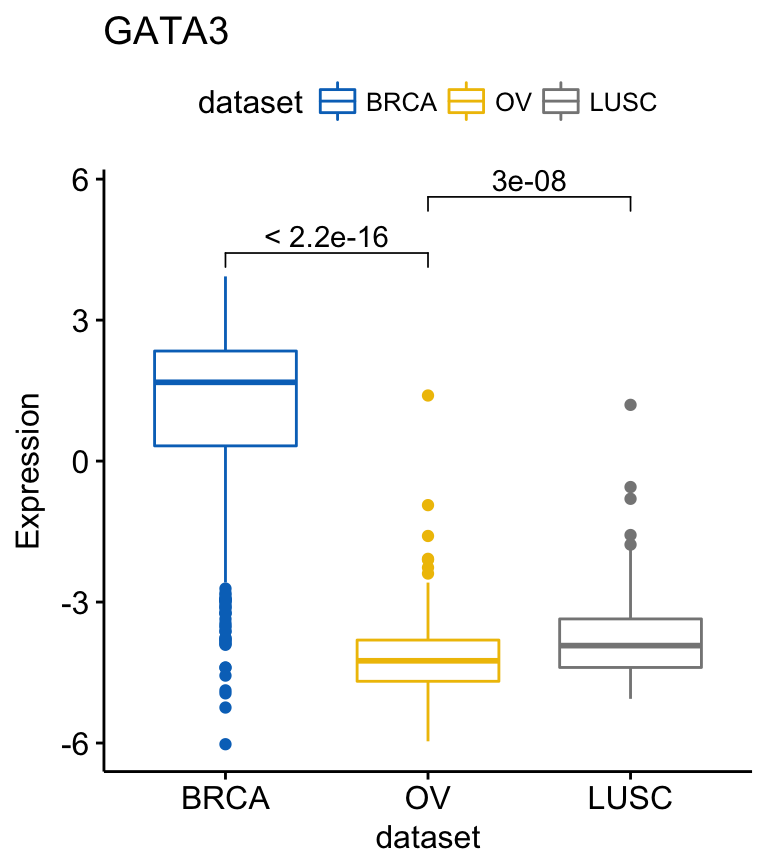
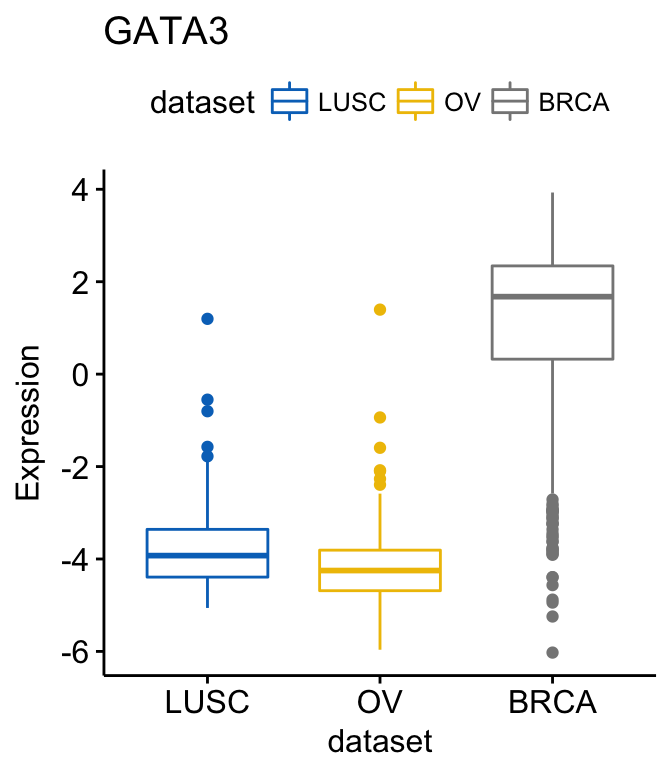
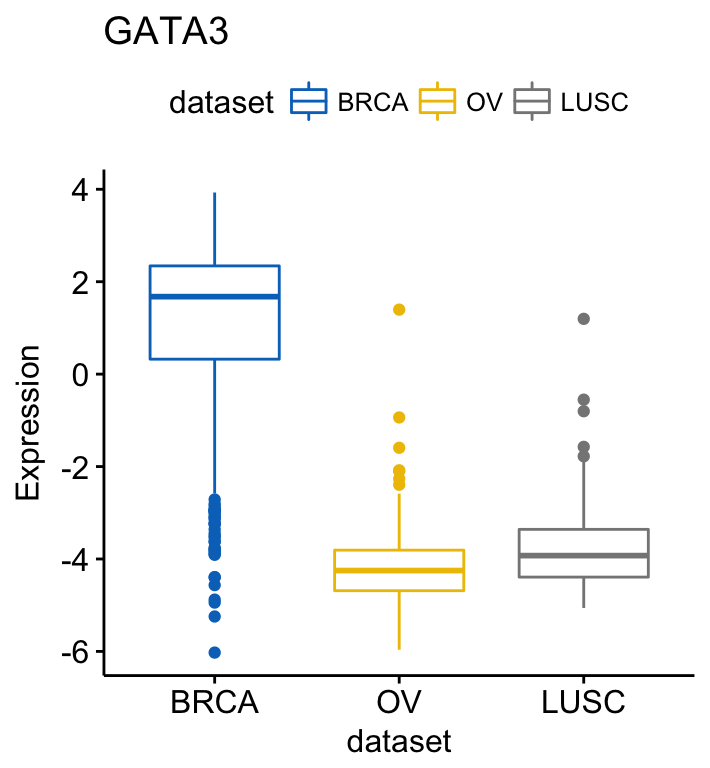
Create a box plot of a gene expression profile, colored by groups (here data set/cancer type):

library(ggpubr)
# GATA3
ggboxplot(expr, x = "dataset", y = "GATA3",
          title = "GATA3", ylab = "Expression",
          color = "dataset", palette = "jco")

# PTEN
ggboxplot(expr, x = "dataset", y = "PTEN",
          title = "PTEN", ylab = "Expression",
          color = "dataset", palette = "jco")
Exploratory Data visualization: Gene Expression DataExploratory Data visualization: Gene Expression Data

Exploratory Data visualization: Gene Expression Data

Note that, the argument palette is used to change color palettes. Allowed values include:

  • “grey” for grey color palettes;
  • brewer palettes e.g. “RdBu”, “Blues”, …;. To view all, type this in R: RColorBrewer::display.brewer.all() or click here to see all brewer palettes;
  • or custom color palettes e.g. c(“blue”, “red”) or c(“#00AFBB”, “#E7B800”);
  • and scientific journal palettes from the ggsci R package, e.g.: “npg”, “aaas”, “lancet”, “jco”, “ucscgb”, “uchicago”, “simpsons” and “rickandmorty”.

Instead of repeating the same R code for each gene, you can create a list of plots at once, as follow:

# Create a  list of plots
p <- ggboxplot(expr, x = "dataset", 
               y = c("GATA3", "PTEN", "XBP1"),
               title = c("GATA3", "PTEN", "XBP1"),
               ylab = "Expression", 
               color = "dataset", palette = "jco")

# View GATA3
p$GATA3

# View PTEN
p$PTEN

# View XBP1
p$XBP1

Note that, when the argument y contains multiple variables (here multiple gene names), then the arguments title, xlab and ylab can be also a character vector of same length as y.

To add p-values and significance levels to the boxplots, read our previous article: Add P-values and Significance Levels to ggplots. Briefly, you can do this:

my_comparisons <- list(c("BRCA", "OV"), c("OV", "LUSC"))
ggboxplot(expr, x = "dataset", y = "GATA3",
          title = "GATA3", ylab = "Expression",
          color = "dataset", palette = "jco")+
  stat_compare_means(comparisons = my_comparisons)
Exploratory Data visualization: Gene Expression Data

Exploratory Data visualization: Gene Expression Data

For each of the genes, you can compare the different groups as follow:

compare_means(c(GATA3, PTEN, XBP1) ~ dataset, data = expr)
# A tibble: 9 x 8
     .y. group1 group2             p         p.adj p.format p.signif   method
  
1  GATA3   BRCA     OV 1.111768e-177 3.335304e-177  < 2e-16     **** Wilcoxon
2  GATA3   BRCA   LUSC  6.684016e-73  1.336803e-72  < 2e-16     **** Wilcoxon
3  GATA3     OV   LUSC  2.965702e-08  2.965702e-08  3.0e-08     **** Wilcoxon
4   PTEN   BRCA     OV  6.791940e-05  6.791940e-05  6.8e-05     **** Wilcoxon
5   PTEN   BRCA   LUSC  1.042830e-16  3.128489e-16  < 2e-16     **** Wilcoxon
6   PTEN     OV   LUSC  1.280576e-07  2.561153e-07  1.3e-07     **** Wilcoxon
7   XBP1   BRCA     OV 2.551228e-123 7.653685e-123  < 2e-16     **** Wilcoxon
8   XBP1   BRCA   LUSC  1.950162e-42  3.900324e-42  < 2e-16     **** Wilcoxon
9   XBP1     OV   LUSC  4.239570e-11  4.239570e-11  4.2e-11     **** Wilcoxon

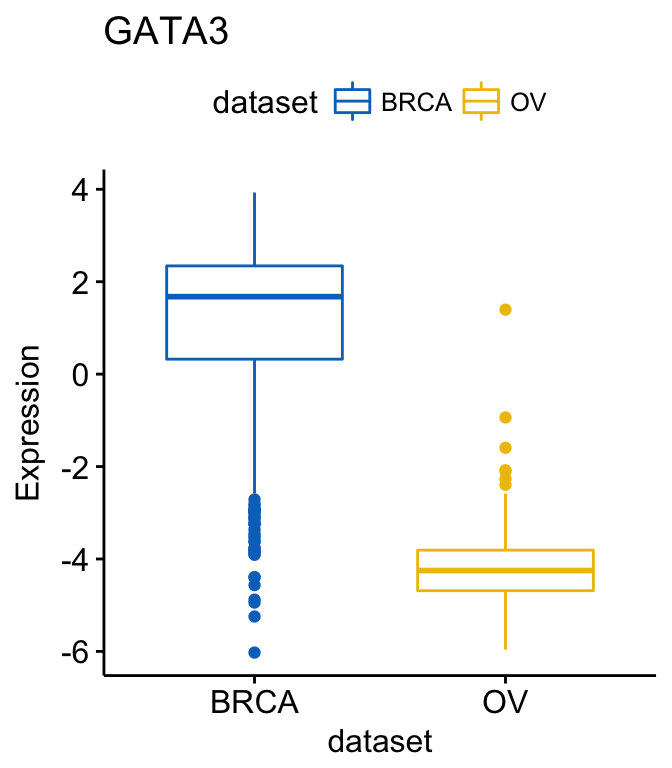
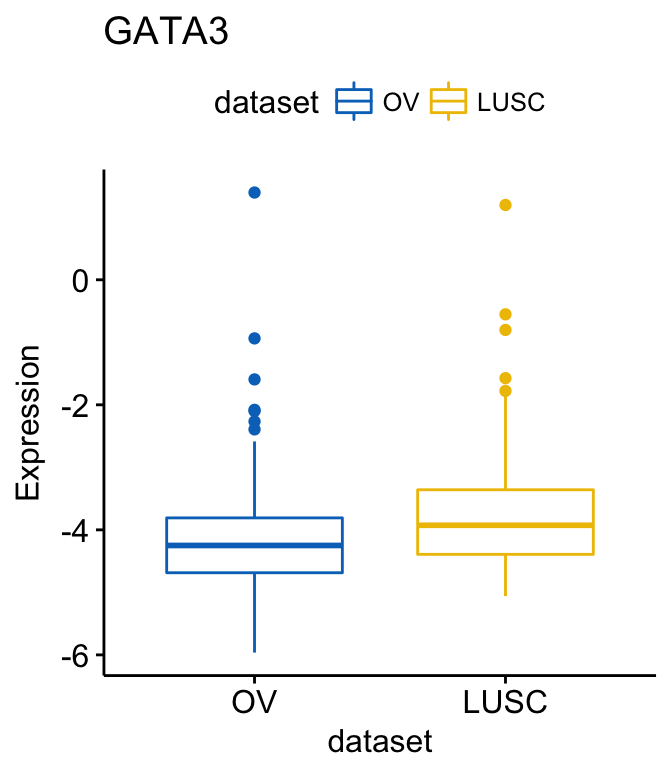
If you want to select items (here cancer types) to display or to remove a particular item from the plot, use the argument select or remove, as follow:

# Select BRCA and OV cancer types
ggboxplot(expr, x = "dataset", y = "GATA3",
          title = "GATA3", ylab = "Expression",
          color = "dataset", palette = "jco",
          select = c("BRCA", "OV"))

# or remove BRCA
ggboxplot(expr, x = "dataset", y = "GATA3",
          title = "GATA3", ylab = "Expression",
          color = "dataset", palette = "jco",
          remove = "BRCA")
Exploratory Data visualization: Gene Expression DataExploratory Data visualization: Gene Expression Data

Exploratory Data visualization: Gene Expression Data

To change the order of the data sets on x axis, use the argument order. For example order = c(“LUSC”, “OV”, “BRCA”):

# Order data sets
ggboxplot(expr, x = "dataset", y = "GATA3",
          title = "GATA3", ylab = "Expression",
          color = "dataset", palette = "jco",
          order = c("LUSC", "OV", "BRCA"))
Exploratory Data visualization: Gene Expression Data

Exploratory Data visualization: Gene Expression Data

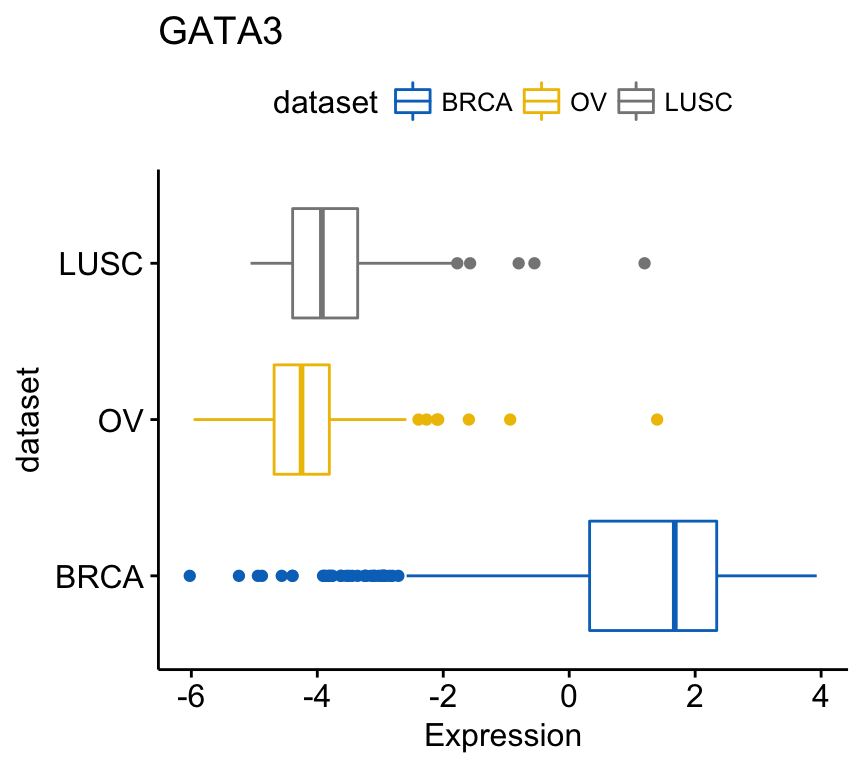
To create horizontal plots, use the argument rotate = TRUE:

ggboxplot(expr, x = "dataset", y = "GATA3",
          title = "GATA3", ylab = "Expression",
          color = "dataset", palette = "jco",
          rotate = TRUE)
Exploratory Data visualization: Gene Expression Data

Exploratory Data visualization: Gene Expression Data

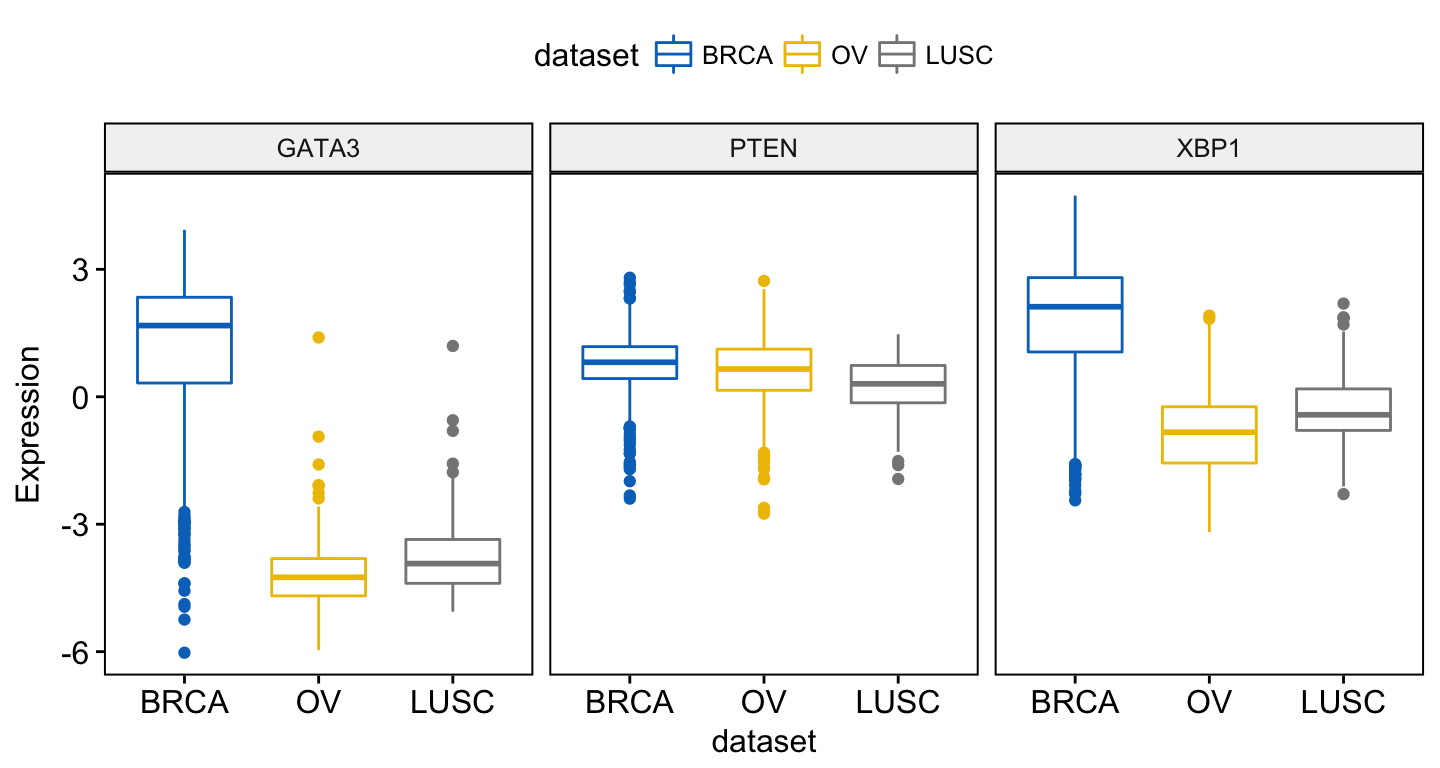
To combine the three gene expression plots into a multi-panel plot, use the argument combine = TRUE:

ggboxplot(expr, x = "dataset",
          y = c("GATA3", "PTEN", "XBP1"),
          combine = TRUE,
          ylab = "Expression",
          color = "dataset", palette = "jco")
Exploratory Data visualization: Gene Expression Data

Exploratory Data visualization: Gene Expression Data

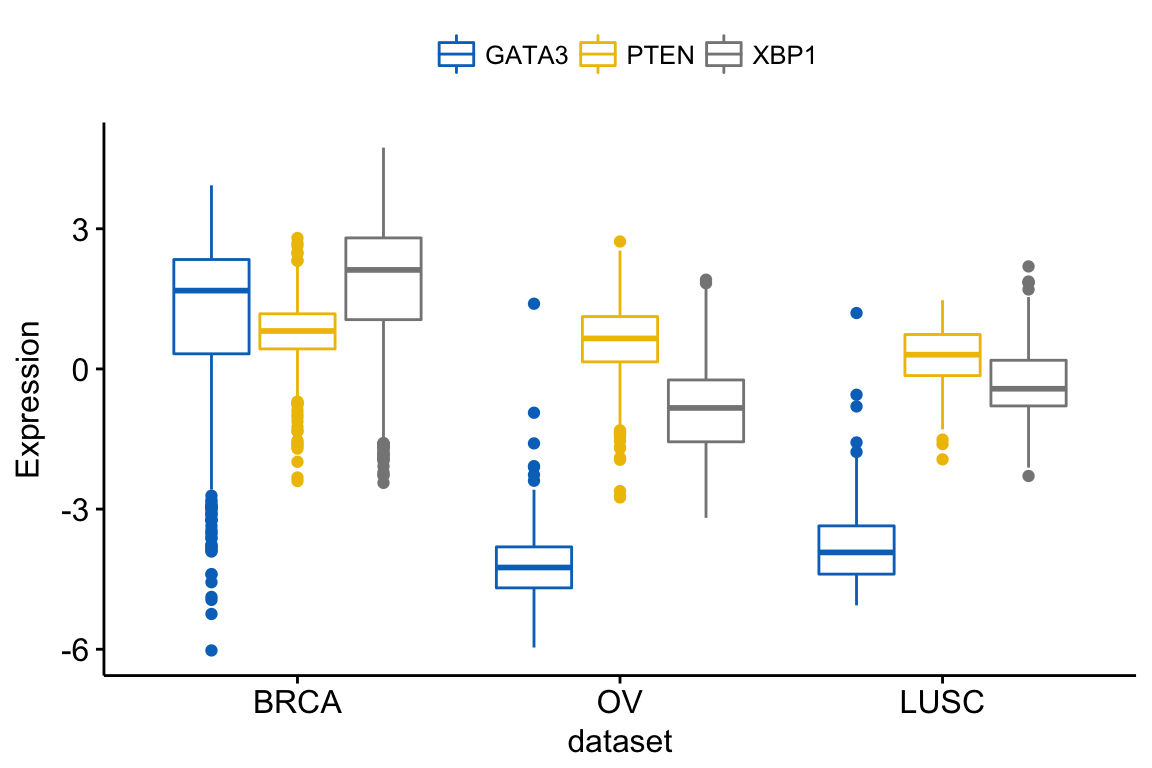
You can also merge the 3 plots using the argument merge = TRUE or merge = “asis”:

ggboxplot(expr, x = "dataset",
          y = c("GATA3", "PTEN", "XBP1"),
          merge = TRUE,
          ylab = "Expression", 
          palette = "jco")
Exploratory Data visualization: Gene Expression Data

Exploratory Data visualization: Gene Expression Data

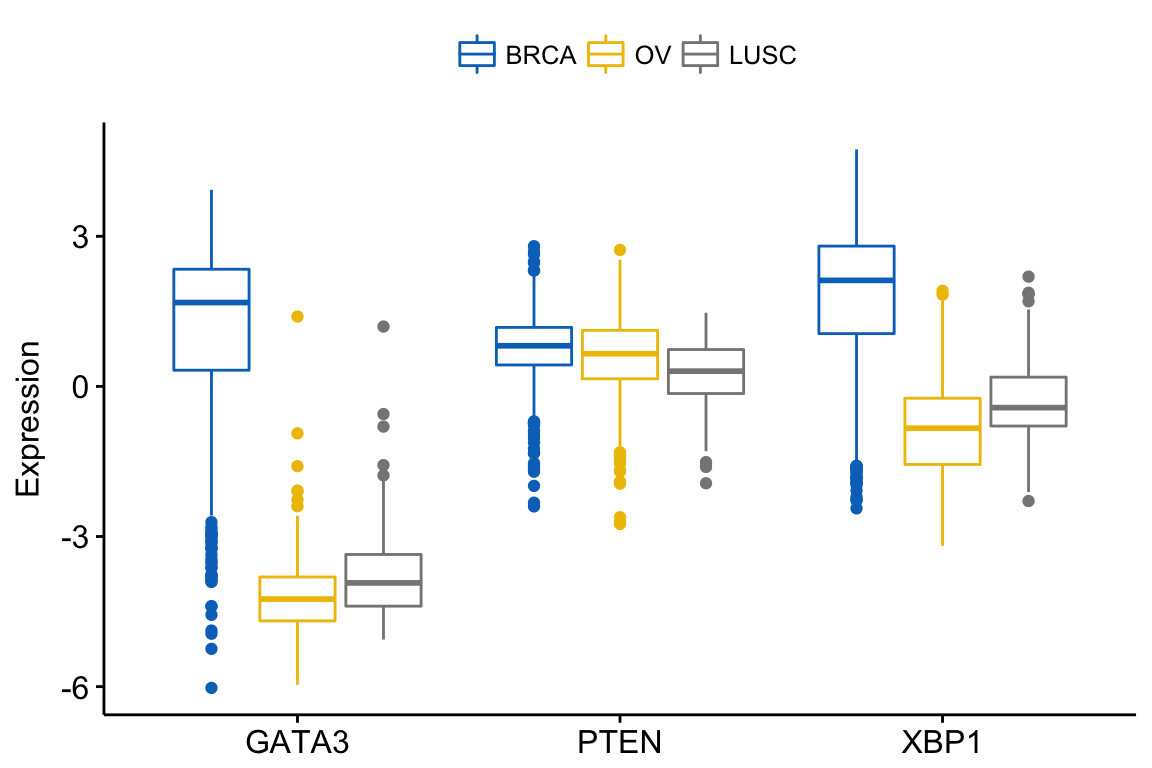
In the plot above, It’s easy to visually compare the expression level of the different genes in each cancer type.

But you might want to put genes (y variables) on x axis, in order to compare the expression level in the different cell subpopulations.

In this situation, the y variables (i.e.: genes) become x tick labels and the x variable (i.e.: dataset) becomes the grouping variable. To do this, use the argument merge = “flip”.

ggboxplot(expr, x = "dataset",
          y = c("GATA3", "PTEN", "XBP1"),
          merge = "flip",
          ylab = "Expression", 
          palette = "jco")
Exploratory Data visualization: Gene Expression Data

Exploratory Data visualization: Gene Expression Data

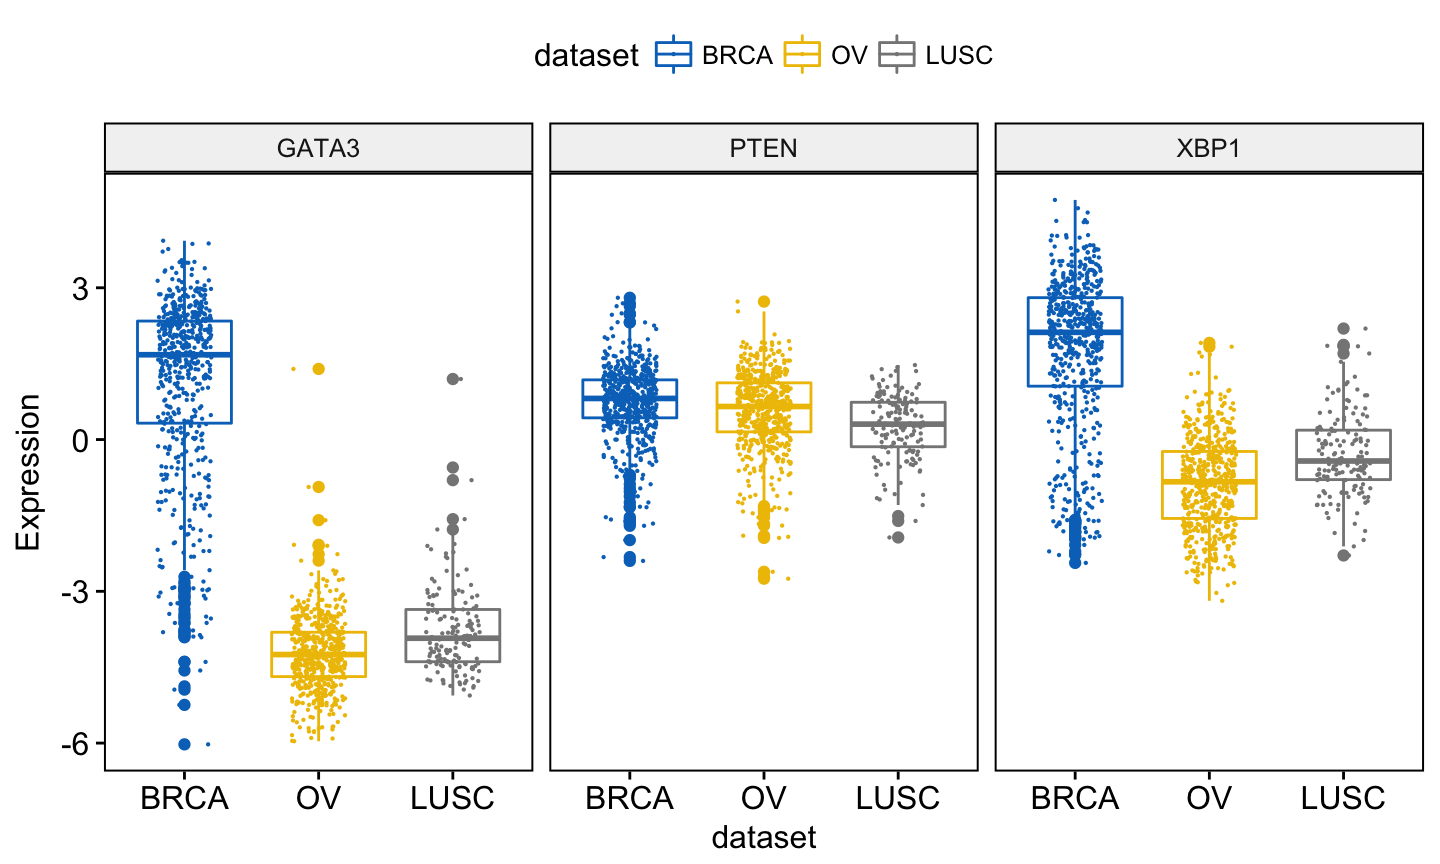
You might want to add jittered points on the boxplot. Each point correspond to individual observations. To add jittered points, use the argument add = “jitter” as follow. To customize the added elements, specify the argument add.params.

ggboxplot(expr, x = "dataset",
          y = c("GATA3", "PTEN", "XBP1"),
          combine = TRUE,
          color = "dataset", palette = "jco",
          ylab = "Expression", 
          add = "jitter",                              # Add jittered points
          add.params = list(size = 0.1, jitter = 0.2)  # Point size and the amount of jittering
          )
Exploratory Data visualization: Gene Expression Data

Exploratory Data visualization: Gene Expression Data

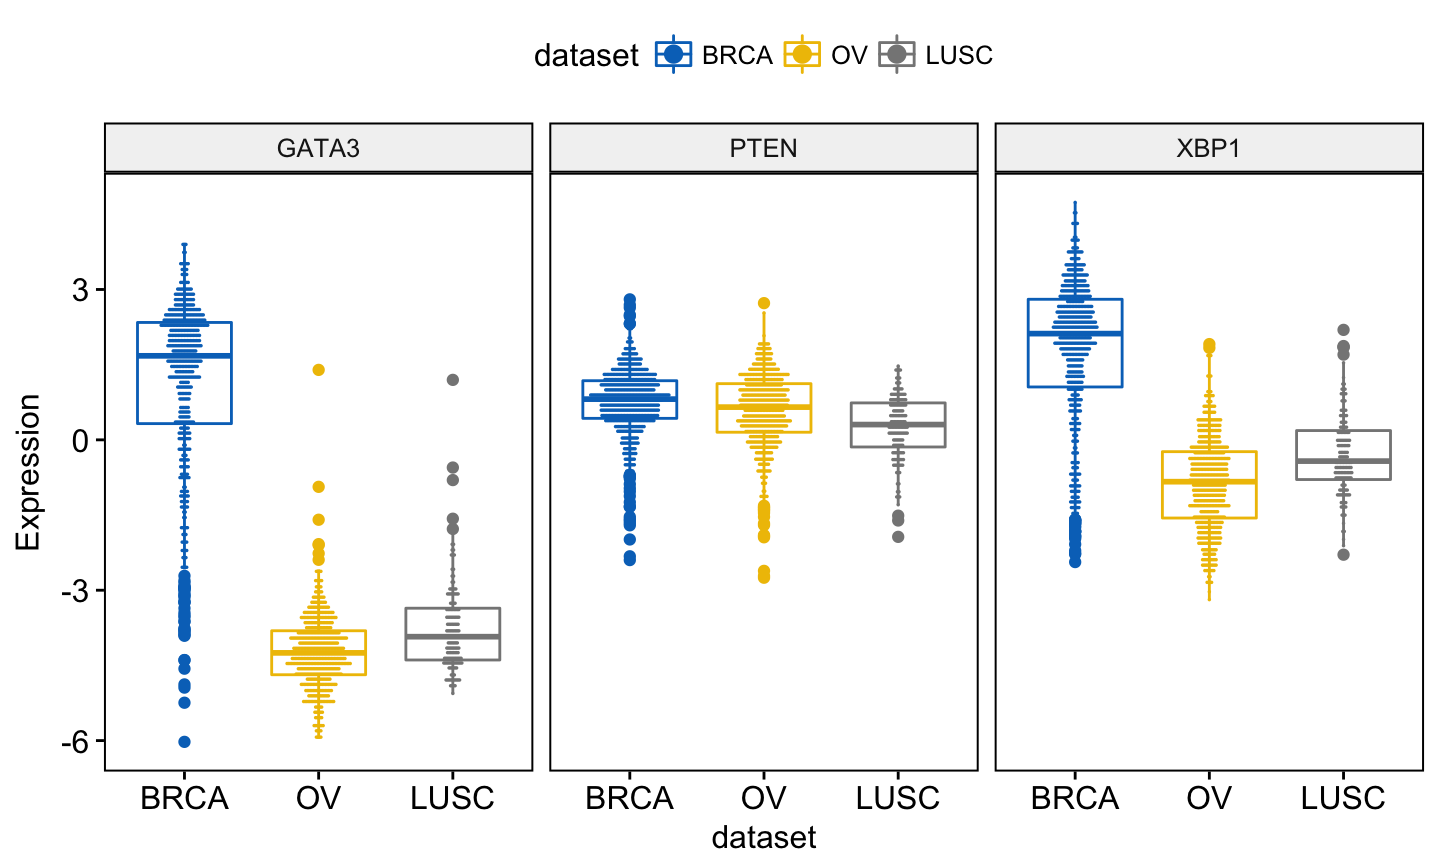
Note that, when using ggboxplot() sensible values for the argument add are one of c(“jitter”, “dotplot”). If you decide to use add = “dotplot”, you can adjust dotsize and binwidth wen you have a strong dense dotplot. Read more about binwidth.

You can add and adjust a dotplot as follow:

ggboxplot(expr, x = "dataset",
          y = c("GATA3", "PTEN", "XBP1"),
          combine = TRUE,
          color = "dataset", palette = "jco",
          ylab = "Expression", 
          add = "dotplot",                              # Add dotplot
          add.params = list(binwidth = 0.1, dotsize = 0.3)
          )
Exploratory Data visualization: Gene Expression Data

Exploratory Data visualization: Gene Expression Data

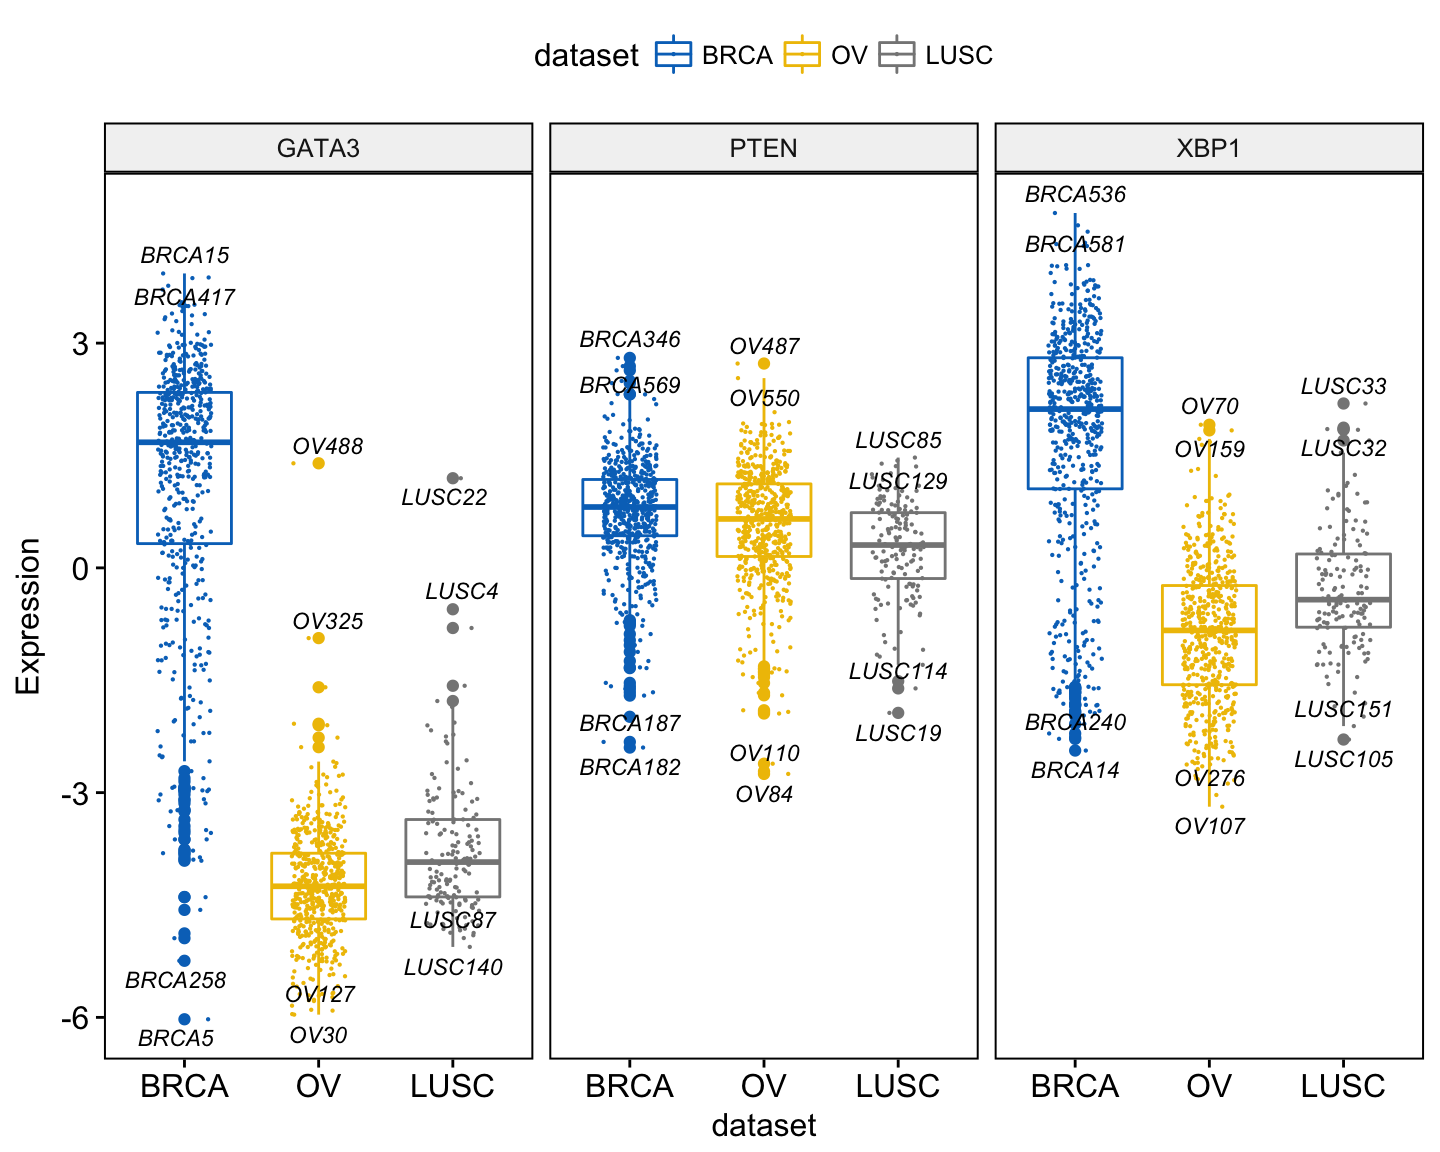
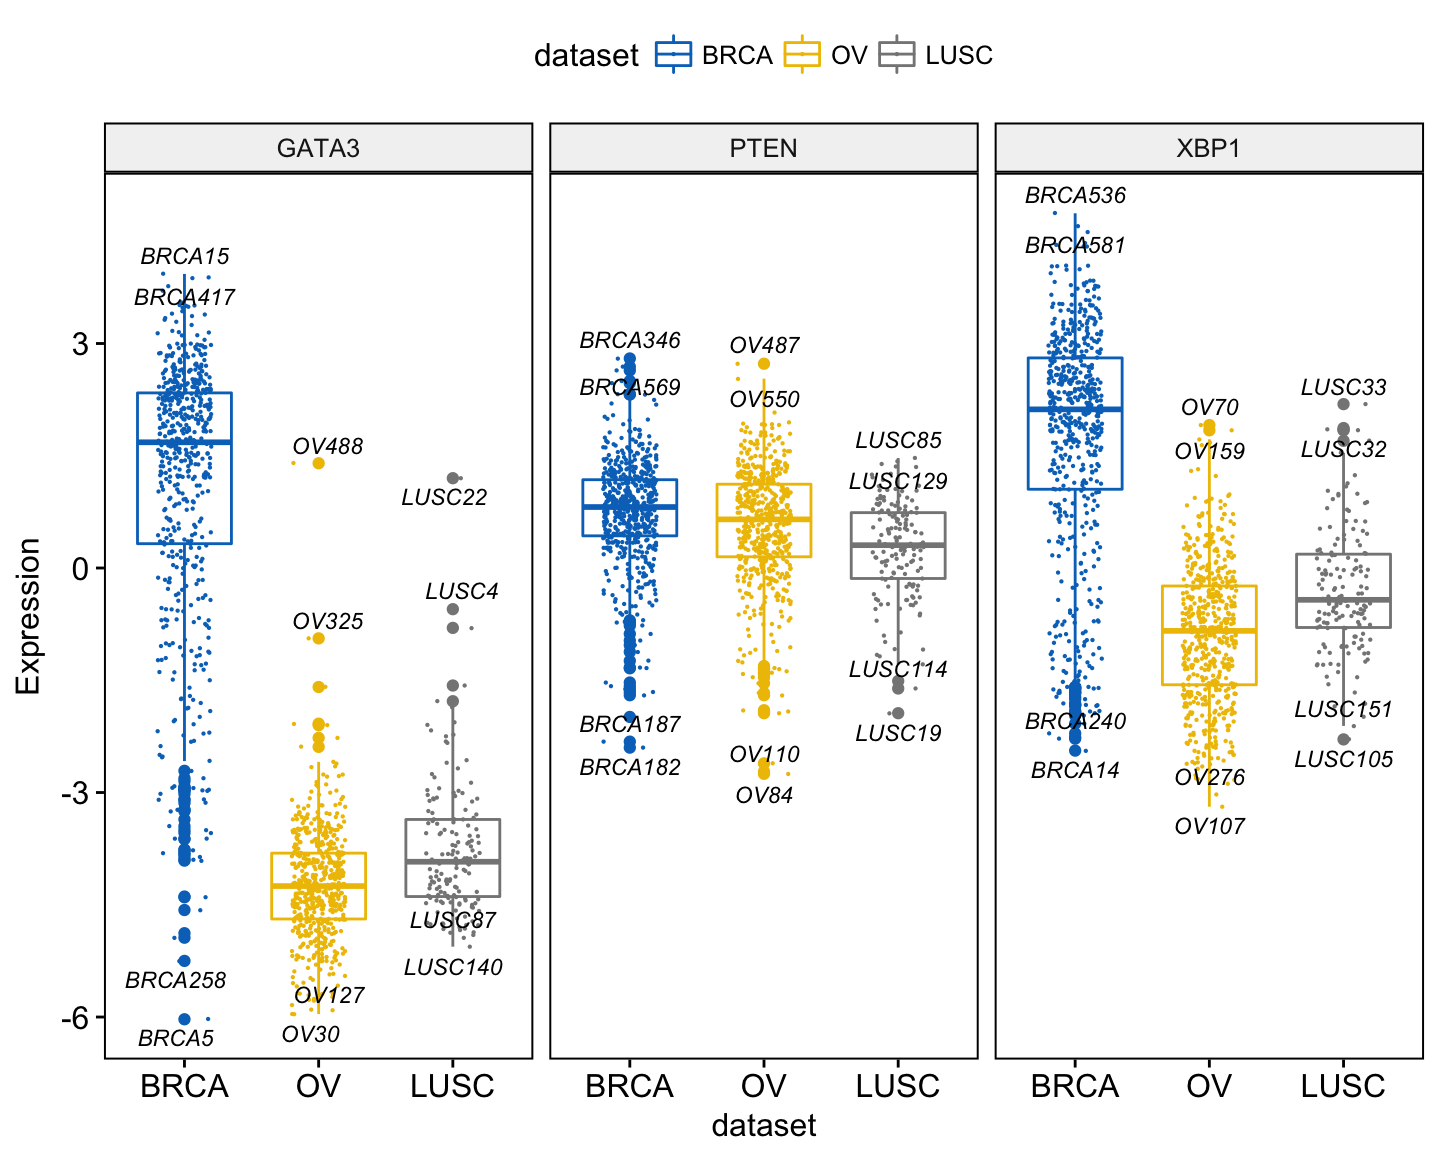
You might want to label the boxplot by showing the names of samples with the top n highest or lowest values. In this case, you can use the following arguments:

  • label: the name of the column containing point labels.
  • label.select: can be of two formats:
    • a character vector specifying some labels to show.
    • a list containing one or the combination of the following components:
      • top.up and top.down: to display the labels of the top up/down points. For example, label.select = list(top.up = 10, top.down = 4).
      • criteria: to filter, for example, by x and y variables values, use this: label.select = list(criteria = “`y` > 3.9 & `y` < 5 & `x` %in% c(‘BRCA’, ‘OV’)”).

For example:

ggboxplot(expr, x = "dataset",
          y = c("GATA3", "PTEN", "XBP1"),
          combine = TRUE,
          color = "dataset", palette = "jco",
          ylab = "Expression", 
          add = "jitter",                               # Add jittered points
          add.params = list(size = 0.1, jitter = 0.2),  # Point size and the amount of jittering
          label = "bcr_patient_barcode",                # column containing point labels
          label.select = list(top.up = 2, top.down = 2),# Select some labels to display
          font.label = list(size = 9, face = "italic"), # label font
          repel = TRUE                                  # Avoid label text overplotting
          )
Exploratory Data visualization: Gene Expression Data

Exploratory Data visualization: Gene Expression Data

A complex criteria for labeling can be specified as follow:

label.select.criteria <- list(criteria = "`y` > 3.9 & `x` %in% c('BRCA', 'OV')")
ggboxplot(expr, x = "dataset",
          y = c("GATA3", "PTEN", "XBP1"),
          combine = TRUE,
          color = "dataset", palette = "jco",
          ylab = "Expression", 
          label = "bcr_patient_barcode",              # column containing point labels
          label.select = label.select.criteria,       # Select some labels to display
          font.label = list(size = 9, face = "italic"), # label font
          repel = TRUE                                # Avoid label text overplotting
          )

Other types of plots, with the same arguments as the function ggboxplot(), are available, such as stripchart and violin plots.

Violin plots

(ggplot2 way of creating violin plot)

The following R code draws violin plots with box plots inside:

ggviolin(expr, x = "dataset",
          y = c("GATA3", "PTEN", "XBP1"),
          combine = TRUE, 
          color = "dataset", palette = "jco",
          ylab = "Expression", 
          add = "boxplot")
Exploratory Data visualization: Gene Expression Data

Exploratory Data visualization: Gene Expression Data

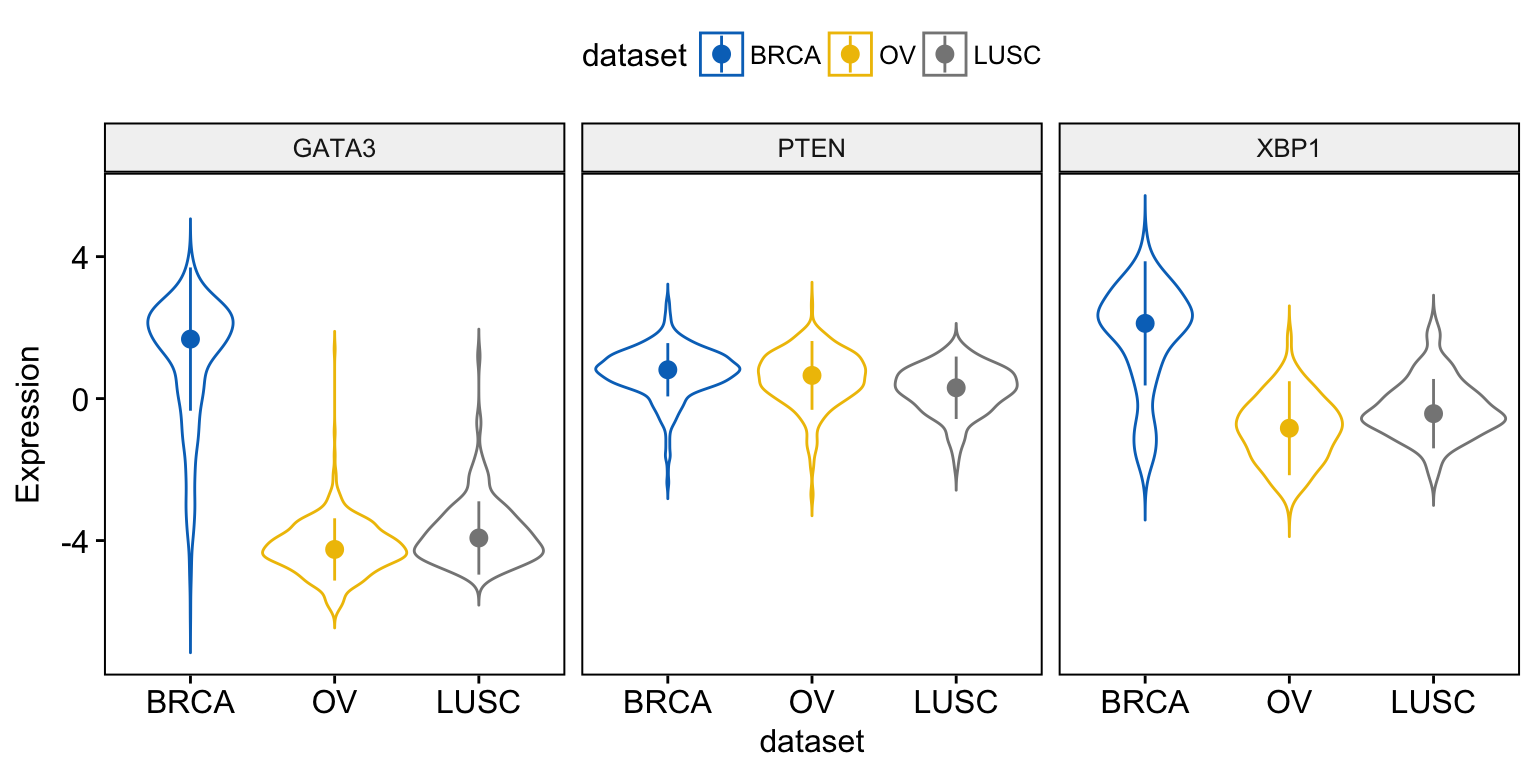
Instead of adding a box plot inside the violin plot, you can add the median + interquantile range as follow:

ggviolin(expr, x = "dataset",
          y = c("GATA3", "PTEN", "XBP1"),
          combine = TRUE, 
          color = "dataset", palette = "jco",
          ylab = "Expression", 
          add = "median_iqr")
Exploratory Data visualization: Gene Expression Data

Exploratory Data visualization: Gene Expression Data

When using the function ggviolin(), sensible values for the argument add include: “mean”, “mean_se”, “mean_sd”, “mean_ci”, “mean_range”, “median”, “median_iqr”, “median_mad”, “median_range”.

You can also add “jitter” points and “dotplot” inside the violin plot as described previously in the box plot section.

Stripcharts and dot plots

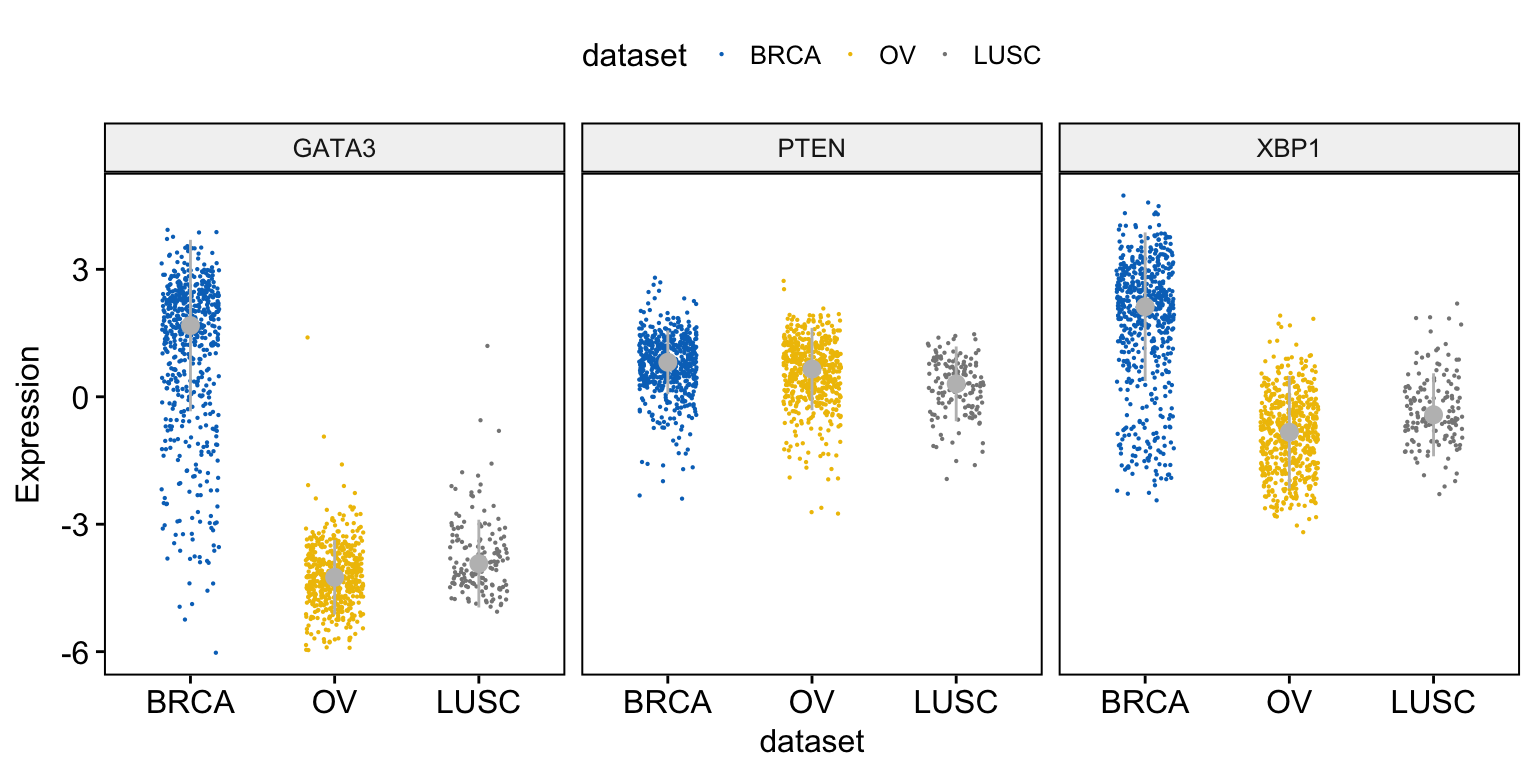
To draw a stripchart, type this:

ggstripchart(expr, x = "dataset",
             y = c("GATA3", "PTEN", "XBP1"),
             combine = TRUE, 
             color = "dataset", palette = "jco",
             size = 0.1, jitter = 0.2,
             ylab = "Expression", 
             add = "median_iqr",
             add.params = list(color = "gray"))
Exploratory Data visualization: Gene Expression Data

Exploratory Data visualization: Gene Expression Data

(ggplot2 way of creating stripcharts)

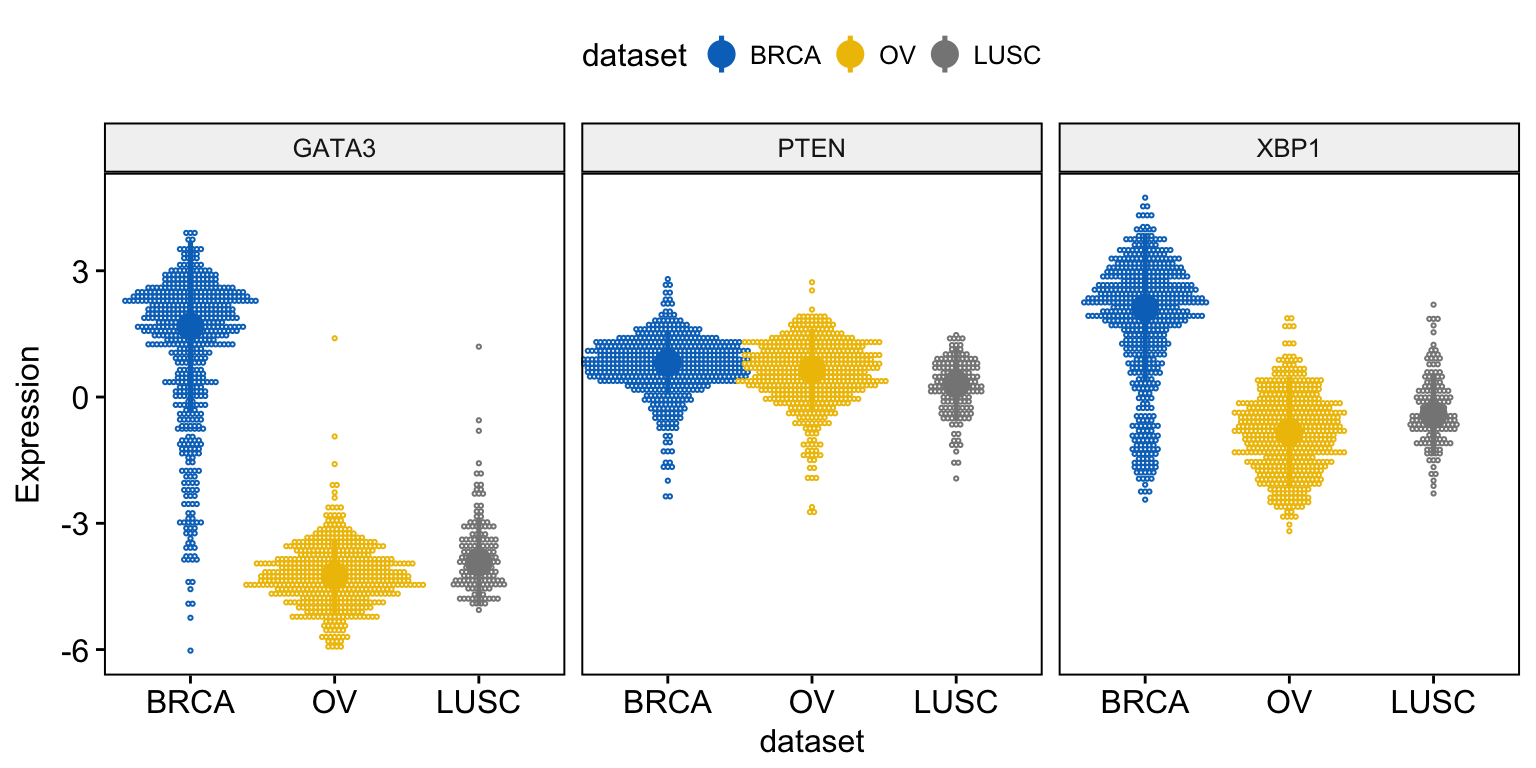
For a dot plot, use this:

ggdotplot(expr, x = "dataset",
          y = c("GATA3", "PTEN", "XBP1"),
          combine = TRUE, 
          color = "dataset", palette = "jco",
          fill = "white",
          binwidth = 0.1,
          ylab = "Expression", 
          add = "median_iqr",
          add.params = list(size = 0.9))
Exploratory Data visualization: Gene Expression Data

Exploratory Data visualization: Gene Expression Data

(ggplot2 way of creating dot plots)

Density plots

(ggplot2 way of creating density plots)

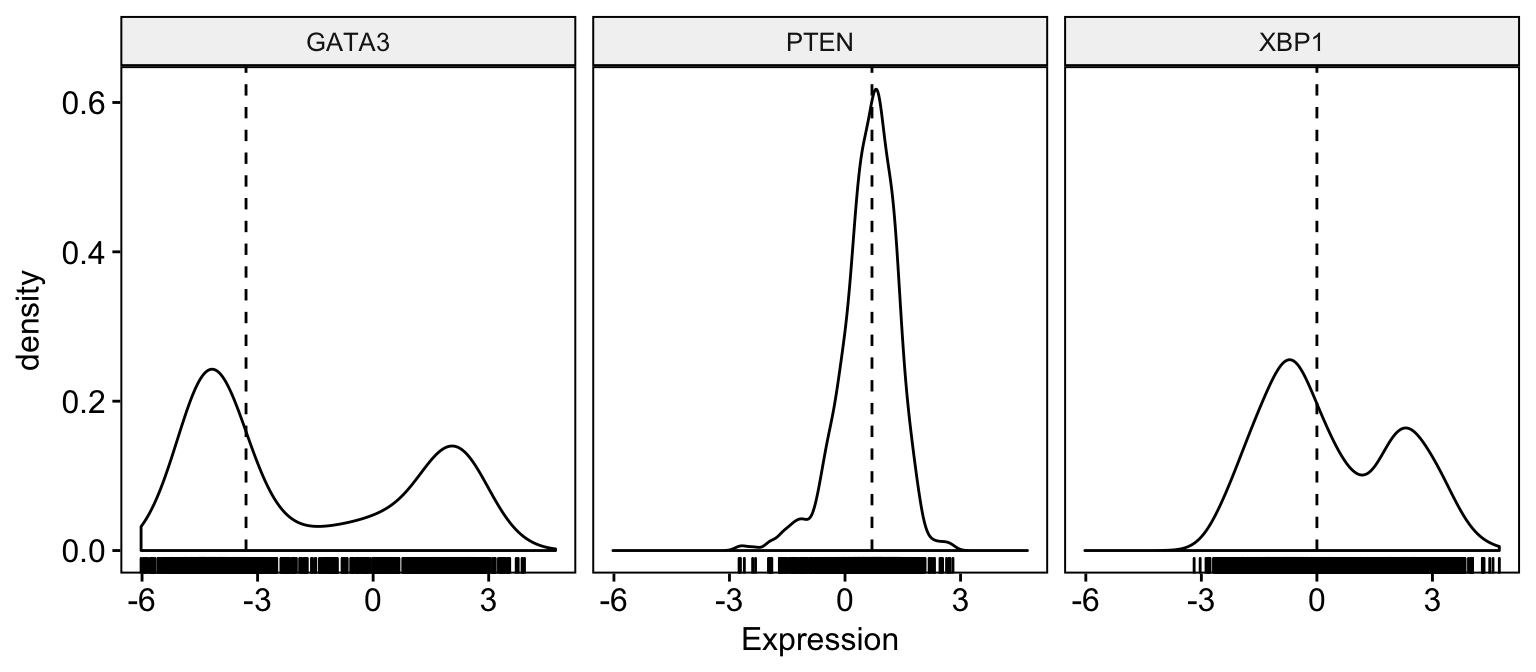
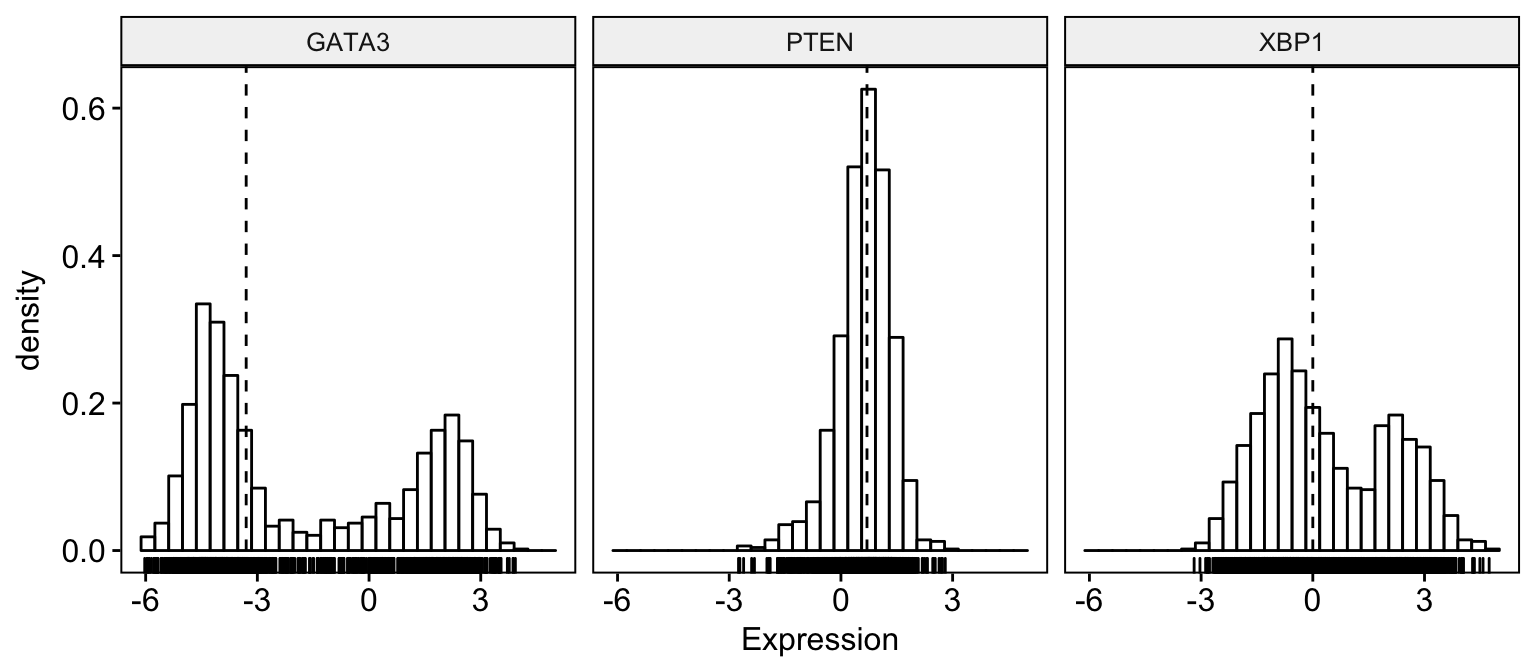
To visualize the distribution as a density plot, use the function ggdensity() as follow:

# Basic density plot
ggdensity(expr,
       x = c("GATA3", "PTEN",  "XBP1"),
       y = "..density..",
       combine = TRUE,                  # Combine the 3 plots
       xlab = "Expression", 
       add = "median",                  # Add median line. 
       rug = TRUE                       # Add marginal rug
)
Exploratory Data visualization: Gene Expression Data

Exploratory Data visualization: Gene Expression Data

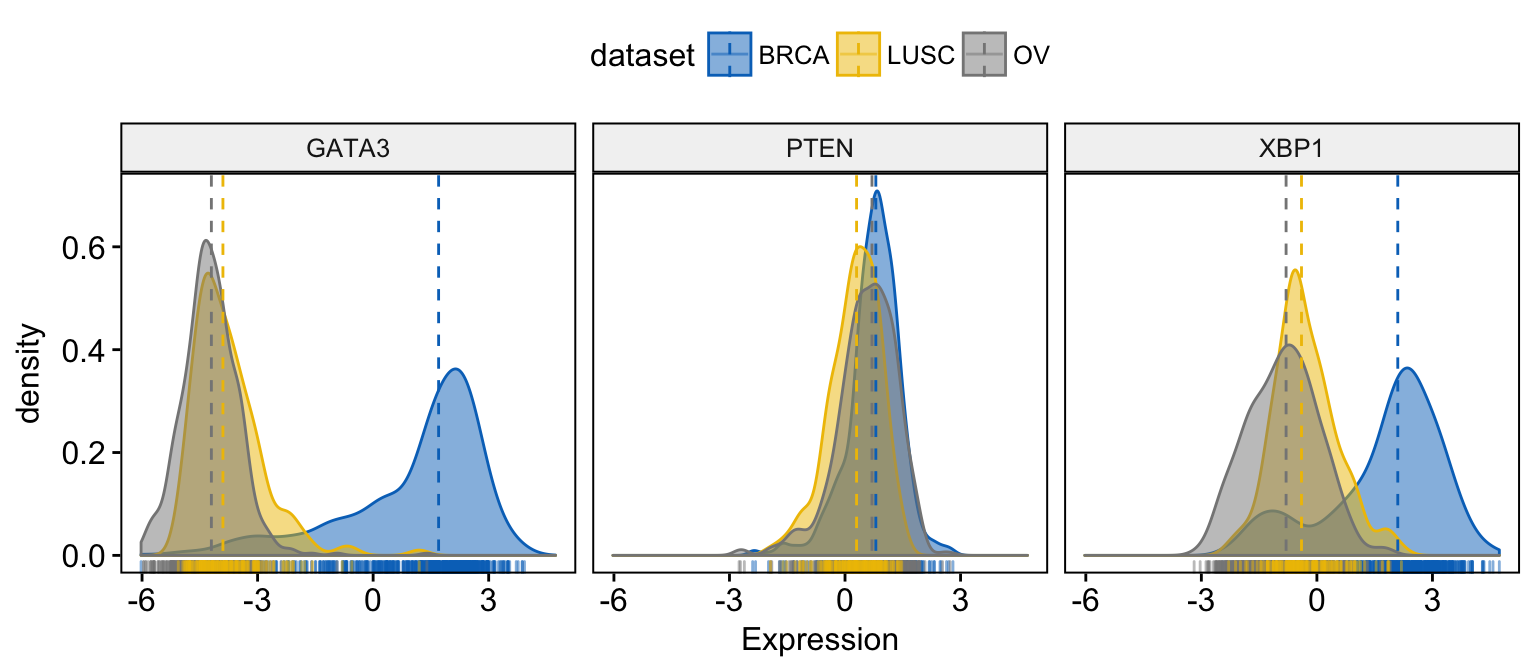
# Change color and fill by dataset
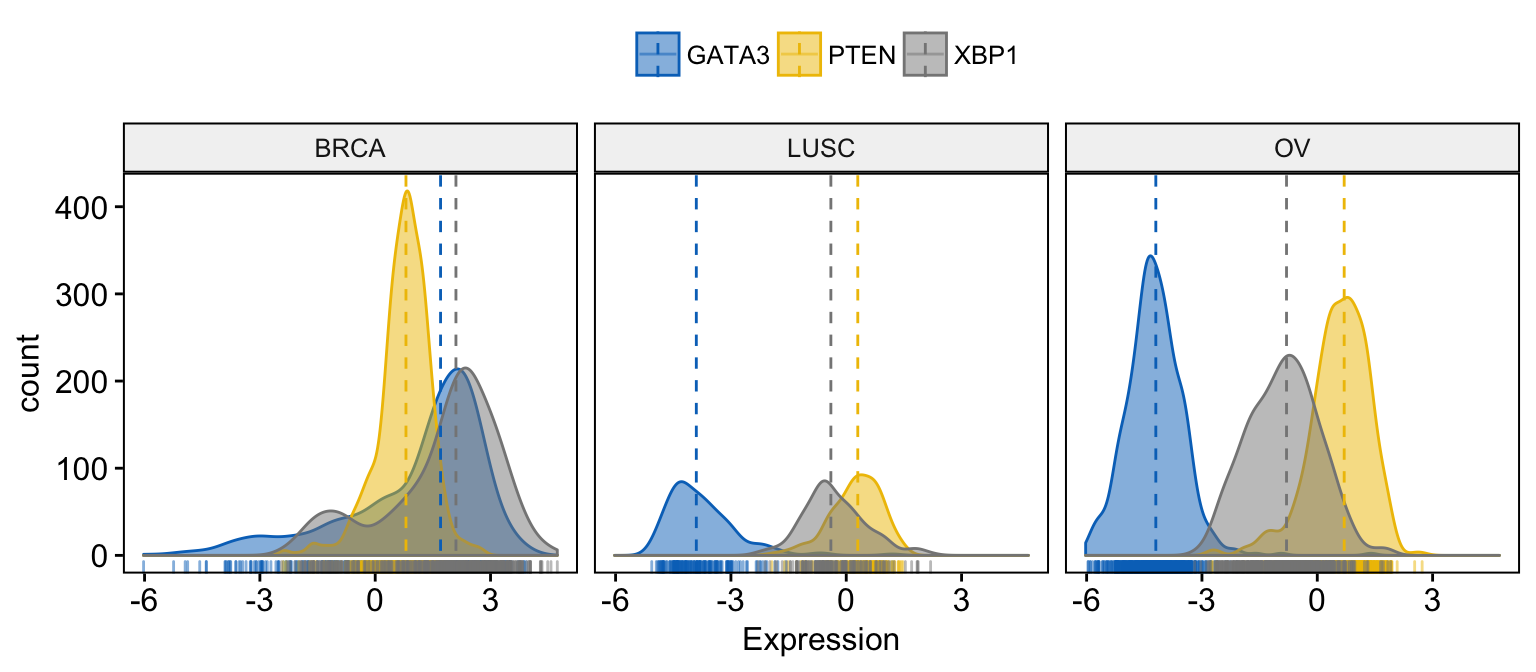
ggdensity(expr,
       x = c("GATA3", "PTEN",  "XBP1"),
       y = "..density..",
       combine = TRUE,                  # Combine the 3 plots
       xlab = "Expression", 
       add = "median",                  # Add median line. 
       rug = TRUE,                      # Add marginal rug
       color = "dataset", 
       fill = "dataset",
       palette = "jco"
)
Exploratory Data visualization: Gene Expression Data

Exploratory Data visualization: Gene Expression Data

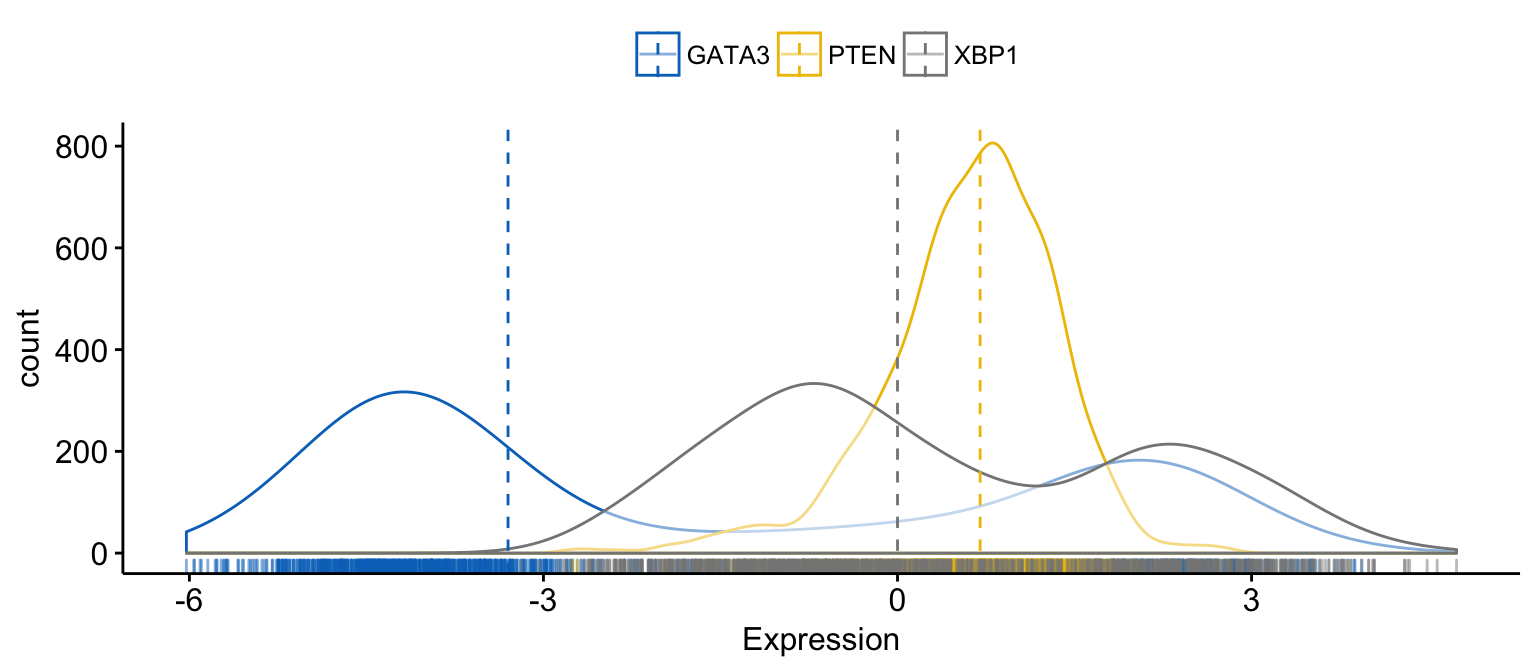
# Merge the 3 plots
# and use y = "..count.." instead of "..density.."
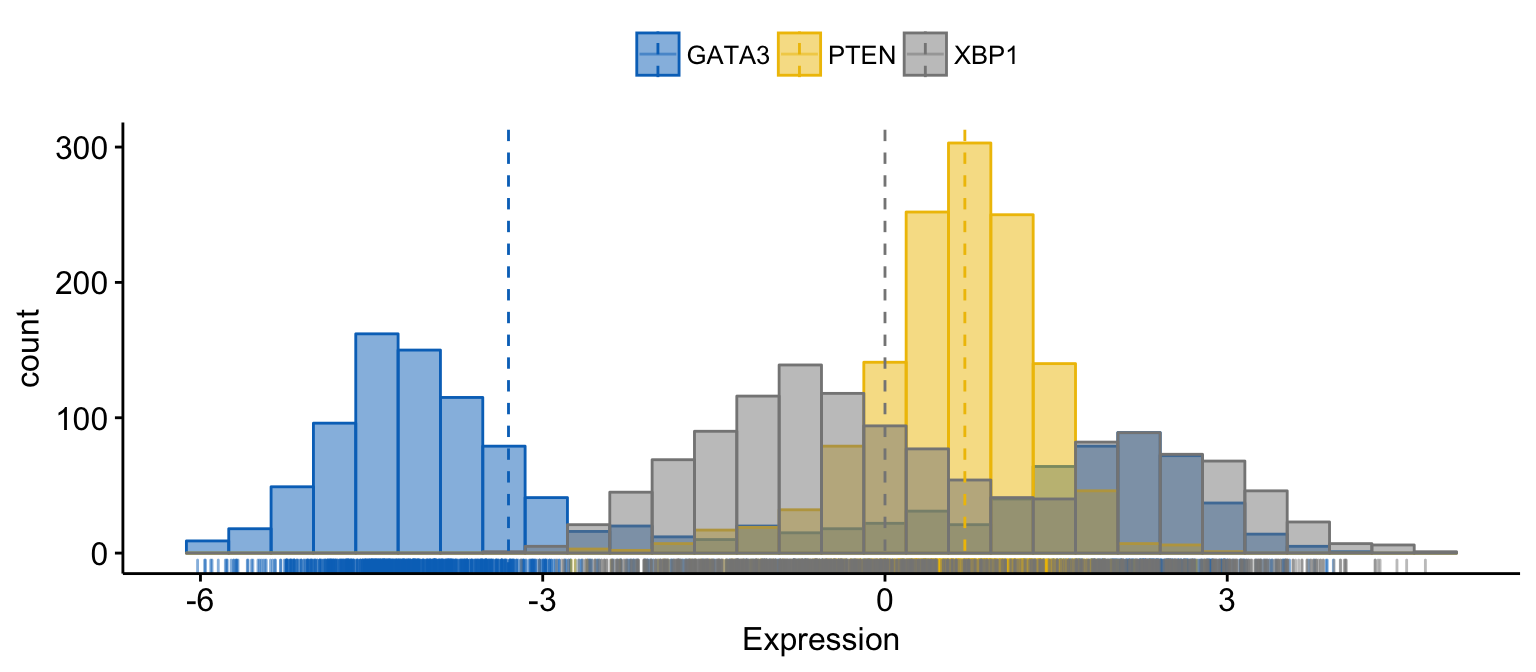
ggdensity(expr,
       x = c("GATA3", "PTEN",  "XBP1"),
       y = "..count..",
       merge = TRUE,                    # Merge the 3 plots
       xlab = "Expression", 
       add = "median",                  # Add median line. 
       rug = TRUE ,                     # Add marginal rug
       palette = "jco"                  # Change color palette
)
Exploratory Data visualization: Gene Expression Data

Exploratory Data visualization: Gene Expression Data

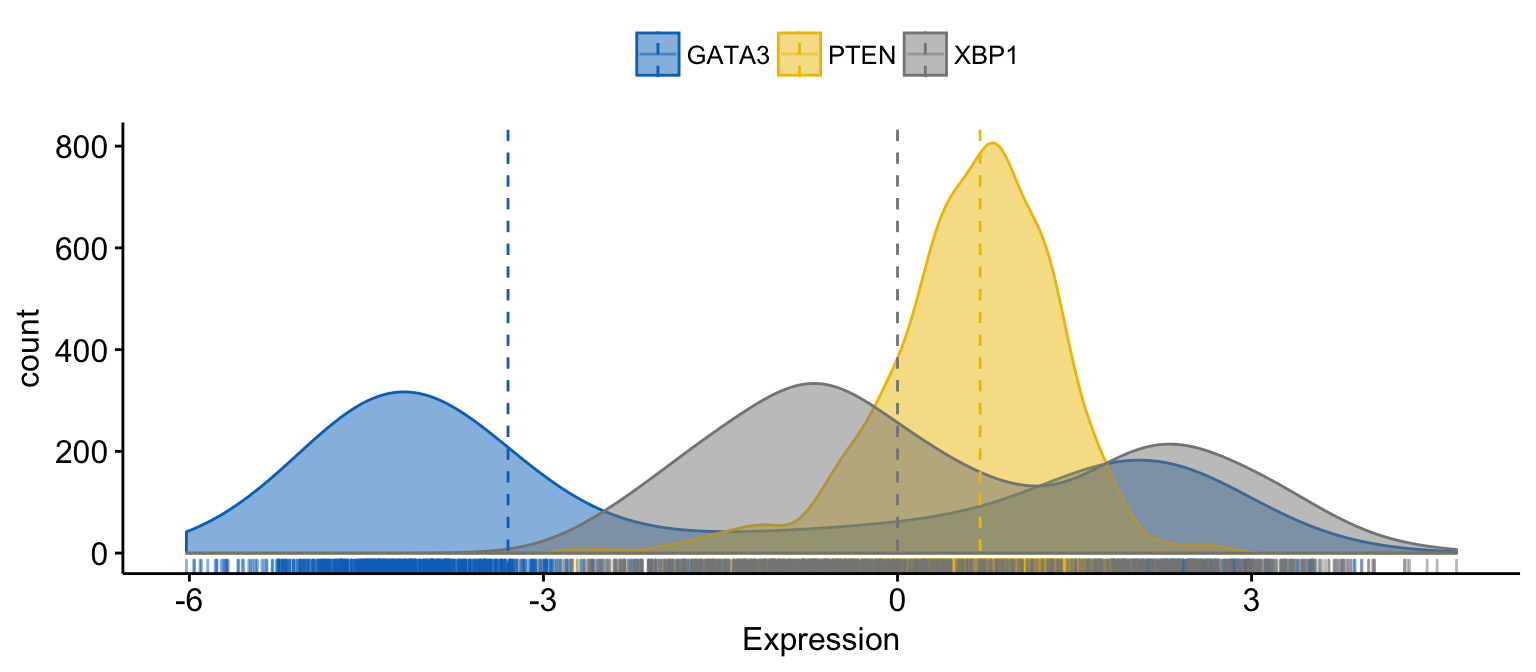
# color and fill by x variables
ggdensity(expr,
       x = c("GATA3", "PTEN",  "XBP1"),
       y = "..count..",
       color = ".x.", fill = ".x.",     # color and fill by x variables
       merge = TRUE,                    # Merge the 3 plots
       xlab = "Expression", 
       add = "median",                  # Add median line. 
       rug = TRUE ,                     # Add marginal rug
       palette = "jco"                  # Change color palette
)
Exploratory Data visualization: Gene Expression Data

Exploratory Data visualization: Gene Expression Data

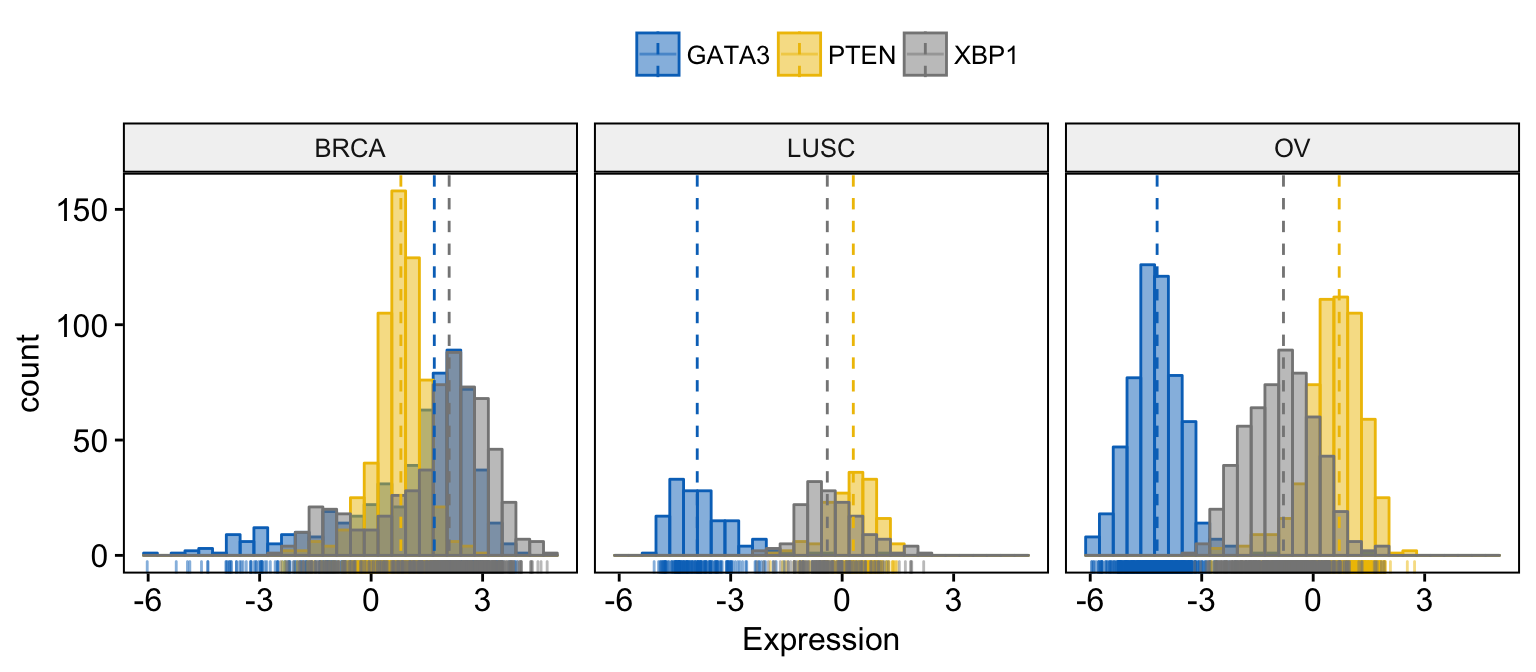
# Facet by "dataset"
ggdensity(expr,
       x = c("GATA3", "PTEN",  "XBP1"),
       y = "..count..",
       color = ".x.", fill = ".x.", 
       facet.by = "dataset",            # Split by "dataset" into multi-panel
       merge = TRUE,                    # Merge the 3 plots
       xlab = "Expression", 
       add = "median",                  # Add median line. 
       rug = TRUE ,                     # Add marginal rug
       palette = "jco"                  # Change color palette
)
Exploratory Data visualization: Gene Expression Data

Exploratory Data visualization: Gene Expression Data

Histogram plots

(ggplot2 way of creating histogram plots)

To visualize the distribution as a histogram plot, use the function gghistogram() as follow:

# Basic histogram plot 
gghistogram(expr,
       x = c("GATA3", "PTEN",  "XBP1"),
       y = "..density..",
       combine = TRUE,                  # Combine the 3 plots
       xlab = "Expression", 
       add = "median",                  # Add median line. 
       rug = TRUE                       # Add marginal rug
)
Exploratory Data visualization: Gene Expression Data

Exploratory Data visualization: Gene Expression Data

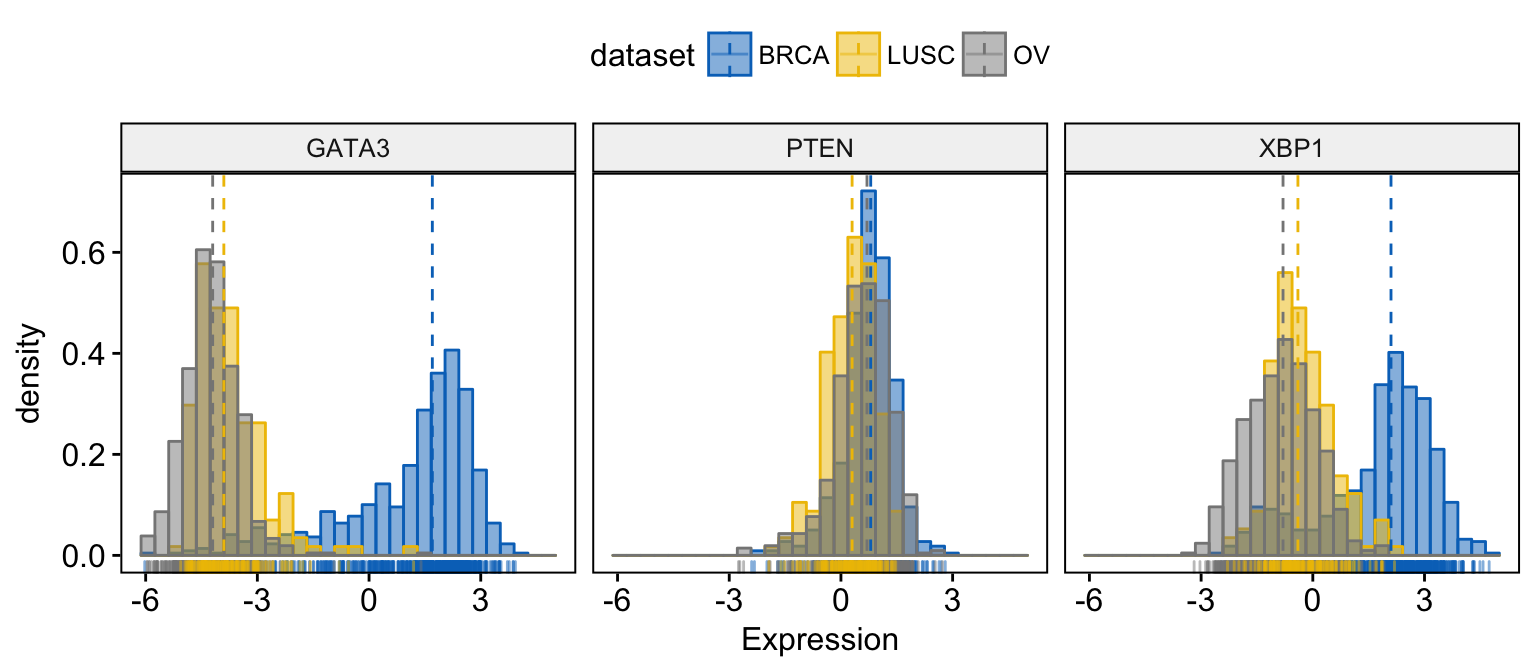
# Change color and fill by dataset
gghistogram(expr,
       x = c("GATA3", "PTEN",  "XBP1"),
       y = "..density..",
       combine = TRUE,                  # Combine the 3 plots
       xlab = "Expression", 
       add = "median",                  # Add median line. 
       rug = TRUE,                      # Add marginal rug
       color = "dataset", 
       fill = "dataset",
       palette = "jco"
)
Exploratory Data visualization: Gene Expression Data

Exploratory Data visualization: Gene Expression Data

# Merge the 3 plots
# and use y = "..count.." instead of "..density.."
gghistogram(expr,
       x = c("GATA3", "PTEN",  "XBP1"),
       y = "..count..",
       merge = TRUE,                    # Merge the 3 plots
       xlab = "Expression", 
       add = "median",                  # Add median line. 
       rug = TRUE ,                     # Add marginal rug
       palette = "jco"                  # Change color palette
)
Exploratory Data visualization: Gene Expression Data

Exploratory Data visualization: Gene Expression Data

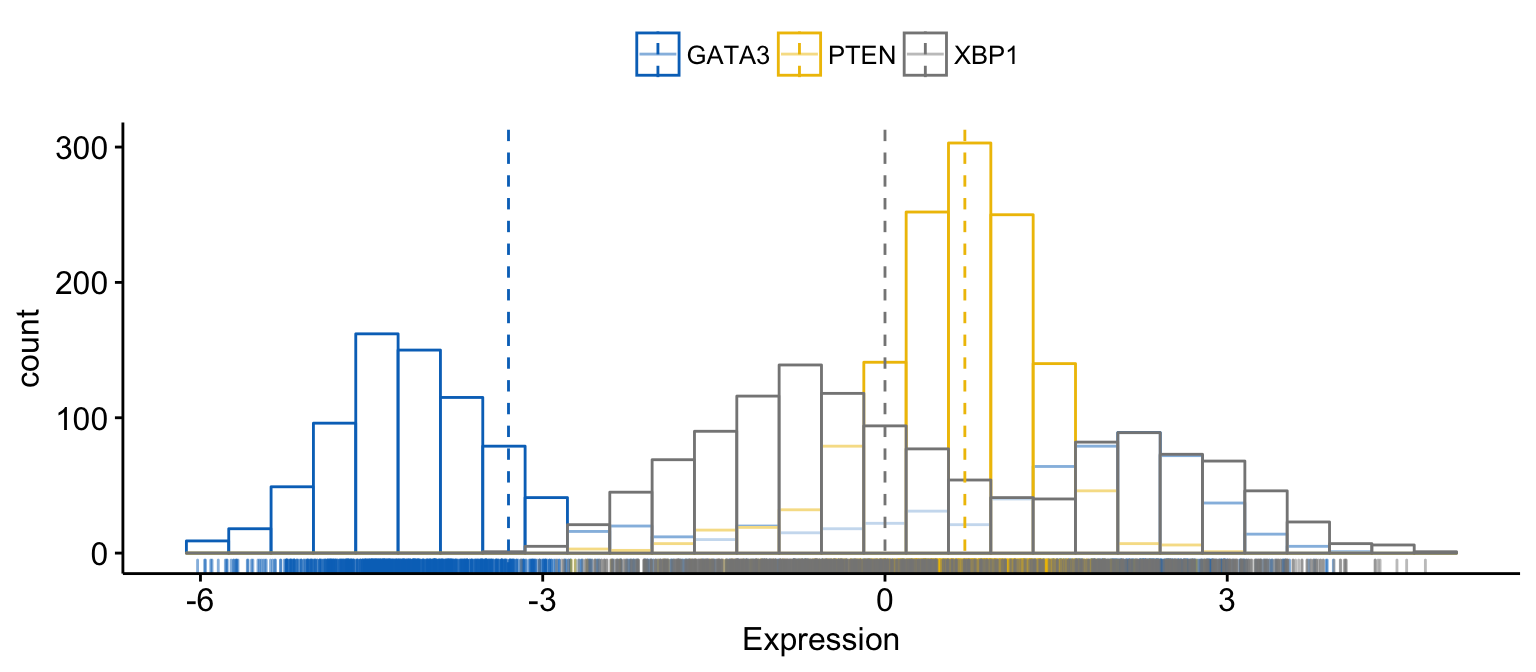
# color and fill by x variables
gghistogram(expr,
       x = c("GATA3", "PTEN",  "XBP1"),
       y = "..count..",
       color = ".x.", fill = ".x.",     # color and fill by x variables
       merge = TRUE,                    # Merge the 3 plots
       xlab = "Expression", 
       add = "median",                  # Add median line. 
       rug = TRUE ,                     # Add marginal rug
       palette = "jco"                  # Change color palette
)
Exploratory Data visualization: Gene Expression Data

Exploratory Data visualization: Gene Expression Data

# Facet by "dataset"
gghistogram(expr,
       x = c("GATA3", "PTEN",  "XBP1"),
       y = "..count..",
       color = ".x.", fill = ".x.", 
       facet.by = "dataset",            # Split by "dataset" into multi-panel
       merge = TRUE,                    # Merge the 3 plots
       xlab = "Expression", 
       add = "median",                  # Add median line. 
       rug = TRUE ,                     # Add marginal rug
       palette = "jco"                  # Change color palette
)
Exploratory Data visualization: Gene Expression Data

Exploratory Data visualization: Gene Expression Data

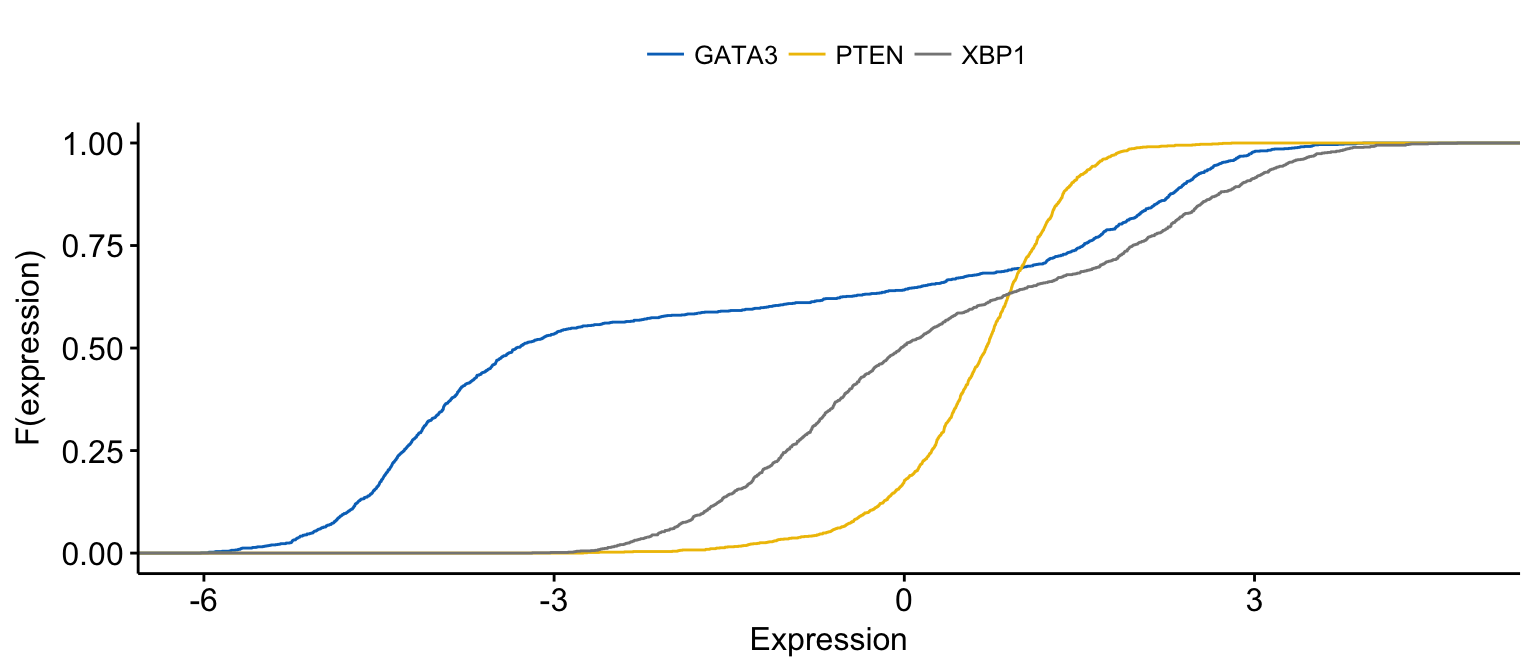
Empirical cumulative density function

(ggplot2 way of creating ECDF plots)

# Basic ECDF plot 
ggecdf(expr,
       x = c("GATA3", "PTEN",  "XBP1"),
       combine = TRUE,                 
       xlab = "Expression", ylab = "F(expression)"
)
Exploratory Data visualization: Gene Expression Data

Exploratory Data visualization: Gene Expression Data

# Change color  by dataset
ggecdf(expr,
       x = c("GATA3", "PTEN",  "XBP1"),
       combine = TRUE,                 
       xlab = "Expression", ylab = "F(expression)",
       color = "dataset", palette = "jco"
)
Exploratory Data visualization: Gene Expression Data

Exploratory Data visualization: Gene Expression Data

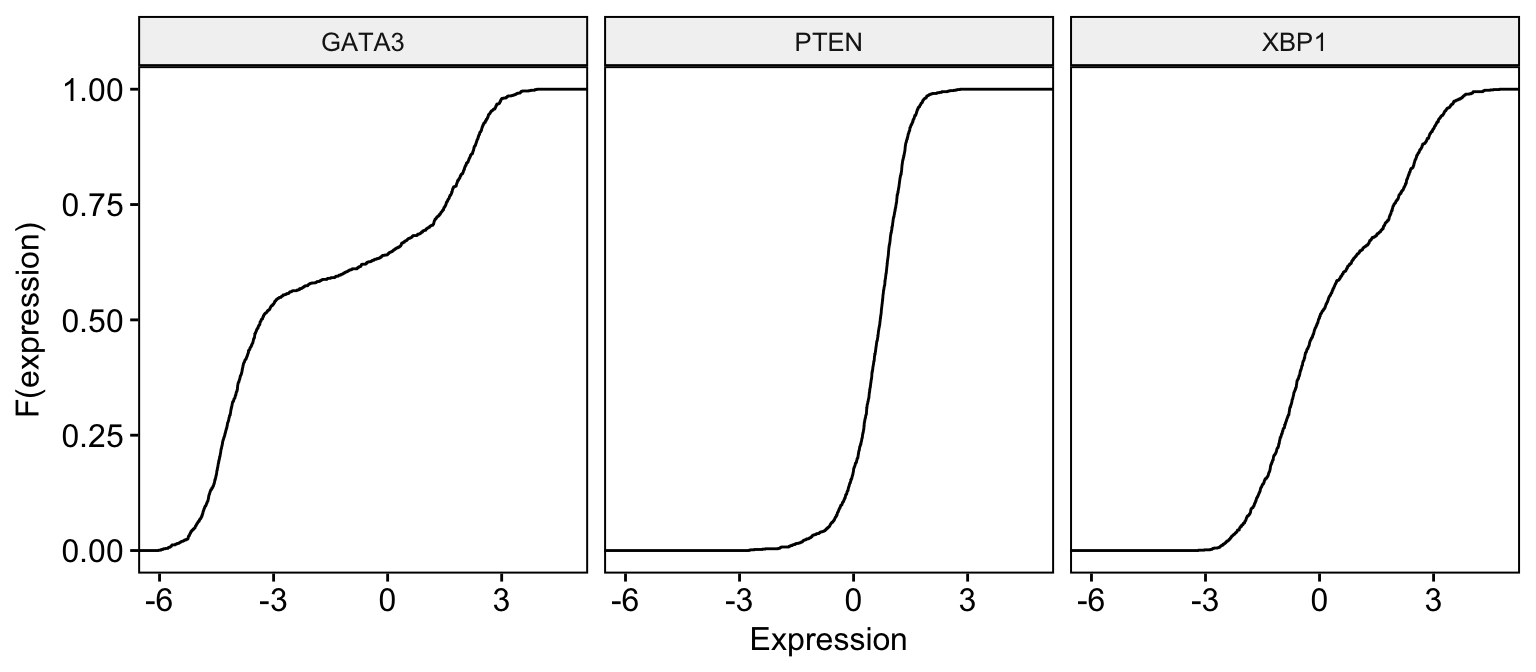
# Merge the 3 plots and color by x variables
ggecdf(expr,
       x = c("GATA3", "PTEN",  "XBP1"),
       merge = TRUE,                 
       xlab = "Expression", ylab = "F(expression)",
       color = ".x.", palette = "jco"
)
Exploratory Data visualization: Gene Expression Data

Exploratory Data visualization: Gene Expression Data

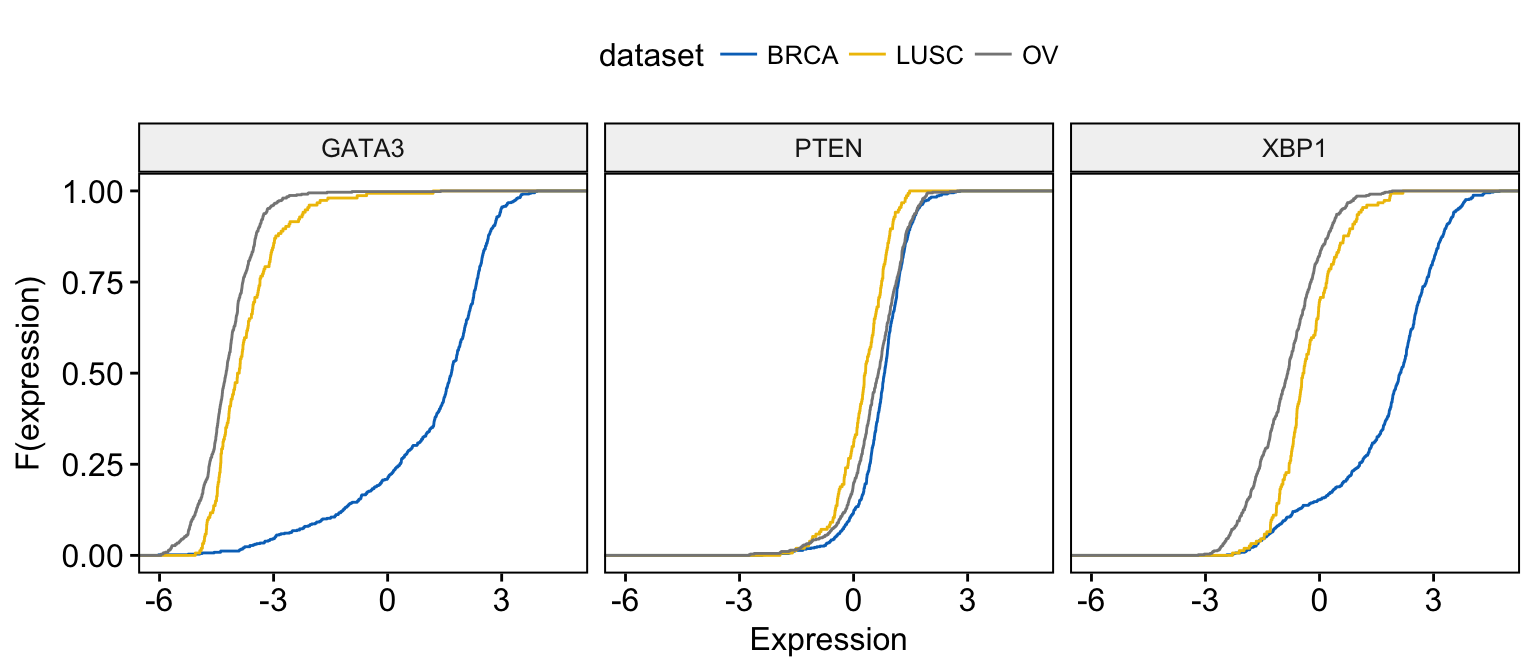
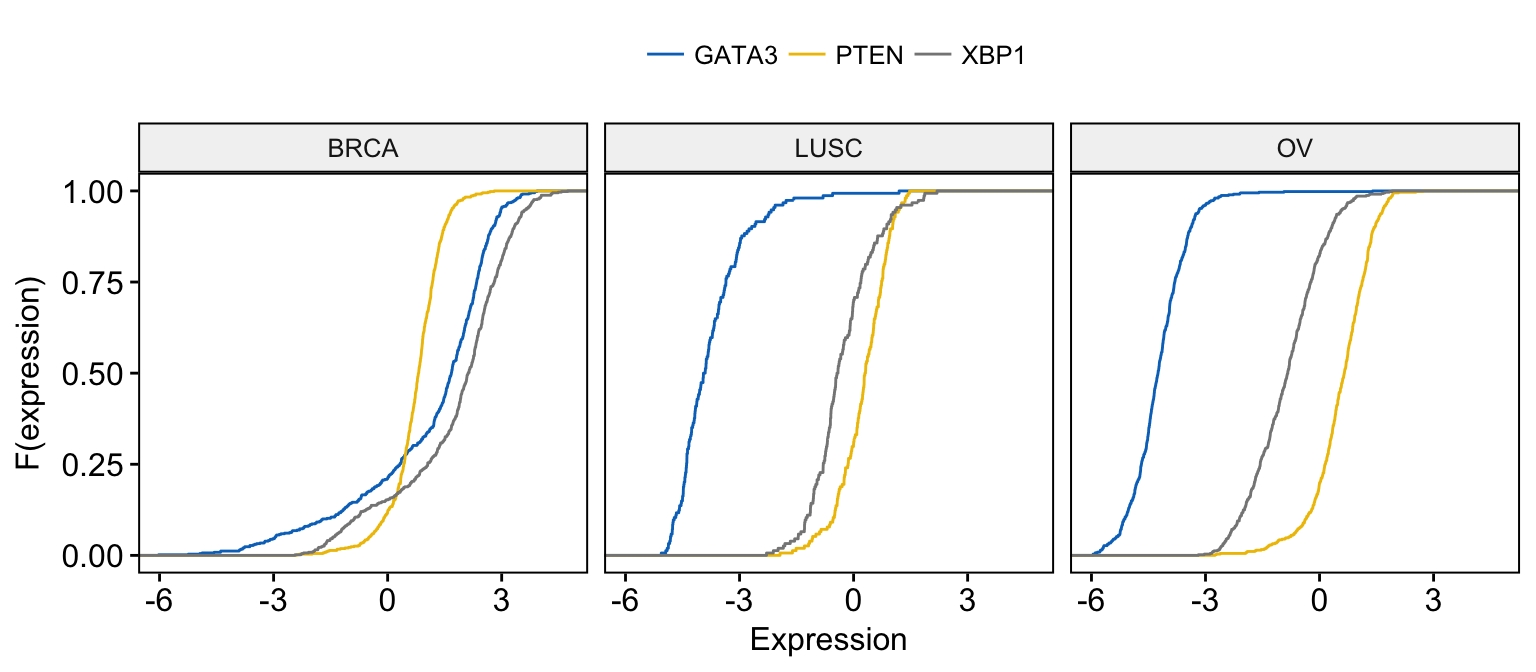
# Merge the 3 plots and color by x variables
# facet by "dataset" into multi-panel
ggecdf(expr,
       x = c("GATA3", "PTEN",  "XBP1"),
       merge = TRUE,                 
       xlab = "Expression", ylab = "F(expression)",
       color = ".x.", palette = "jco",
       facet.by = "dataset"
)
Exploratory Data visualization: Gene Expression Data

Exploratory Data visualization: Gene Expression Data

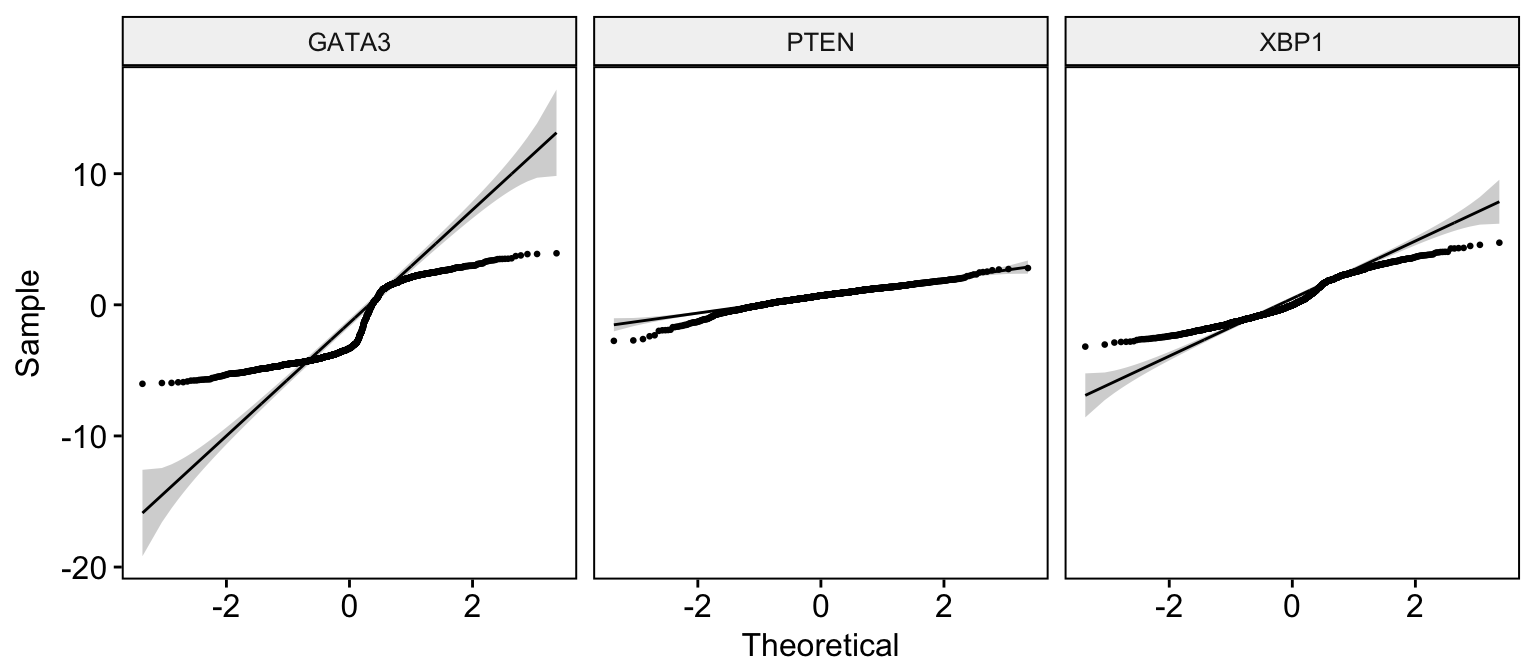
Quantile - Quantile plot

(ggplot2 way of creating QQ plots)

# Basic ECDF plot 
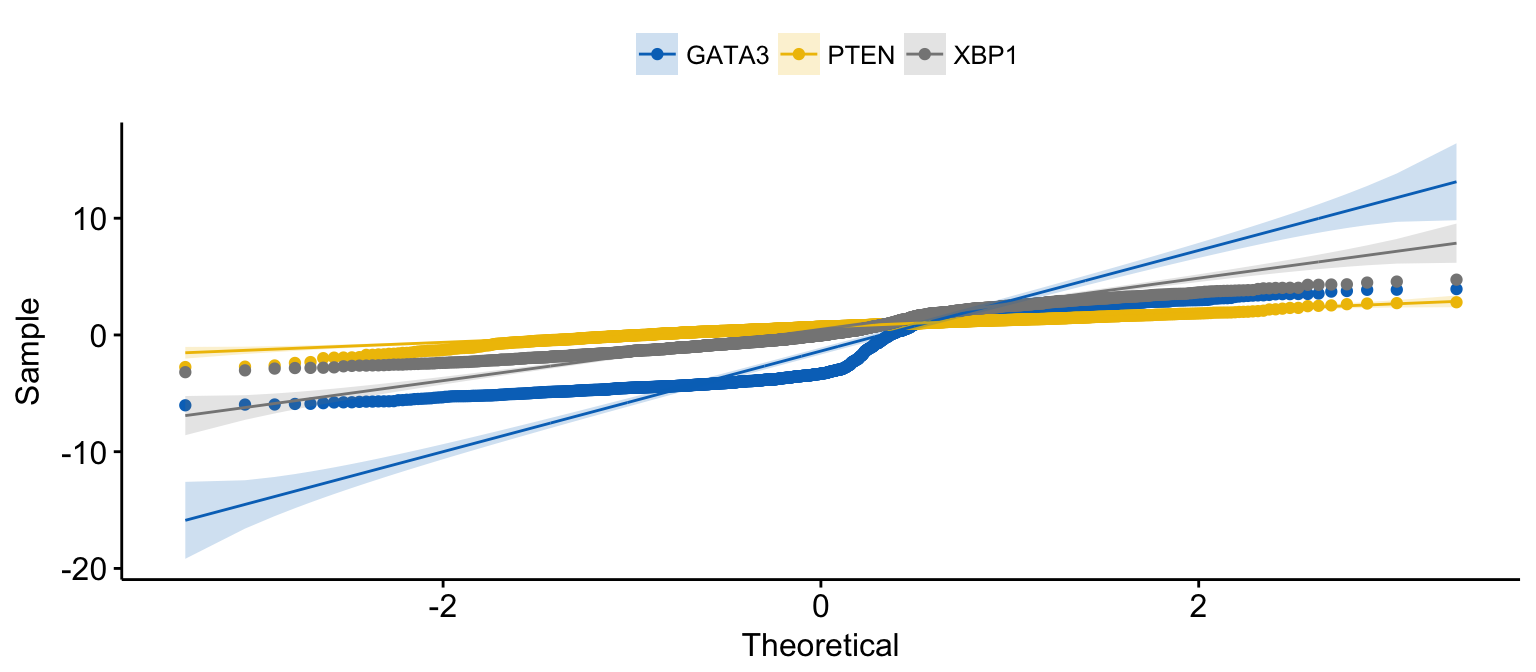
ggqqplot(expr,
       x = c("GATA3", "PTEN",  "XBP1"),
       combine = TRUE, size = 0.5
)
Exploratory Data visualization: Gene Expression Data

Exploratory Data visualization: Gene Expression Data

# Change color  by dataset
ggqqplot(expr,
       x = c("GATA3", "PTEN",  "XBP1"),
       combine = TRUE, color = "dataset", palette = "jco",
       size = 0.5
)
Exploratory Data visualization: Gene Expression Data

Exploratory Data visualization: Gene Expression Data

# Merge the 3 plots and color by x variables
ggqqplot(expr,
       x = c("GATA3", "PTEN",  "XBP1"),
       merge = TRUE,  
       color = ".x.", palette = "jco"
)
Exploratory Data visualization: Gene Expression Data

Exploratory Data visualization: Gene Expression Data

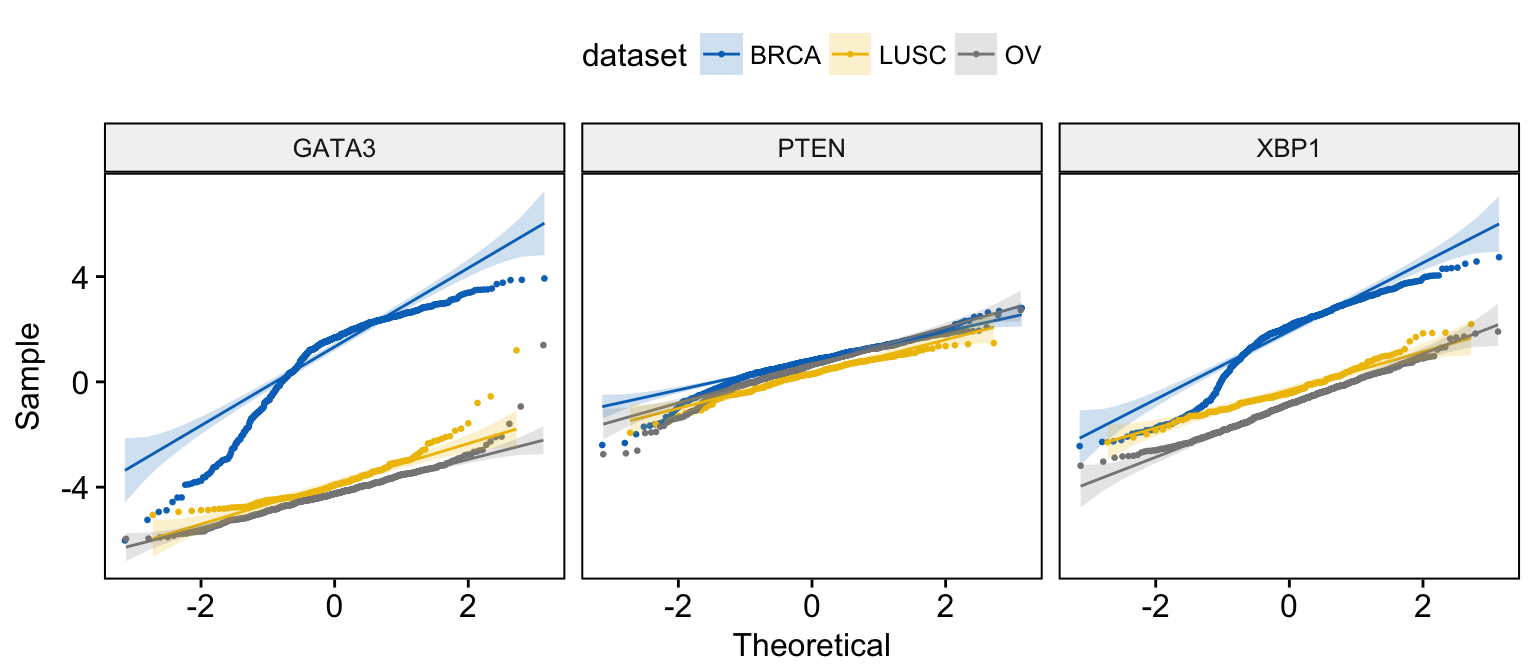
# Merge the 3 plots and color by x variables
# facet by "dataset" into multi-panel
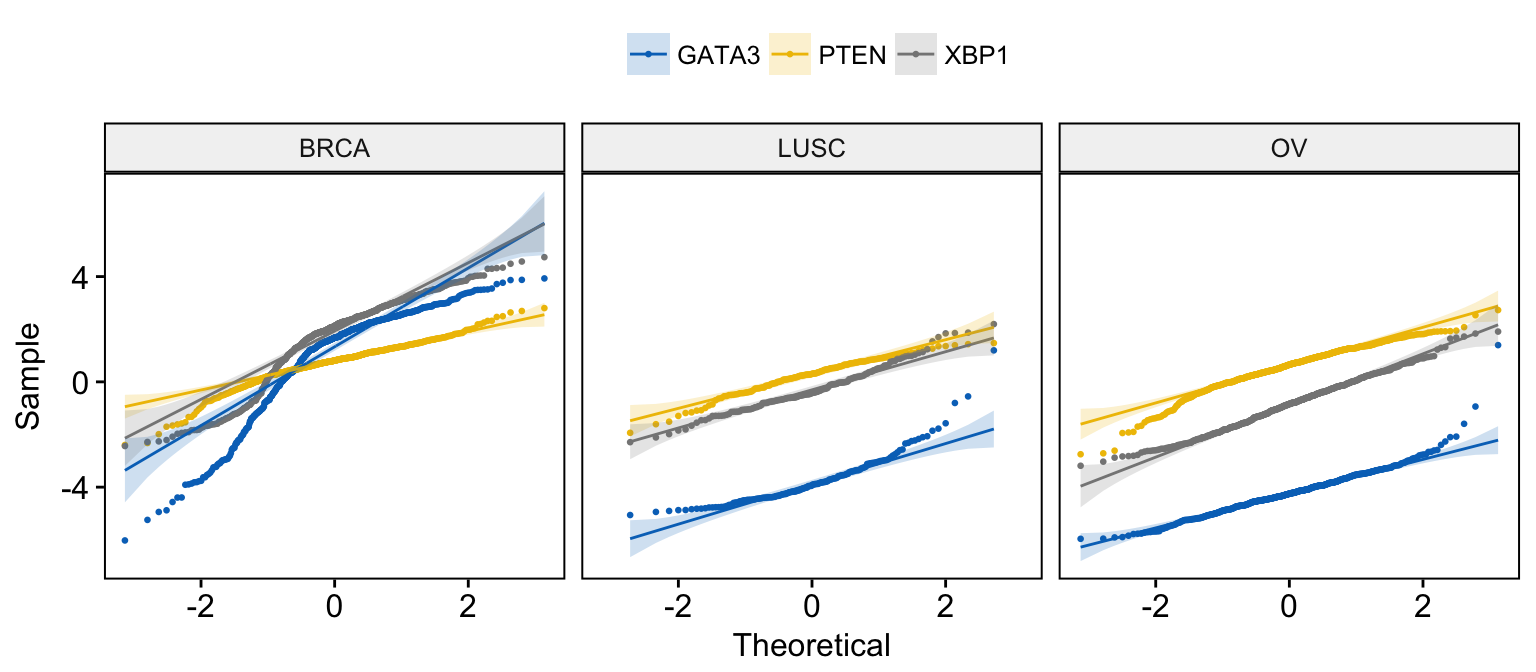
ggqqplot(expr,
       x = c("GATA3", "PTEN",  "XBP1"),
       merge = TRUE, size = 0.5,
       color = ".x.", palette = "jco",
       facet.by = "dataset"
)
Exploratory Data visualization: Gene Expression Data

Exploratory Data visualization: Gene Expression Data

Infos

This analysis has been performed using R software (ver. 3.3.2) and ggpubr (ver. 0.1.3).
Bar Plots and Modern Alternatives

$
0
0


This article describes how to create easily basic and ordered bar plots using ggplot2 based helper functions available in the ggpubr R package. We’ll also present some modern alternatives to bar plots, including lollipop charts and cleveland’s dot plots.

Note that, the approach to build a bar plot, using ggplot2 standard verbs, has been described in our previous article available at: ggplot2 barplots : Quick start guide.

You might be also interested by the following articles:


Bar plots and modern alternatives

Bar plots and modern alternatives

Contents:

Prerequisites

Required R package

You need to install the R package ggpubr (version >= 0.1.3), to easily create ggplot2-based publication ready plots.

Install from CRAN:

install.packages("ggpubr")

Or, install the latest developmental version from GitHub as follow:

if(!require(devtools)) install.packages("devtools")
devtools::install_github("kassambara/ggpubr")

Load ggpubr:

library(ggpubr)

Basic bar plots

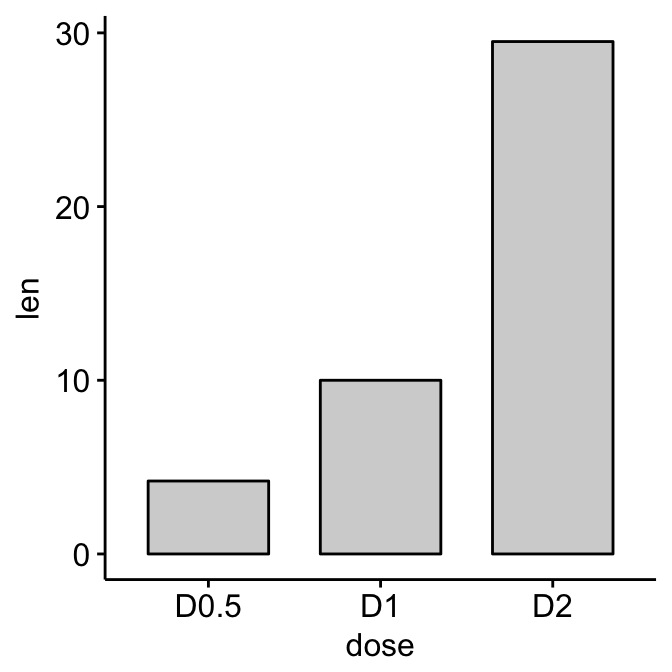
Create a demo data set:

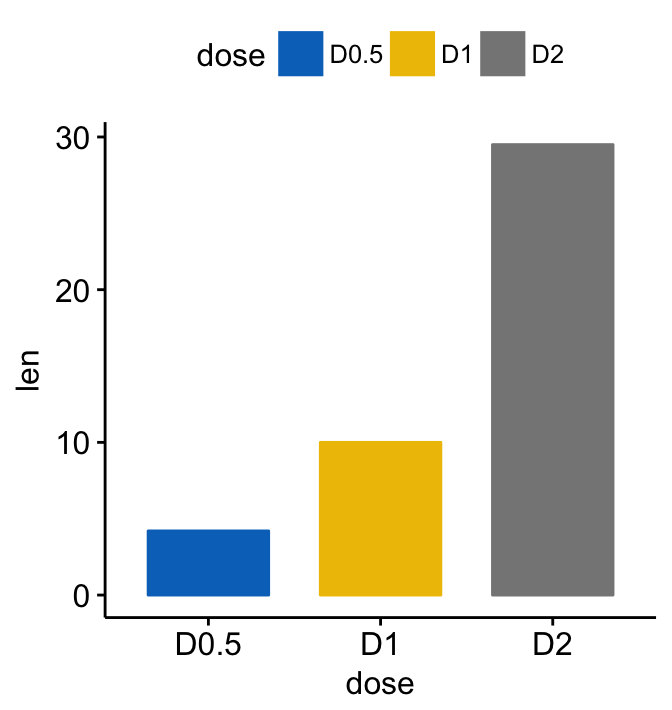
df <- data.frame(dose=c("D0.5", "D1", "D2"),
                 len=c(4.2, 10, 29.5))
print(df)
  dose  len
1 D0.5  4.2
2   D1 10.0
3   D2 29.5

Basic bar plots:

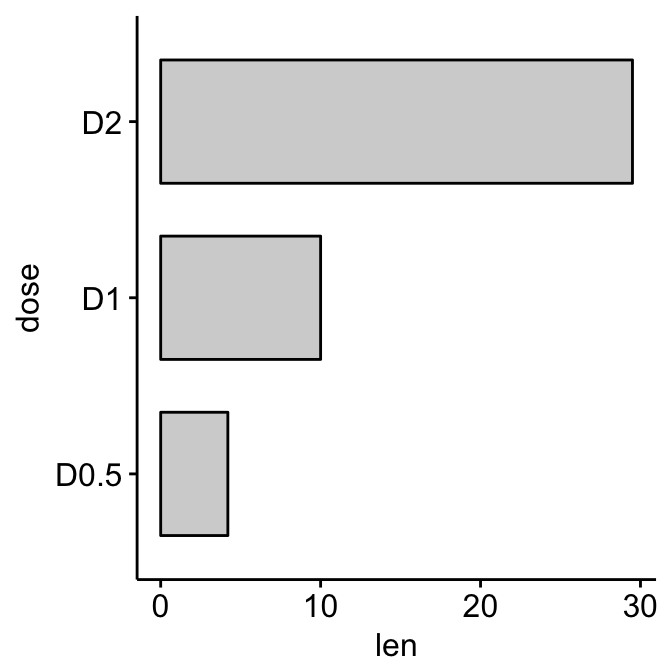
# Basic bar plots with label
p <- ggbarplot(df, x = "dose", y = "len",
          color = "black", fill = "lightgray")
p

# Rotate to create horizontal bar plots
p + rotate()
Bar plots and modern alternativesBar plots and modern alternatives

Bar plots and modern alternatives

Change fill and outline colors by groups:

ggbarplot(df, x = "dose", y = "len",
   fill = "dose", color = "dose", palette = "jco")
Bar plots and modern alternatives

Bar plots and modern alternatives

Multiple grouping variables

Create a demo data set:

df2 <- data.frame(supp=rep(c("VC", "OJ"), each=3),
                  dose=rep(c("D0.5", "D1", "D2"),2),
                  len=c(6.8, 15, 33, 4.2, 10, 29.5))
print(df2)
  supp dose  len
1   VC D0.5  6.8
2   VC   D1 15.0
3   VC   D2 33.0
4   OJ D0.5  4.2
5   OJ   D1 10.0
6   OJ   D2 29.5

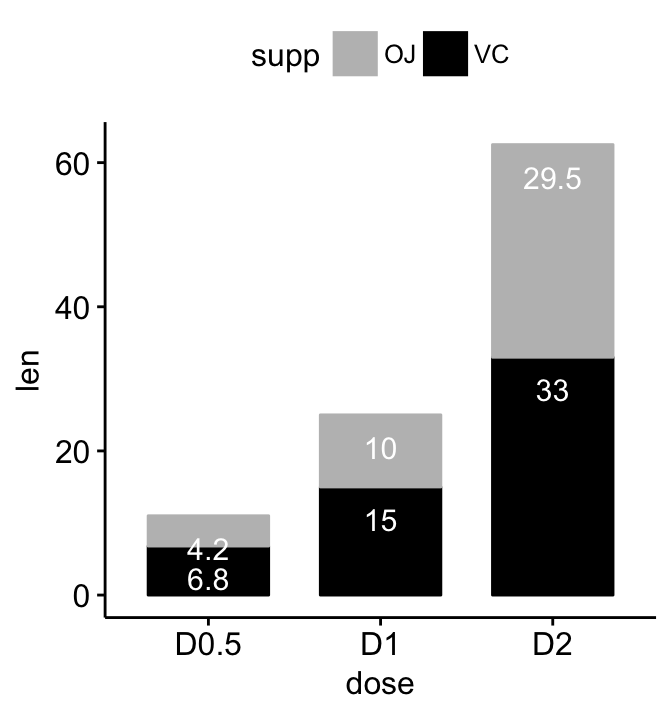
Plot y = “len” by x = “dose” and change color by a second group: “supp”

# Stacked bar plots, add labels inside bars
ggbarplot(df2, x = "dose", y = "len",
  fill = "supp", color = "supp", 
  palette = c("gray", "black"),
  label = TRUE, lab.col = "white", lab.pos = "in")

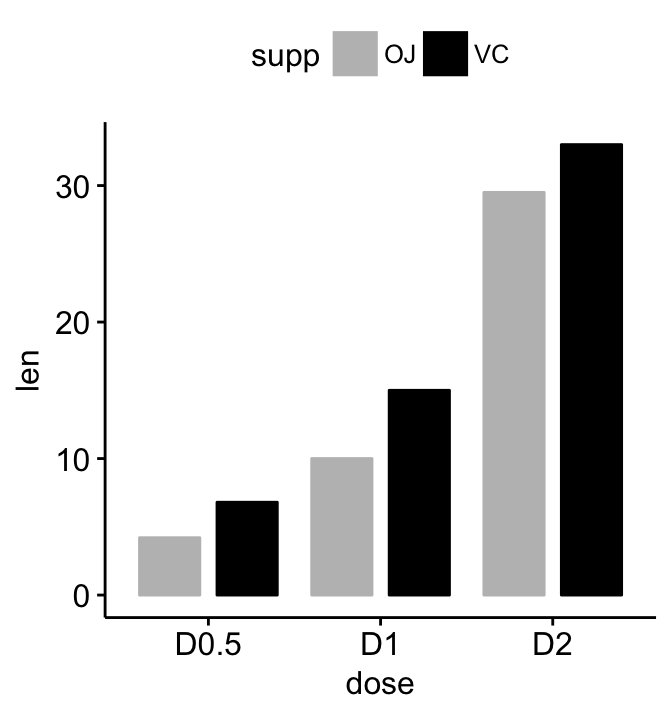
# Change position: Interleaved (dodged) bar plot
ggbarplot(df2, x = "dose", y = "len",
          fill = "supp", color = "supp", 
          palette = c("gray", "black"),
          position = position_dodge(0.9))
Bar plots and modern alternativesBar plots and modern alternatives

Bar plots and modern alternatives

Ordered bar plots

Load and prepare data:

# Load data
data("mtcars")
dfm <- mtcars
# Convert the cyl variable to a factor
dfm$cyl <- as.factor(dfm$cyl)
# Add the name colums
dfm$name <- rownames(dfm)
# Inspect the data
head(dfm[, c("name", "wt", "mpg", "cyl")])
                               name    wt  mpg cyl
Mazda RX4                 Mazda RX4 2.620 21.0   6
Mazda RX4 Wag         Mazda RX4 Wag 2.875 21.0   6
Datsun 710               Datsun 710 2.320 22.8   4
Hornet 4 Drive       Hornet 4 Drive 3.215 21.4   6
Hornet Sportabout Hornet Sportabout 3.440 18.7   8
Valiant                     Valiant 3.460 18.1   6

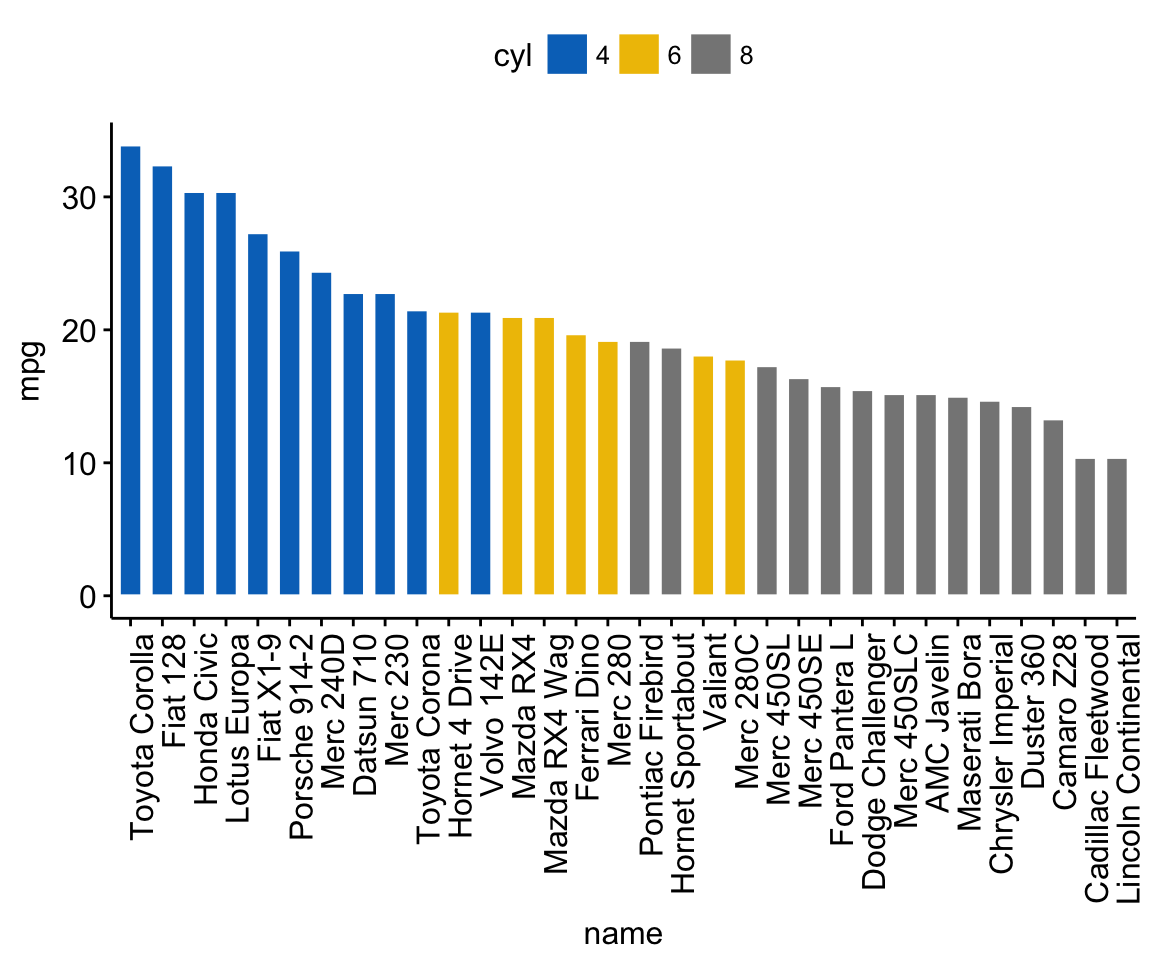
Create ordered bar plots. Change the fill color by the grouping variable “cyl”. Sorting will be done globally, but not by groups.

ggbarplot(dfm, x = "name", y = "mpg",
          fill = "cyl",               # change fill color by cyl
          color = "white",            # Set bar border colors to white
          palette = "jco",            # jco journal color palett. see ?ggpar
          sort.val = "desc",          # Sort the value in dscending order
          sort.by.groups = FALSE,     # Don't sort inside each group
          x.text.angle = 90           # Rotate vertically x axis texts
          )
Bar plots and modern alternatives

Bar plots and modern alternatives

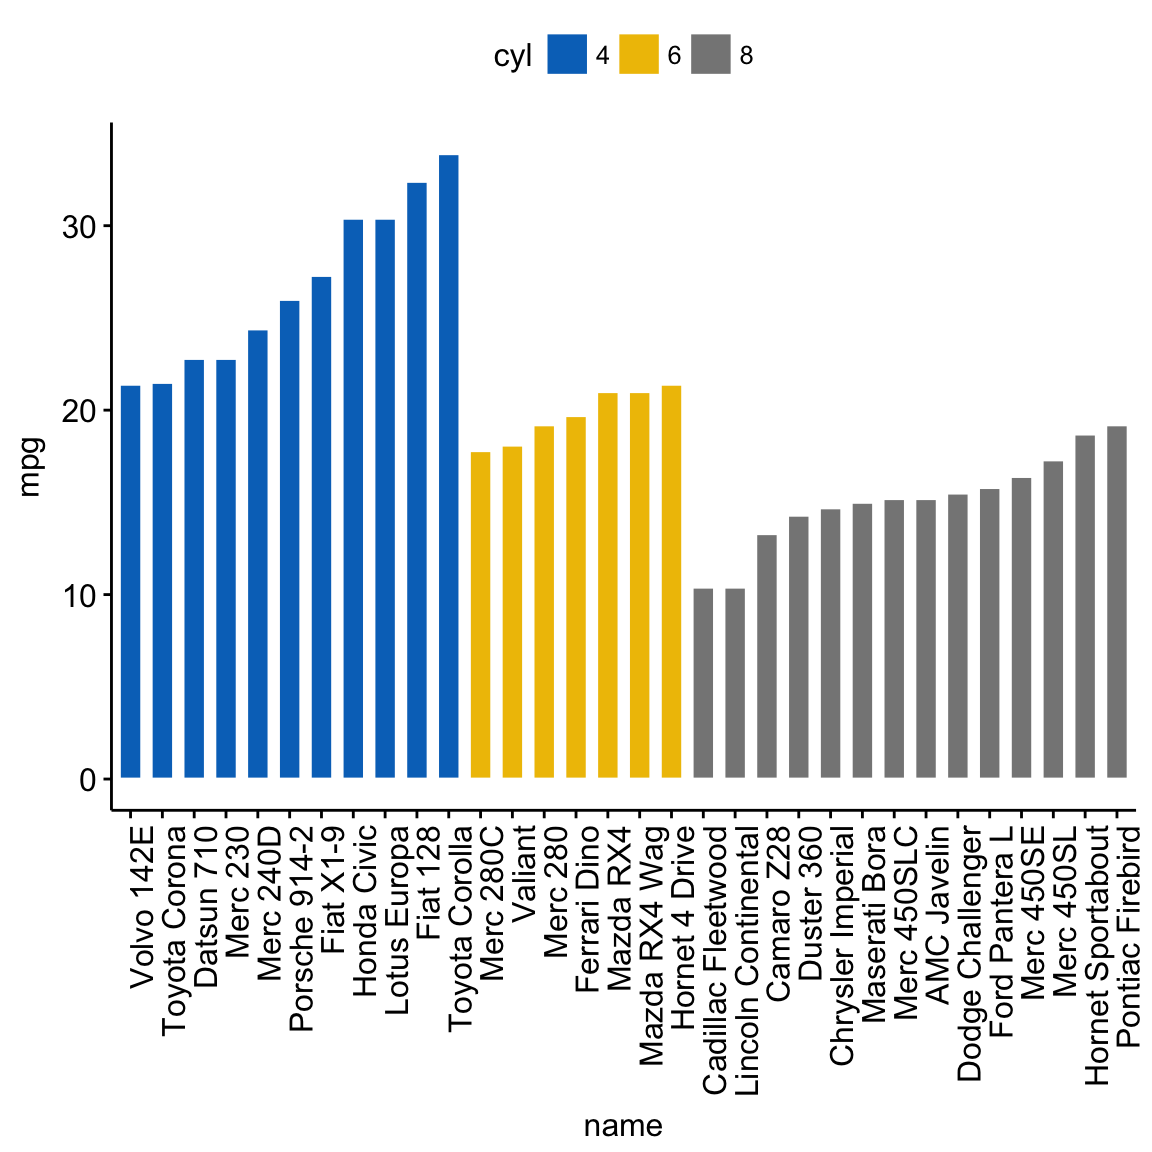
Sort bars inside each group. Use the argument sort.by.groups = TRUE.

ggbarplot(dfm, x = "name", y = "mpg",
          fill = "cyl",               # change fill color by cyl
          color = "white",            # Set bar border colors to white
          palette = "jco",            # jco journal color palett. see ?ggpar
          sort.val = "asc",           # Sort the value in dscending order
          sort.by.groups = TRUE,      # Sort inside each group
          x.text.angle = 90           # Rotate vertically x axis texts
          )
Bar plots and modern alternatives

Bar plots and modern alternatives

Deviation graphs

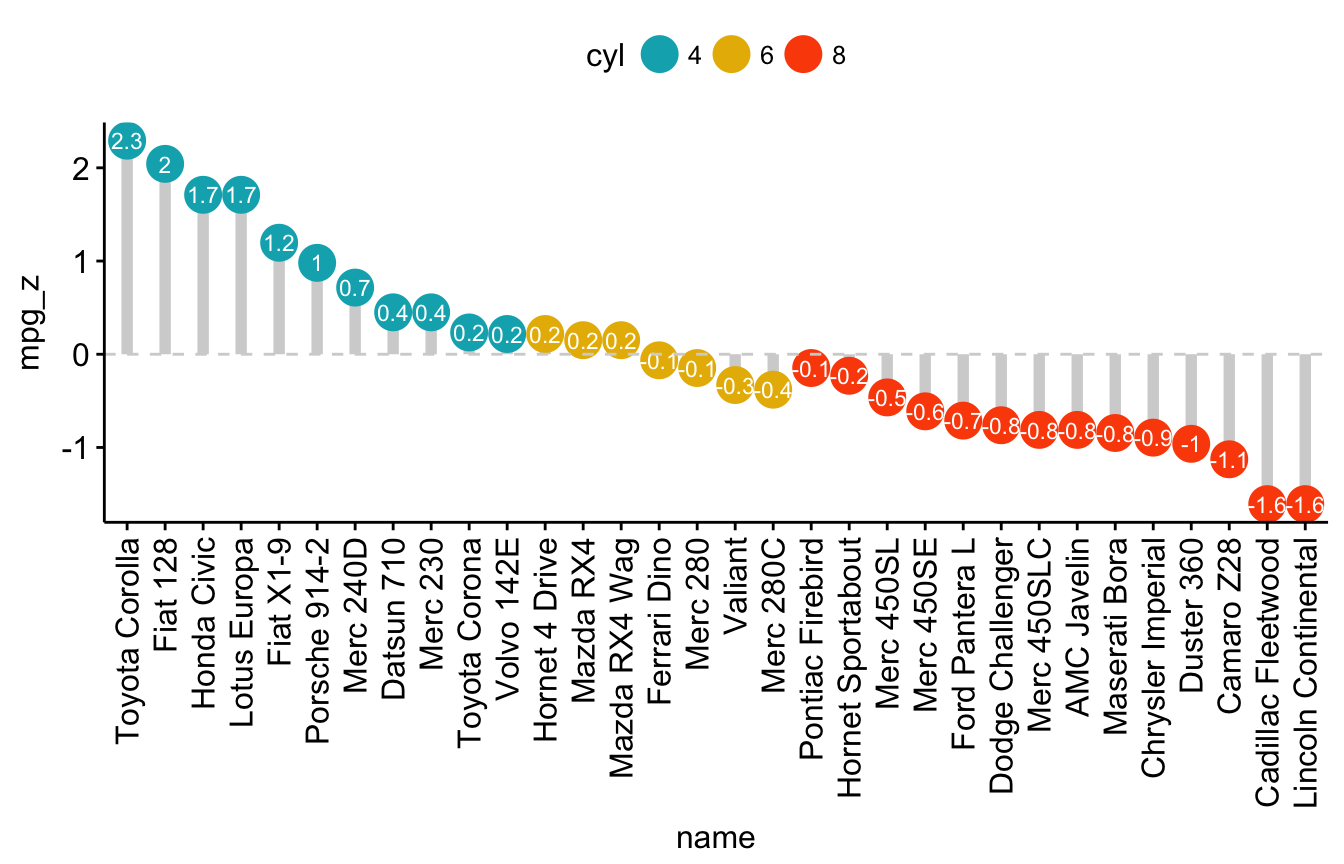
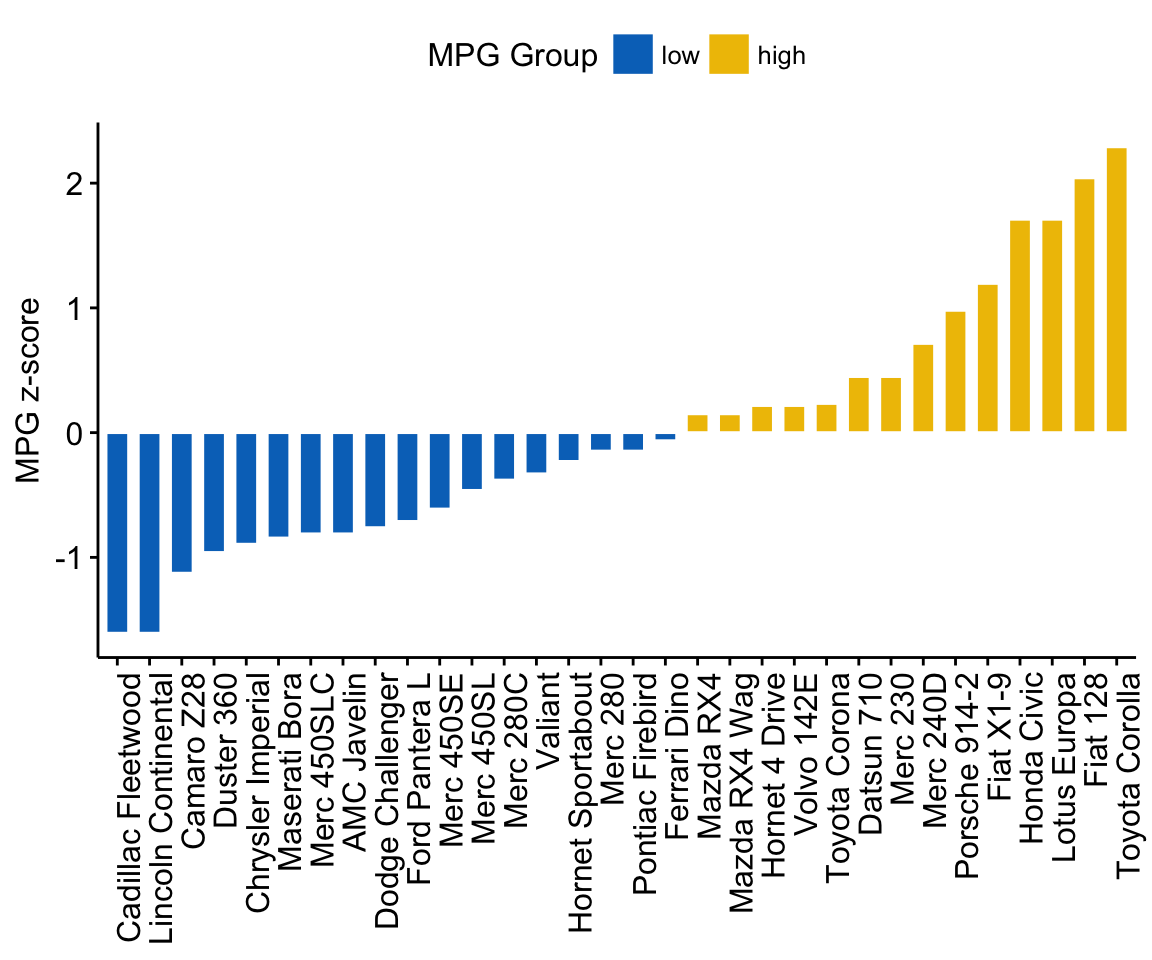
The deviation graph shows the deviation of quantitative values to a reference value. In the R code below, we’ll plot the mpg z-score from the mtcars data set.

Calculate the z-score of the mpg data:

# Calculate the z-score of the mpg data
dfm$mpg_z <- (dfm$mpg -mean(dfm$mpg))/sd(dfm$mpg)
dfm$mpg_grp <- factor(ifelse(dfm$mpg_z < 0, "low", "high"), 
                     levels = c("low", "high"))
# Inspect the data
head(dfm[, c("name", "wt", "mpg", "mpg_z", "mpg_grp", "cyl")])
                               name    wt  mpg      mpg_z mpg_grp cyl
Mazda RX4                 Mazda RX4 2.620 21.0  0.1508848    high   6
Mazda RX4 Wag         Mazda RX4 Wag 2.875 21.0  0.1508848    high   6
Datsun 710               Datsun 710 2.320 22.8  0.4495434    high   4
Hornet 4 Drive       Hornet 4 Drive 3.215 21.4  0.2172534    high   6
Hornet Sportabout Hornet Sportabout 3.440 18.7 -0.2307345     low   8
Valiant                     Valiant 3.460 18.1 -0.3302874     low   6

Create an ordered bar plot, colored according to the level of mpg:

ggbarplot(dfm, x = "name", y = "mpg_z",
          fill = "mpg_grp",           # change fill color by mpg_level
          color = "white",            # Set bar border colors to white
          palette = "jco",            # jco journal color palett. see ?ggpar
          sort.val = "asc",           # Sort the value in ascending order
          sort.by.groups = FALSE,     # Don't sort inside each group
          x.text.angle = 90,          # Rotate vertically x axis texts
          ylab = "MPG z-score",
          xlab = FALSE,
          legend.title = "MPG Group"
          )
Bar plots and modern alternatives

Bar plots and modern alternatives

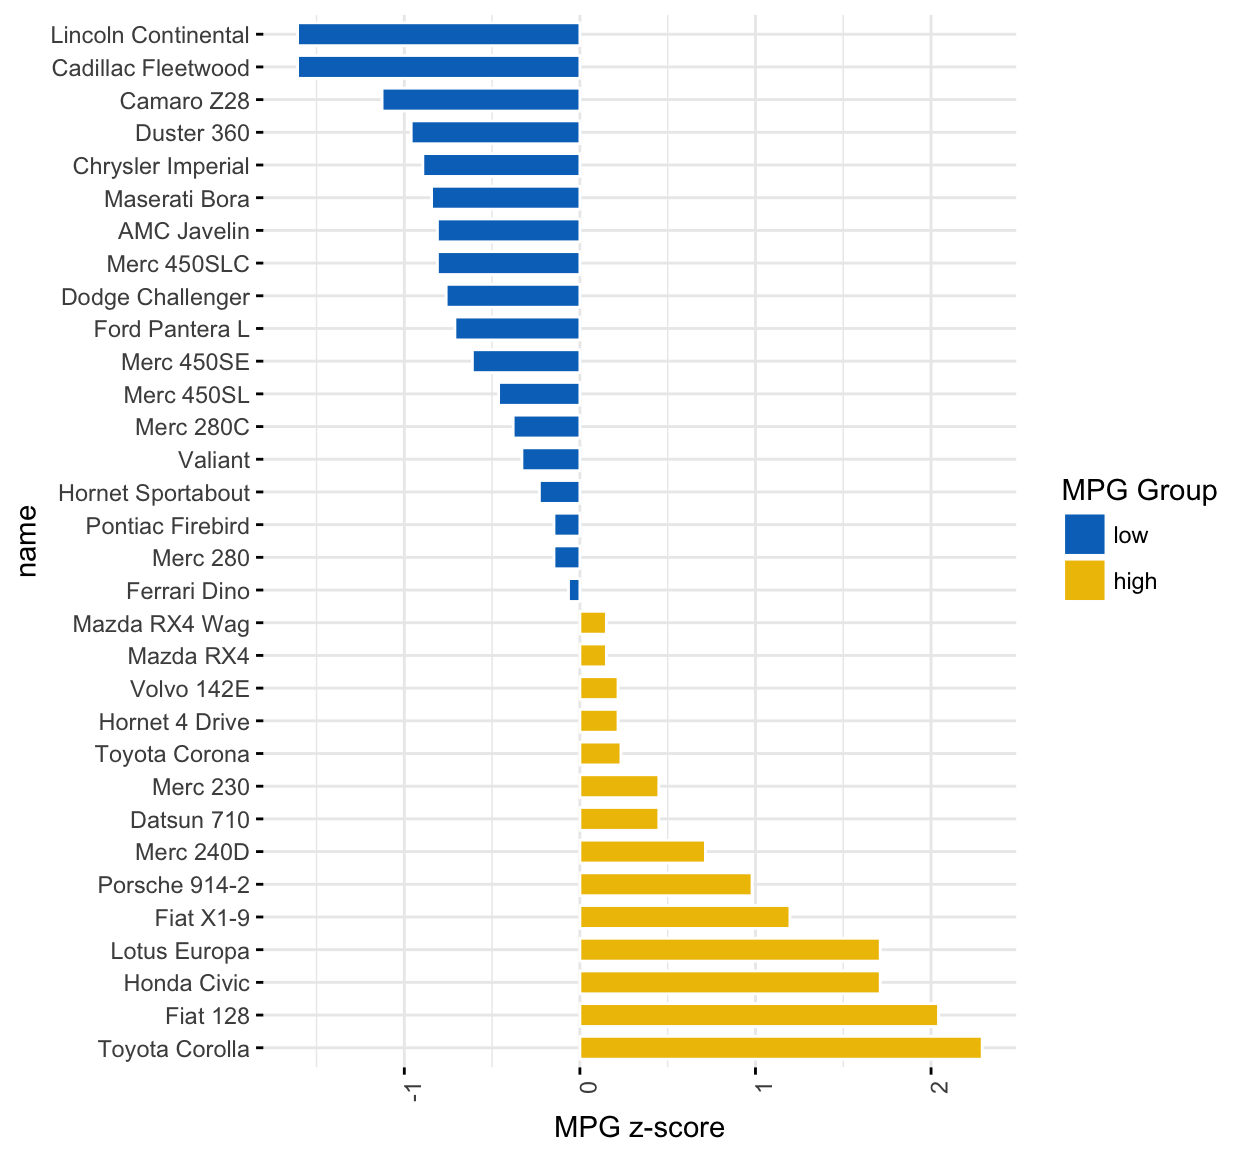
Rotate the plot: use rotate = TRUE and sort.val = “desc”

ggbarplot(dfm, x = "name", y = "mpg_z",
          fill = "mpg_grp",           # change fill color by mpg_level
          color = "white",            # Set bar border colors to white
          palette = "jco",            # jco journal color palett. see ?ggpar
          sort.val = "desc",          # Sort the value in descending order
          sort.by.groups = FALSE,     # Don't sort inside each group
          x.text.angle = 90,          # Rotate vertically x axis texts
          ylab = "MPG z-score",
          legend.title = "MPG Group",
          rotate = TRUE,
          ggtheme = theme_minimal()
          )
Bar plots and modern alternatives

Bar plots and modern alternatives

Alternatives to bar plots

Lollipop chart

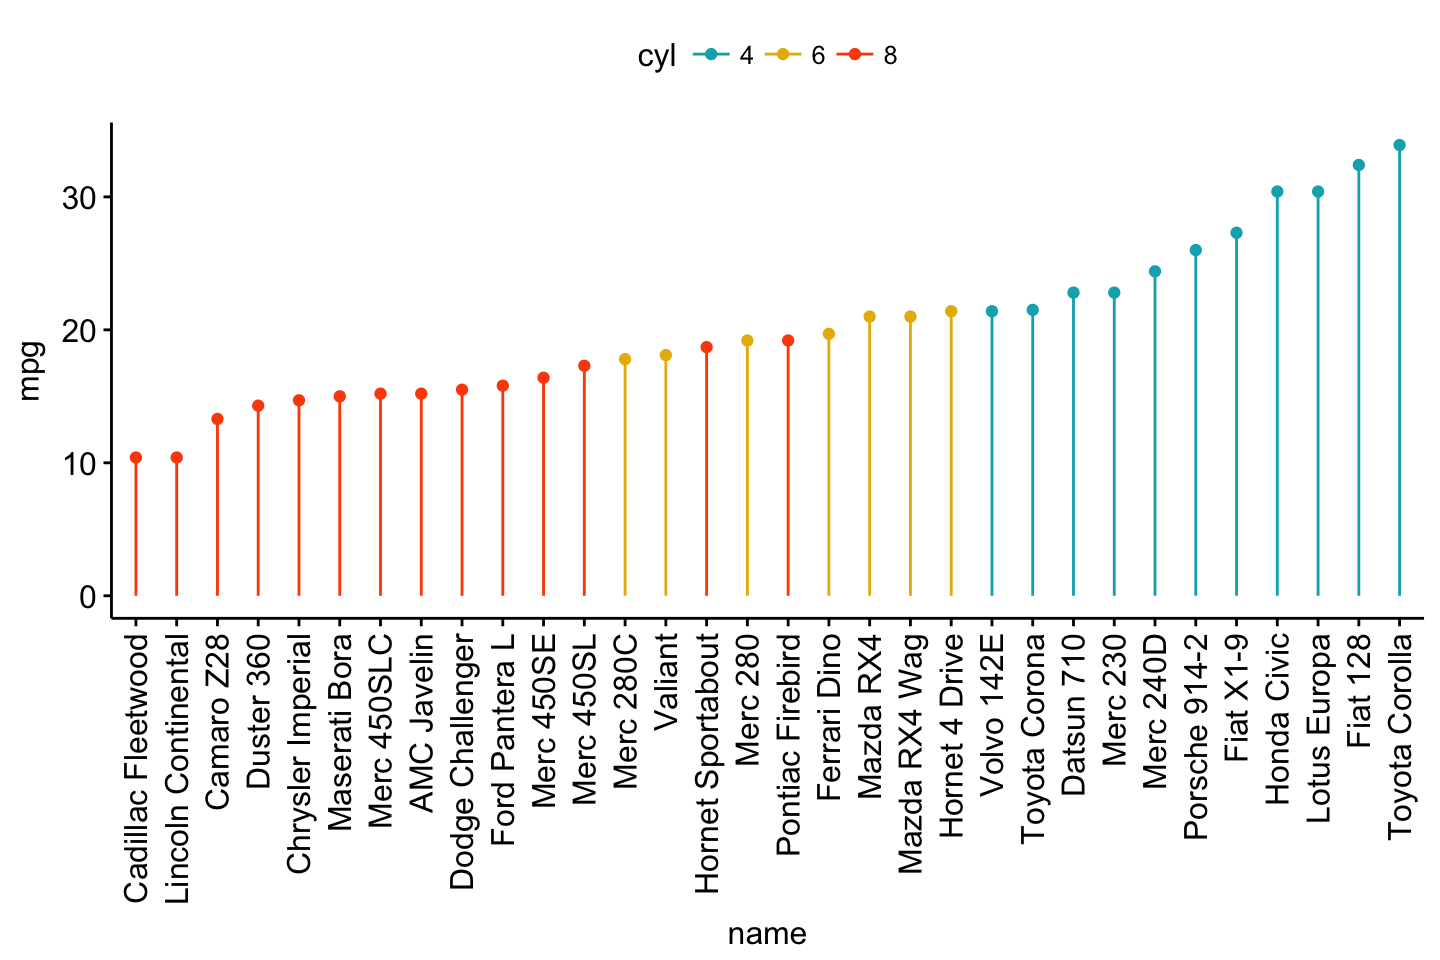
Lollipop chart is an alternative to bar plots, when you have a large set of values to visualize.

Lollipop chart colored by the grouping variable “cyl”:

ggdotchart(dfm, x = "name", y = "mpg",
           color = "cyl",                                # Color by groups
           palette = c("#00AFBB", "#E7B800", "#FC4E07"), # Custom color palette
           sorting = "ascending",                        # Sort value in descending order
           add = "segments",                             # Add segments from y = 0 to dots
           ggtheme = theme_pubr()                        # ggplot2 theme
           )
Bar plots and modern alternatives

Bar plots and modern alternatives

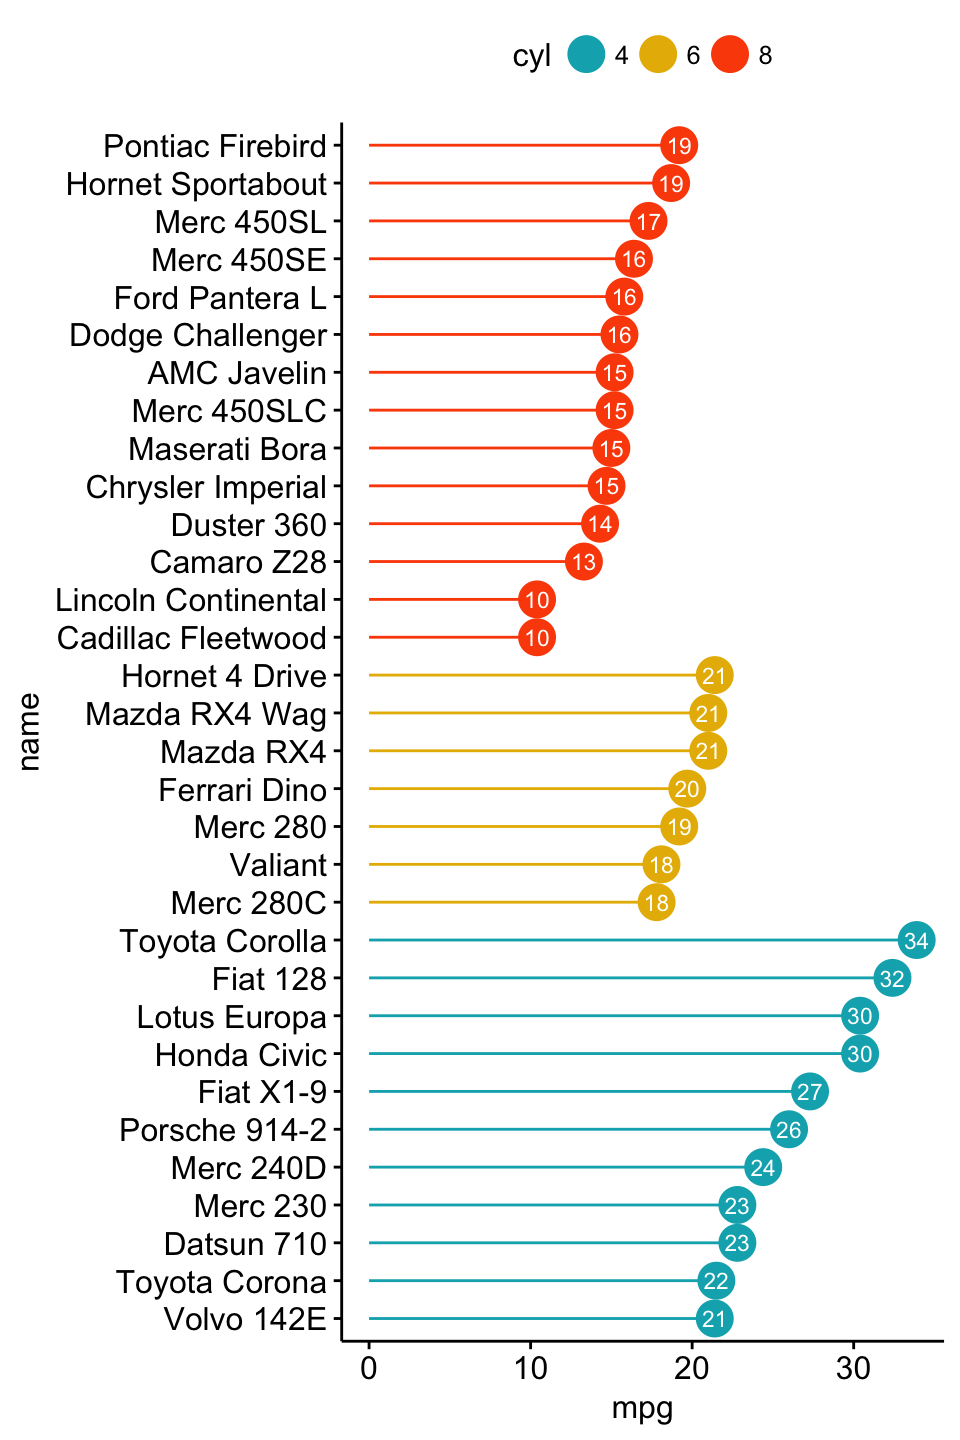
  • Sort in descending order. sorting = “descending”.
  • Rotate the plot vertically, using rotate = TRUE.
  • Sort the mpg value inside each group by using group = “cyl”.
  • Set dot.size to 6.
  • Add mpg values as label. label = “mpg” or label = round(dfm$mpg).
ggdotchart(dfm, x = "name", y = "mpg",
           color = "cyl",                                # Color by groups
           palette = c("#00AFBB", "#E7B800", "#FC4E07"), # Custom color palette
           sorting = "descending",                       # Sort value in descending order
           add = "segments",                             # Add segments from y = 0 to dots
           rotate = TRUE,                                # Rotate vertically
           group = "cyl",                                # Order by groups
           dot.size = 6,                                 # Large dot size
           label = round(dfm$mpg),                        # Add mpg values as dot labels
           font.label = list(color = "white", size = 9, 
                             vjust = 0.5),               # Adjust label parameters
           ggtheme = theme_pubr()                        # ggplot2 theme
           )
Bar plots and modern alternatives

Bar plots and modern alternatives

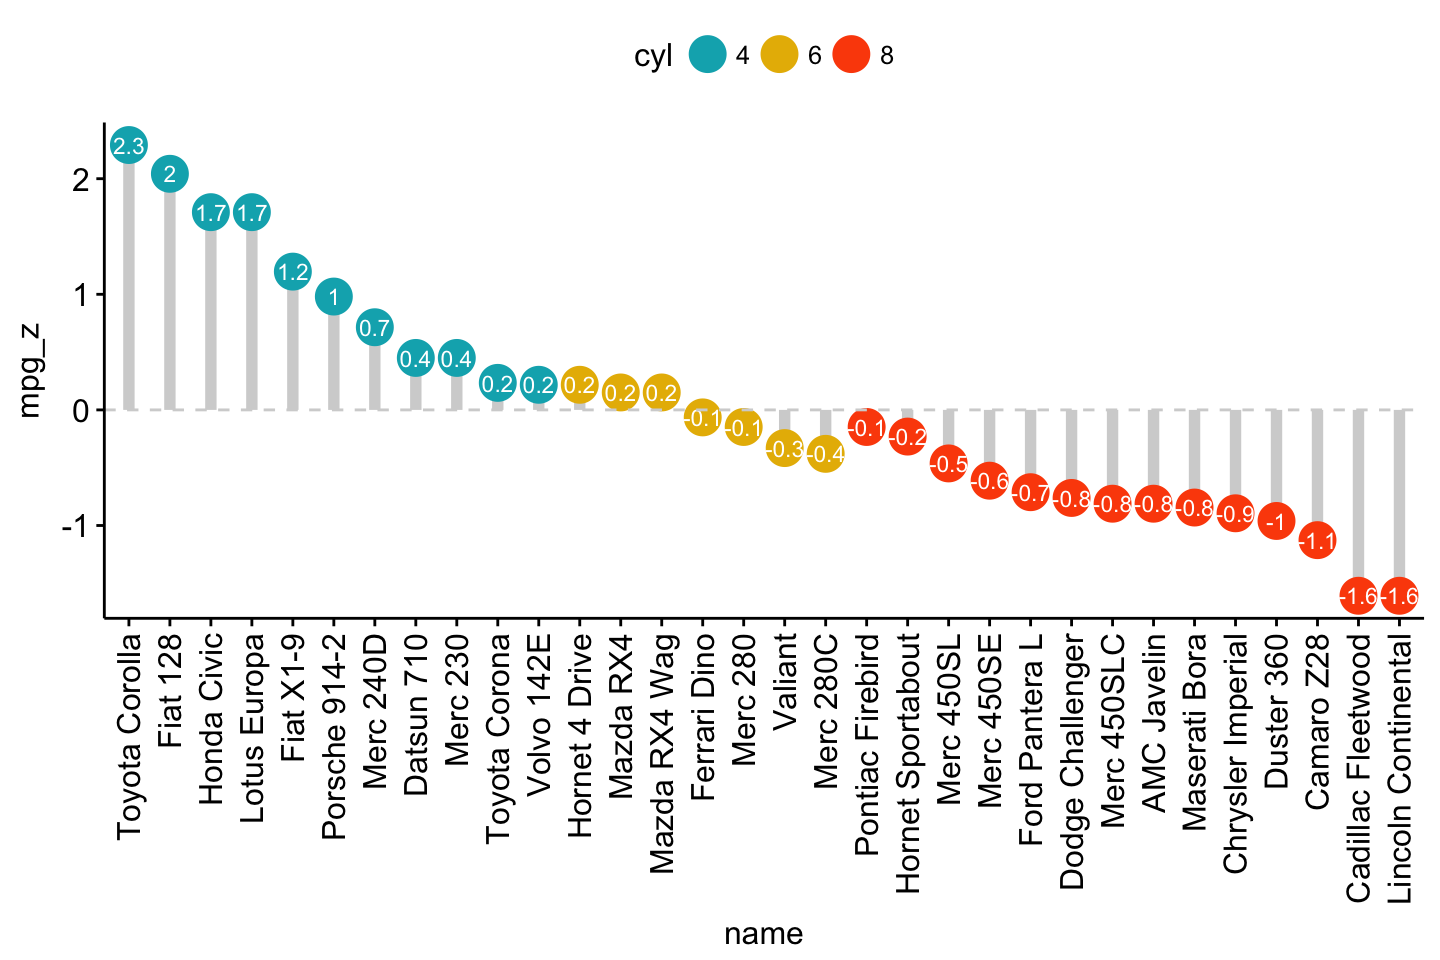
Deviation graph:

  • Use y = “mpg_z”
  • Change segment color and size: add.params = list(color = “lightgray”, size = 2)
ggdotchart(dfm, x = "name", y = "mpg_z",
           color = "cyl",                                # Color by groups
           palette = c("#00AFBB", "#E7B800", "#FC4E07"), # Custom color palette
           sorting = "descending",                       # Sort value in descending order
           add = "segments",                             # Add segments from y = 0 to dots
           add.params = list(color = "lightgray", size = 2), # Change segment color and size
           group = "cyl",                                # Order by groups
           dot.size = 6,                                 # Large dot size
           label = round(dfm$mpg_z,1),                        # Add mpg values as dot labels
           font.label = list(color = "white", size = 9, 
                             vjust = 0.5),               # Adjust label parameters
           ggtheme = theme_pubr()                        # ggplot2 theme
           )+
  geom_hline(yintercept = 0, linetype = 2, color = "lightgray")
Bar plots and modern alternatives

Bar plots and modern alternatives

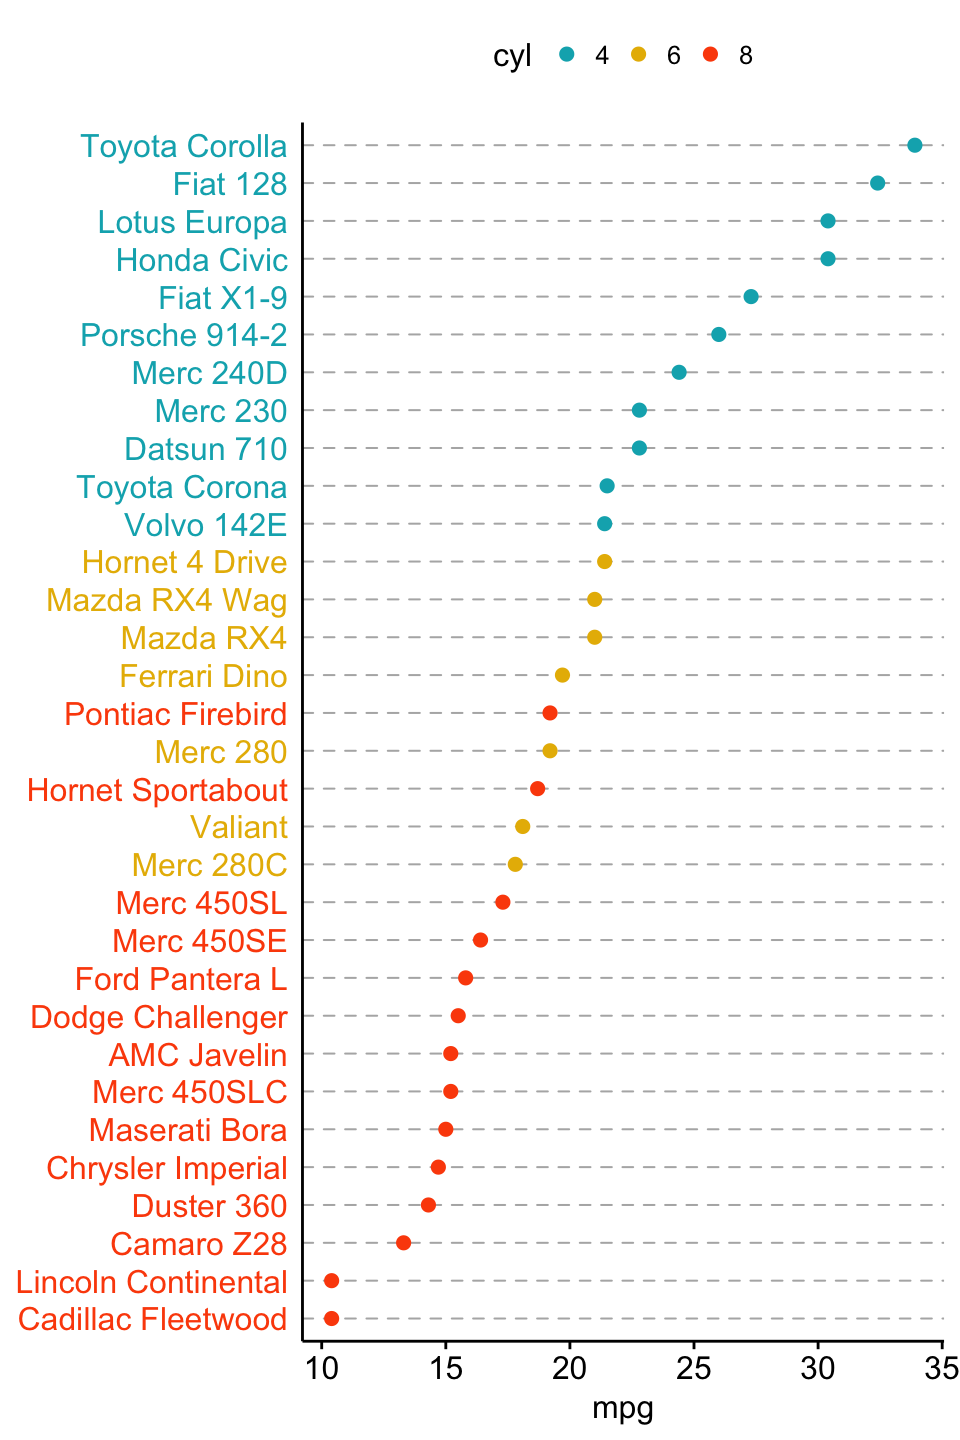
Cleveland’s dot plot

Color y text by groups. Use y.text.col = TRUE.
ggdotchart(dfm, x = "name", y = "mpg",
           color = "cyl",                                # Color by groups
           palette = c("#00AFBB", "#E7B800", "#FC4E07"), # Custom color palette
           sorting = "descending",                       # Sort value in descending order
           rotate = TRUE,                                # Rotate vertically
           dot.size = 2,                                 # Large dot size
           y.text.col = TRUE,                            # Color y text by groups
           ggtheme = theme_pubr()                        # ggplot2 theme
           )+
  theme_cleveland()                                      # Add dashed grids
Bar plots and modern alternatives

Bar plots and modern alternatives

Infos

This analysis has been performed using R software (ver. 3.3.2) and ggpubr (ver. 0.1.4).

ggplot2 - Easy way to mix multiple graphs on the same page

$
0
0


To arrange multipleggplot2 graphs on the same page, the standard R functions - par() and layout() - cannot be used.

The basic solution is to use the gridExtra R package, which comes with the following functions:

  • grid.arrange() and arrangeGrob() to arrange multiple ggplots on one page
  • marrangeGrob() for arranging multiple ggplots over multiple pages.

However, these functions makes no attempt at aligning the plot panels; instead, the plots are simply placed into the grid as they are, and so the axes are not aligned.

If axis alignment is required, you can switch to the cowplot package, which include the function plot_grid() with the argument align. However, the cowplot package doesn’t contain any solution for multi-pages layout. Therefore, we provide the function ggarrange() [in ggpubr], a wrapper around the plot_grid() function, to arrange multiple ggplots over multiple pages. It can also create a common unique legend for multiple plots.

This article will show you, step by step, how to combine multiple ggplots on the same page, as well as, over multiple pages, using helper functions available in the following R package: ggpubr R package, cowplot and gridExtra. We’ll also describe how to export the arranged plots to a file.


Arrange multiple ggplots

Related articles:

Contents:


Prerequisites

Required R package

You need to install the R package ggpubr (version >= 0.1.3), to easily create ggplot2-based publication ready plots.

We recommend to install the latest developmental version from GitHub as follow:

if(!require(devtools)) install.packages("devtools")
devtools::install_github("kassambara/ggpubr")

If installation from Github failed, then try to install from CRAN as follow:

install.packages("ggpubr")

Note that, the installation of ggpubr will install the gridExtra and the cowplot package; so you don’t need to re-install them.

Load ggpubr:

library(ggpubr)

Demo data sets

Data: ToothGrowth and mtcars data sets.

# ToothGrowth
data("ToothGrowth")
head(ToothGrowth)
   len supp dose
1  4.2   VC  0.5
2 11.5   VC  0.5
3  7.3   VC  0.5
4  5.8   VC  0.5
5  6.4   VC  0.5
6 10.0   VC  0.5
# mtcars 
data("mtcars")
mtcars$name <- rownames(mtcars)
mtcars$cyl <- as.factor(mtcars$cyl)
head(mtcars[, c("name", "wt", "mpg", "cyl")])
                               name    wt  mpg cyl
Mazda RX4                 Mazda RX4 2.620 21.0   6
Mazda RX4 Wag         Mazda RX4 Wag 2.875 21.0   6
Datsun 710               Datsun 710 2.320 22.8   4
Hornet 4 Drive       Hornet 4 Drive 3.215 21.4   6
Hornet Sportabout Hornet Sportabout 3.440 18.7   8
Valiant                     Valiant 3.460 18.1   6

Create some plots

Here, we’ll use ggplot2-based plotting functions available in ggpubr. You can use any ggplot2 functions to create the plots that you want for arranging them later.

We’ll start by creating 4 different plots:

  • Box plots and dot plots using the ToothGrowth data set
  • Bar plots and scatter plots using the mtcars data set

You’ll learn how to combine these plots in the next sections using specific functions.

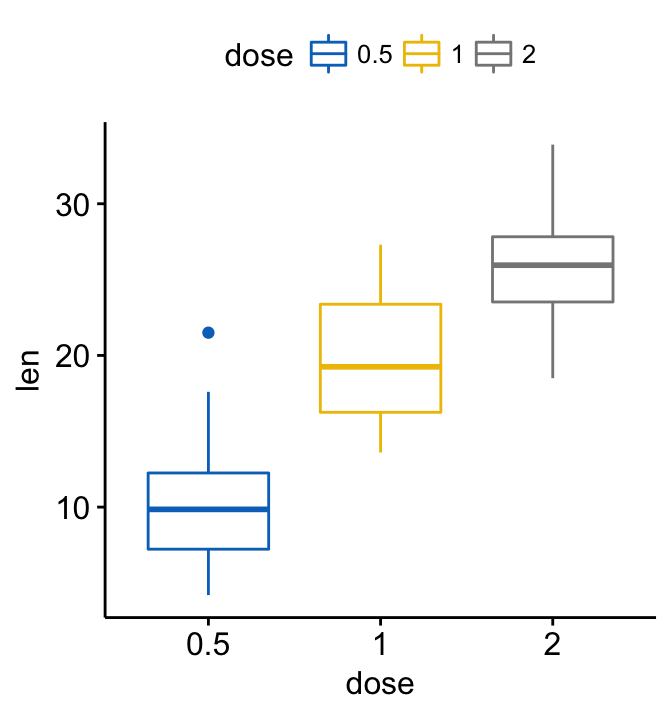
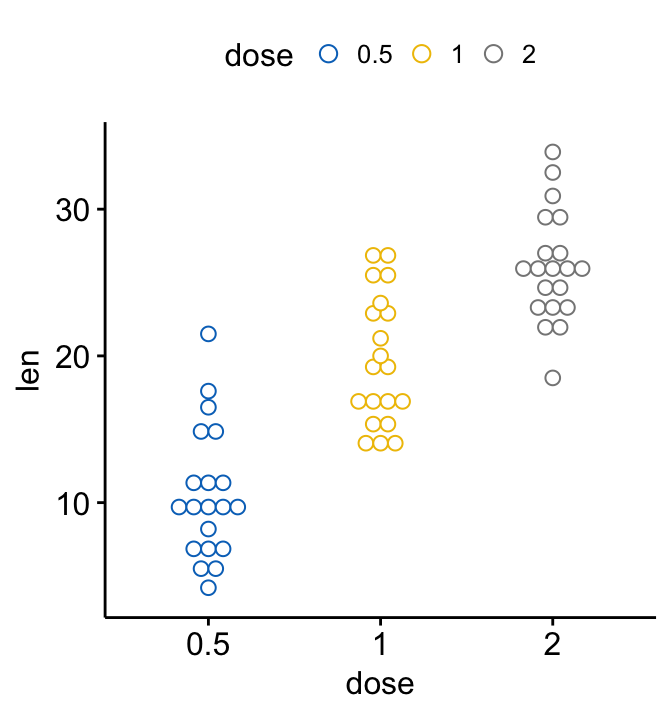
  • Create a box plot and a dot plot:
# Box plot (bp)
bxp <- ggboxplot(ToothGrowth, x = "dose", y = "len",
                 color = "dose", palette = "jco")
bxp
# Dot plot (dp)
dp <- ggdotplot(ToothGrowth, x = "dose", y = "len",
                 color = "dose", palette = "jco", binwidth = 1)
dp
Arrange multiple ggplots on the same pageArrange multiple ggplots on the same page

Arrange multiple ggplots on the same page

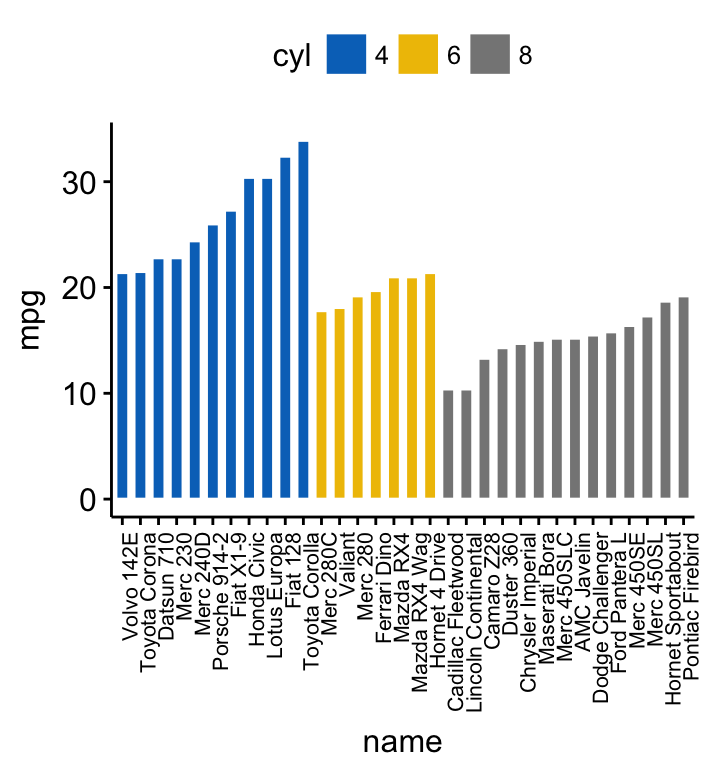
  • Create an ordered bar plot and a scatter plot:

Create ordered bar plots. Change the fill color by the grouping variable “cyl”. Sorting will be done globally, but not by groups.

# Bar plot (bp)
bp <- ggbarplot(mtcars, x = "name", y = "mpg",
          fill = "cyl",               # change fill color by cyl
          color = "white",            # Set bar border colors to white
          palette = "jco",            # jco journal color palett. see ?ggpar
          sort.val = "asc",           # Sort the value in ascending order
          sort.by.groups = TRUE,      # Sort inside each group
          x.text.angle = 90           # Rotate vertically x axis texts
          )
bp + font("x.text", size = 8)
# Scatter plots (sp)
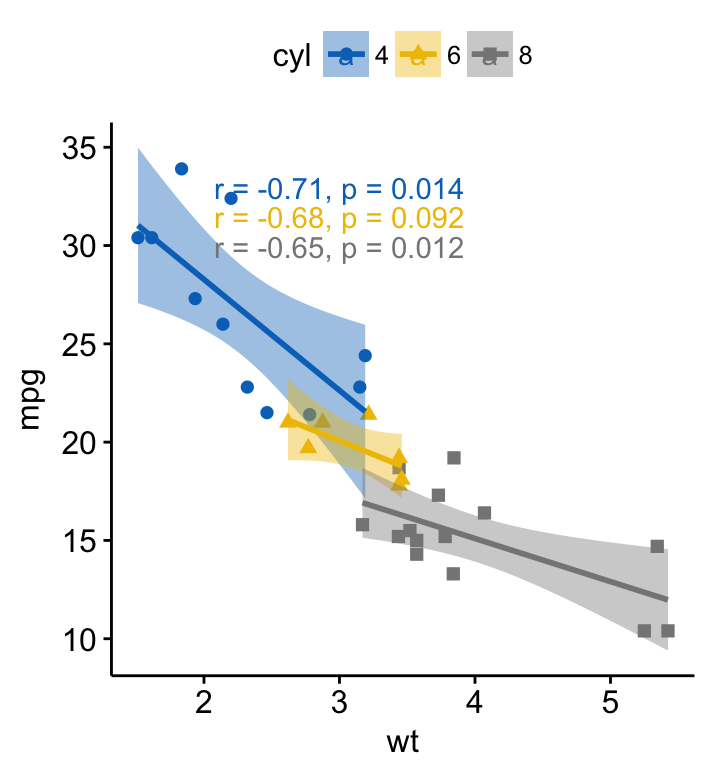
sp <- ggscatter(mtcars, x = "wt", y = "mpg",
                add = "reg.line",               # Add regression line
                conf.int = TRUE,                # Add confidence interval
                color = "cyl", palette = "jco", # Color by groups "cyl"
                shape = "cyl"                   # Change point shape by groups "cyl"
                )+
  stat_cor(aes(color = cyl), label.x = 3)       # Add correlation coefficient
sp
Arrange multiple ggplots on the same pageArrange multiple ggplots on the same page

Arrange multiple ggplots on the same page

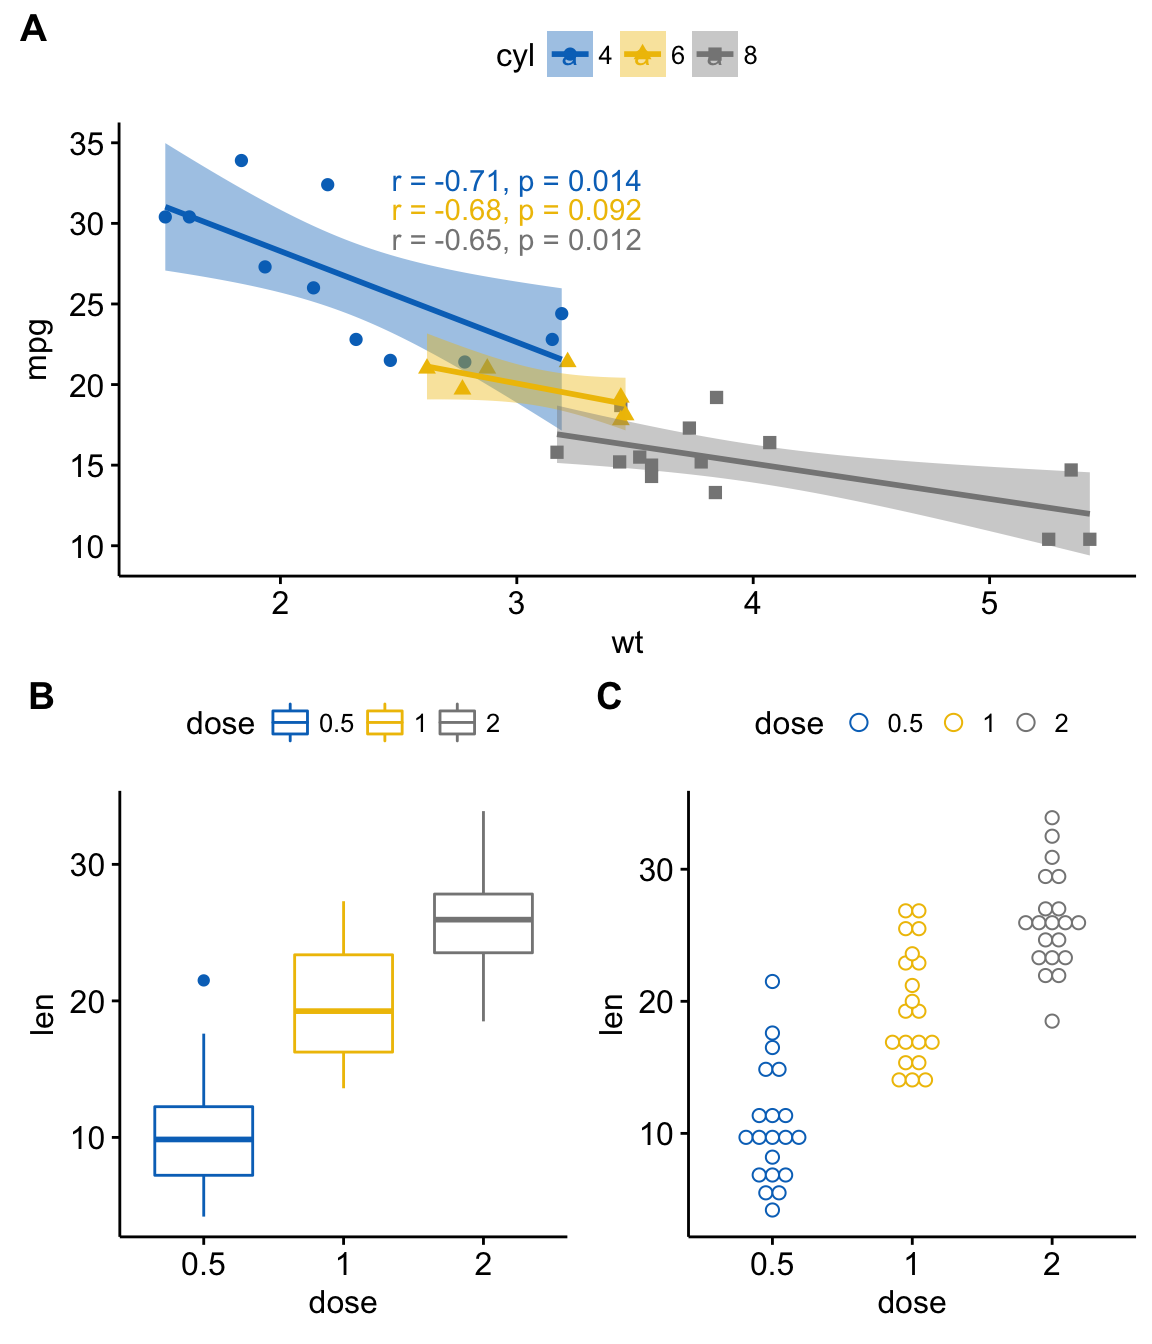
Arrange on one page

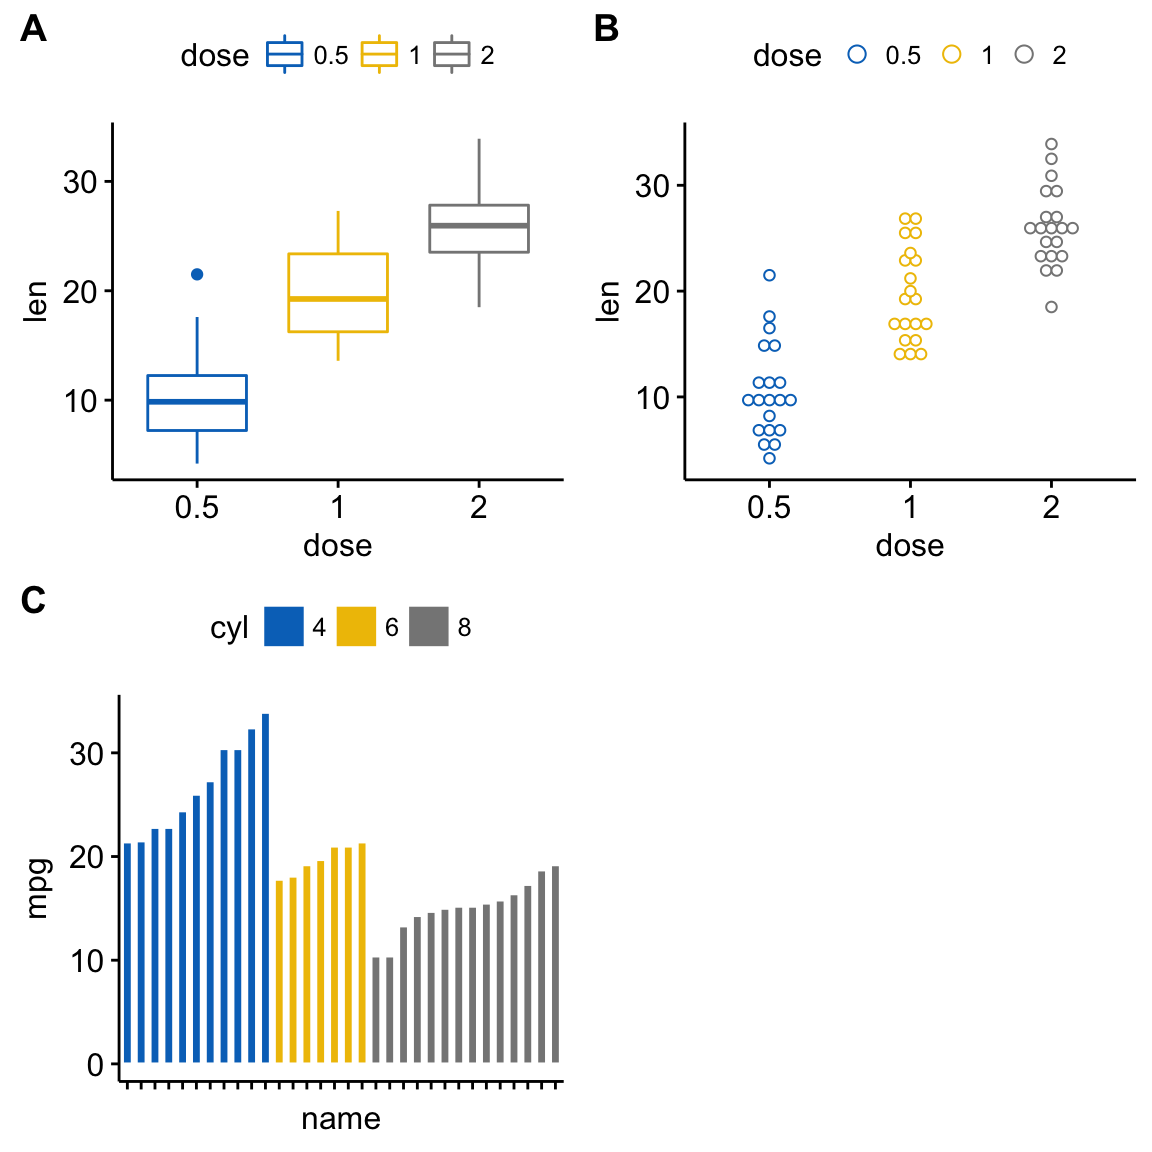
To arrange multiple ggplots on one single page, we’ll use the function ggarrange()[in ggpubr], which is a wrapper around the function plot_grid() [in cowplot package]. Compared to the standard function plot_grid(), ggarange() can arrange multiple ggplots over multiple pages.

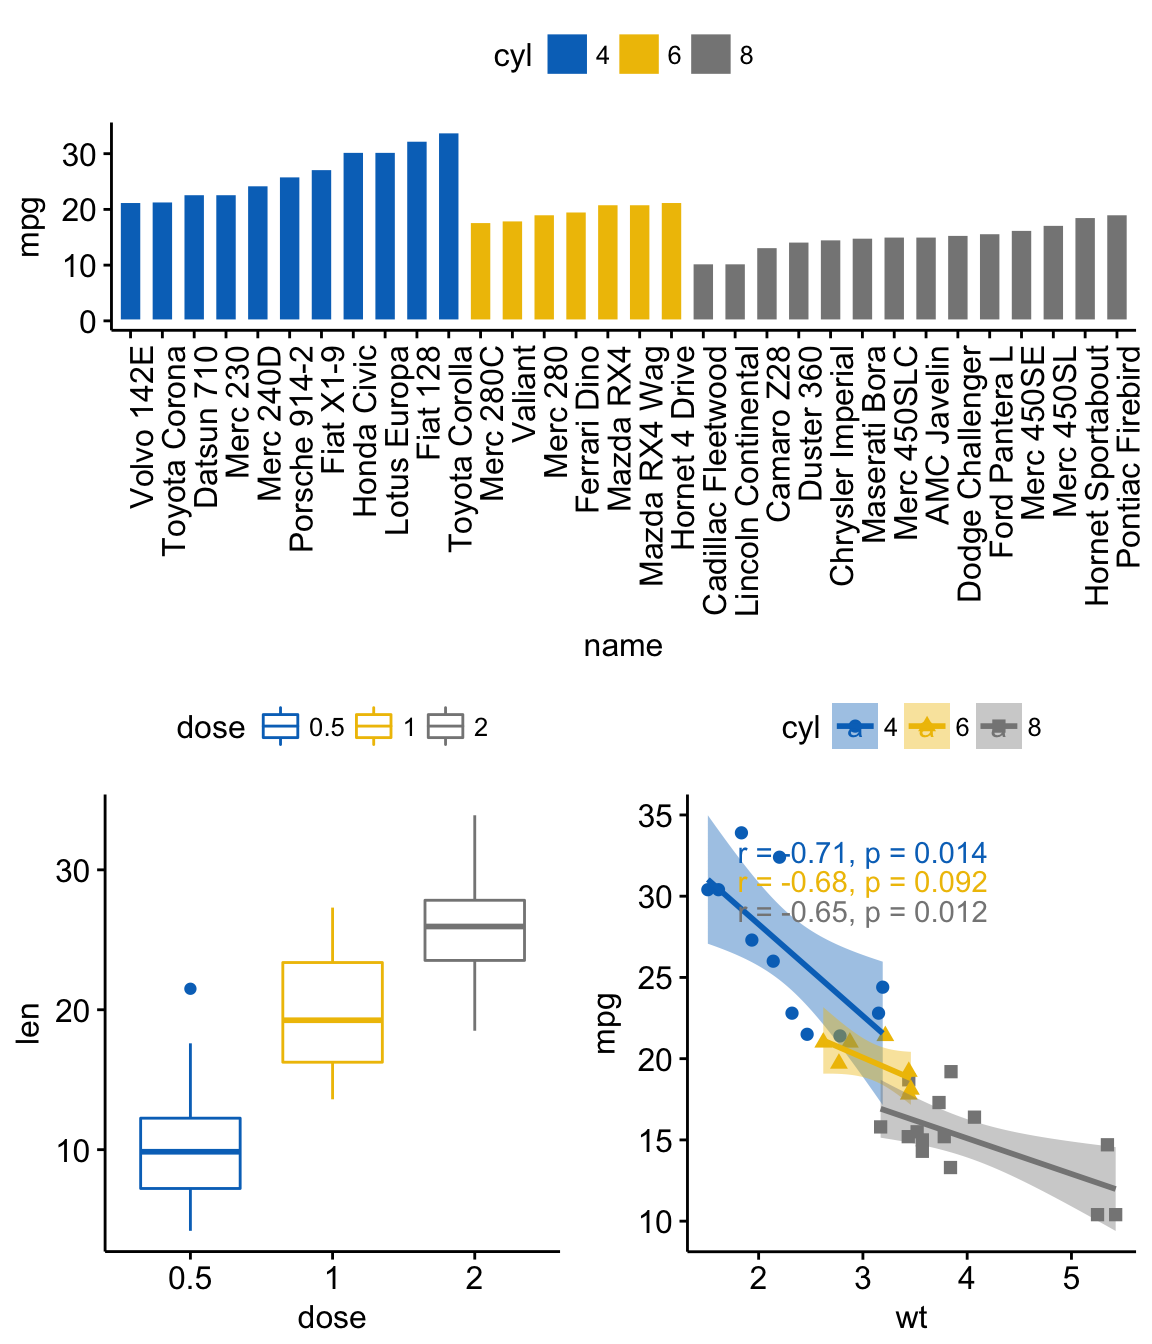
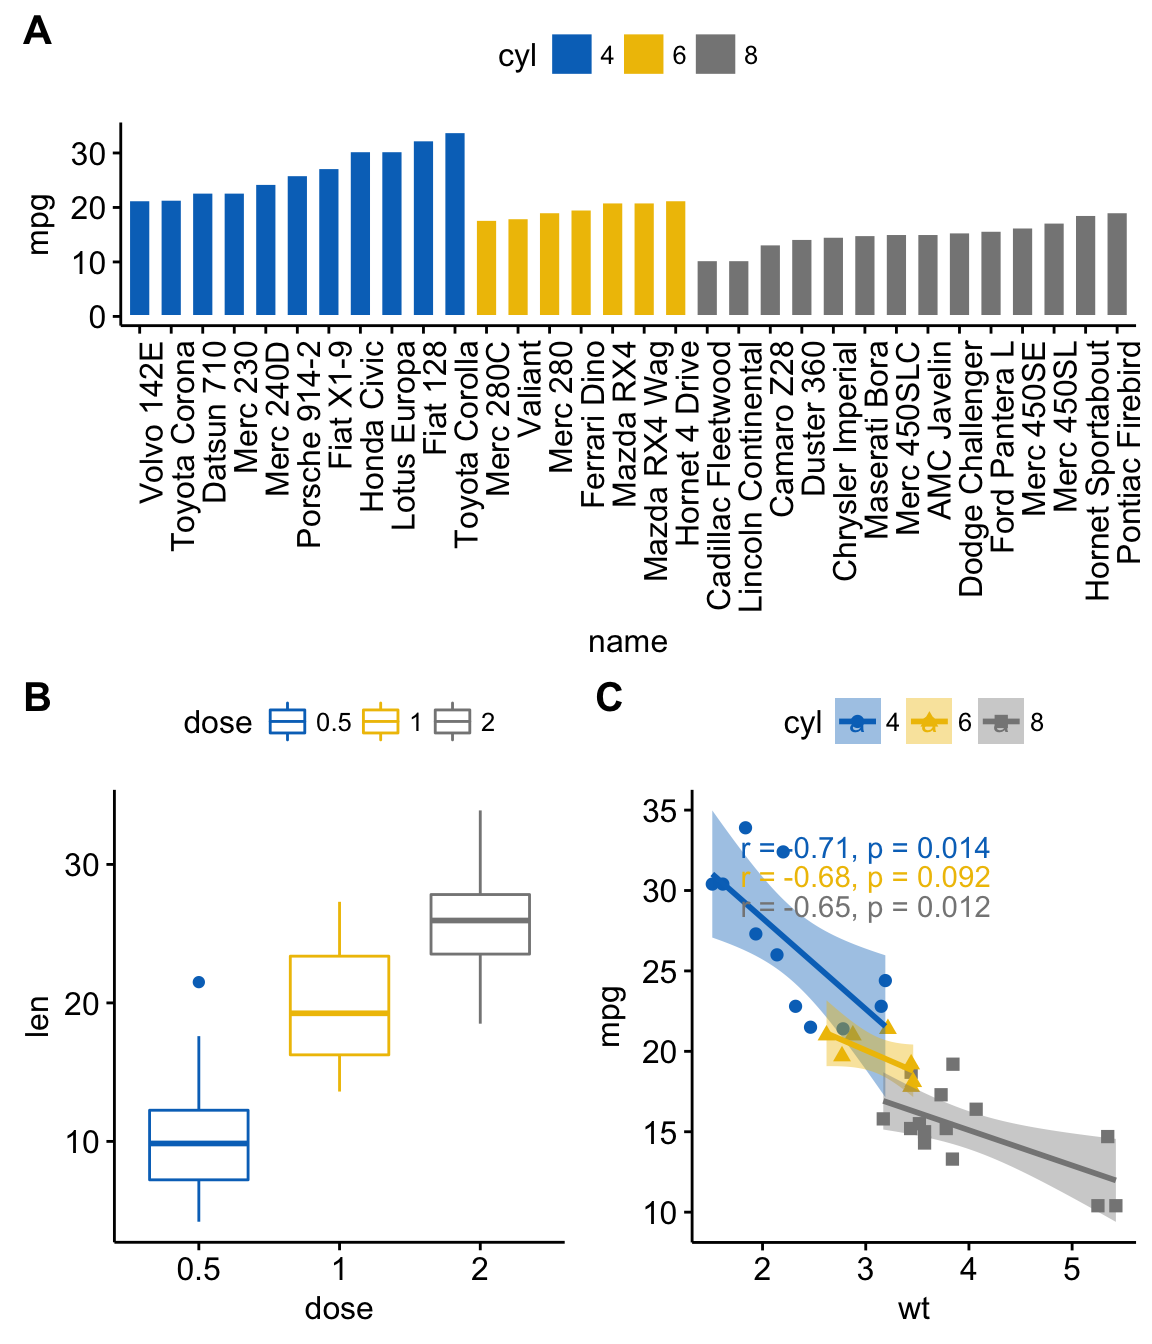
ggarrange(bxp, dp, bp + rremove("x.text"), 
          labels = c("A", "B", "C"),
          ncol = 2, nrow = 2)
Arrange multiple ggplots on the same page

Arrange multiple ggplots on the same page

Alternatively, you can also use the function plot_grid() [in cowplot]:

library("cowplot")
plot_grid(bxp, dp, bp + rremove("x.text"), 
          labels = c("A", "B", "C"),
          ncol = 2, nrow = 2)

or, the function grid.arrange() [in gridExtra]:

library("gridExtra")
grid.arrange(bxp, dp, bp + rremove("x.text"), 
             ncol = 2, nrow = 2)

Annotate the arranged figure

R function: annotate_figure() [in ggpubr].

figure <- ggarrange(sp, bp + font("x.text", size = 10),
                    ncol = 1, nrow = 2)
annotate_figure(figure,
                top = text_grob("Visualizing mpg", color = "red", face = "bold", size = 14),
                bottom = text_grob("Data source: \n mtcars data set", color = "blue",
                                   hjust = 1, x = 1, face = "italic", size = 10),
                left = text_grob("Figure arranged using ggpubr", color = "green", rot = 90),
                right = "I'm done, thanks :-)!",
                fig.lab = "Figure 1", fig.lab.face = "bold"
                )
Arrange multiple ggplots on the same page

Arrange multiple ggplots on the same page

Note that, the function annotate_figure() supports any ggplots.

Align plot panels

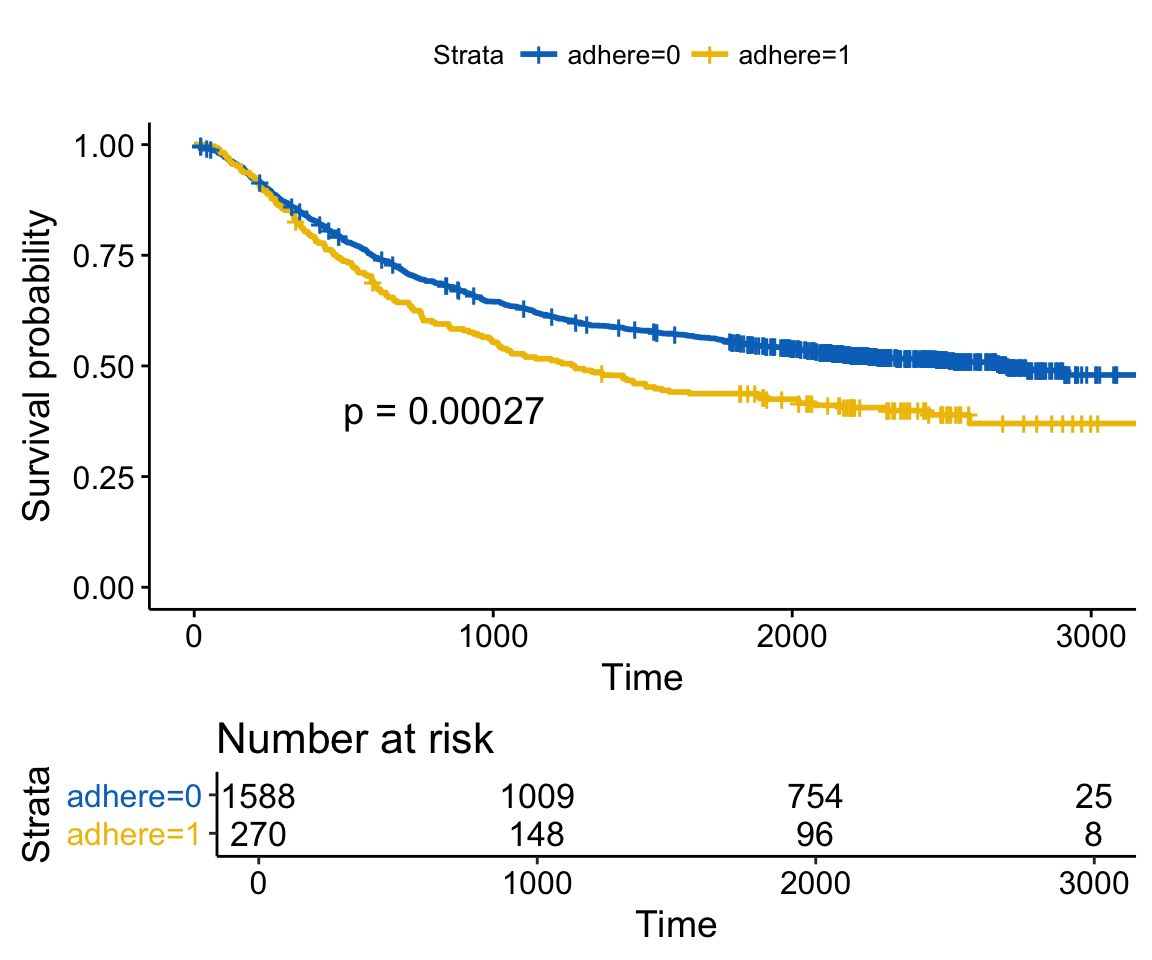
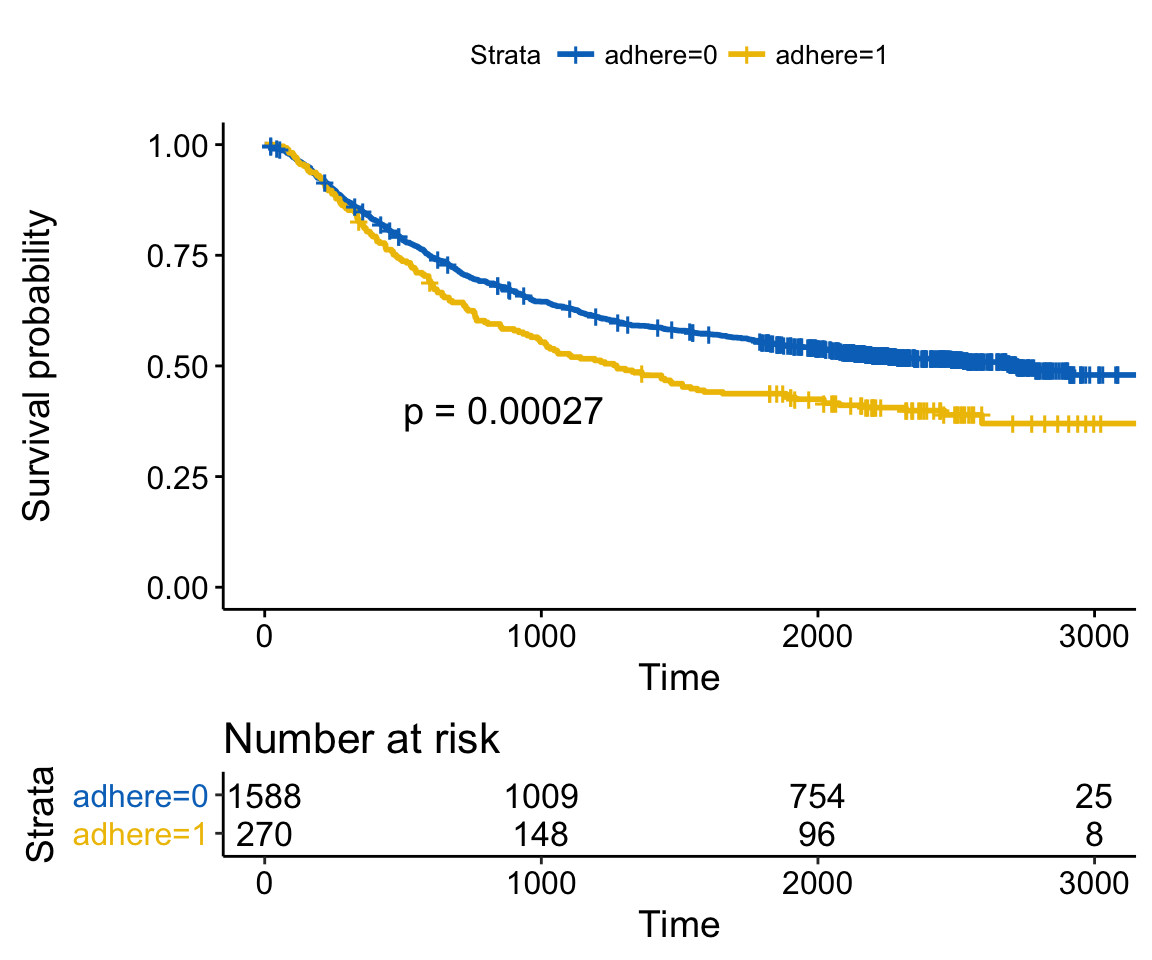
A real use case is, for example, when plotting survival curves with the risk table placed under the main plot.

To illustrate this case, we’ll use the survminer package. First, install it using install.packages(“survminer”), then type this:

# Fit survival curves
library(survival)
fit <- survfit( Surv(time, status) ~ adhere, data = colon )
# Plot survival curves
library(survminer)
ggsurv <- ggsurvplot(fit, data = colon, 
                     palette = "jco",                              # jco palette
                     pval = TRUE, pval.coord = c(500, 0.4),        # Add p-value
                     risk.table = TRUE                            # Add risk table
                     )
names(ggsurv)
[1] "plot""table""data.survplot""data.survtable"

ggsurv is a list including the components:

  • plot: survival curves
  • table: the risk table plot

You can arrange the survival plot and the risk table as follow:

ggarrange(ggsurv$plot, ggsurv$table, heights = c(2, 0.7),
          ncol = 1, nrow = 2)
Arrange multiple ggplots on the same page

Arrange multiple ggplots on the same page

It can be seen that the axes of the survival plot and the risk table are not aligned vertically. To align them, specify the argument align as follow.

ggarrange(ggsurv$plot, ggsurv$table, heights = c(2, 0.7),
          ncol = 1, nrow = 2, align = "v")
Arrange multiple ggplots on the same page

Arrange multiple ggplots on the same page

Change column/row span of a plot

Use ggpubr R package

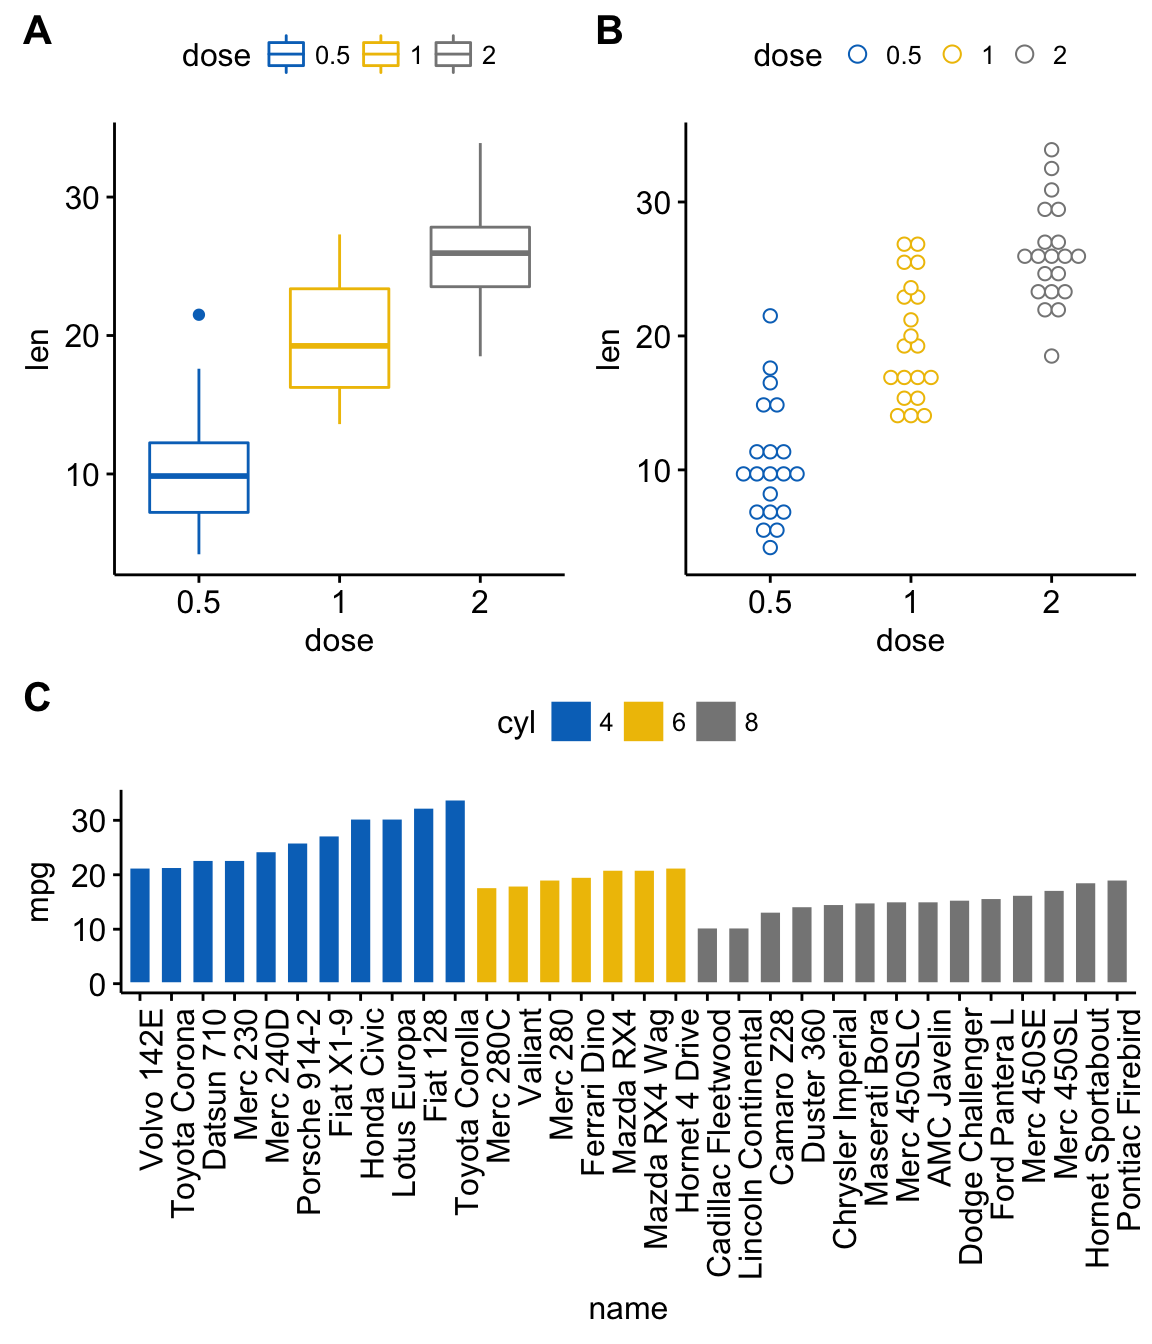
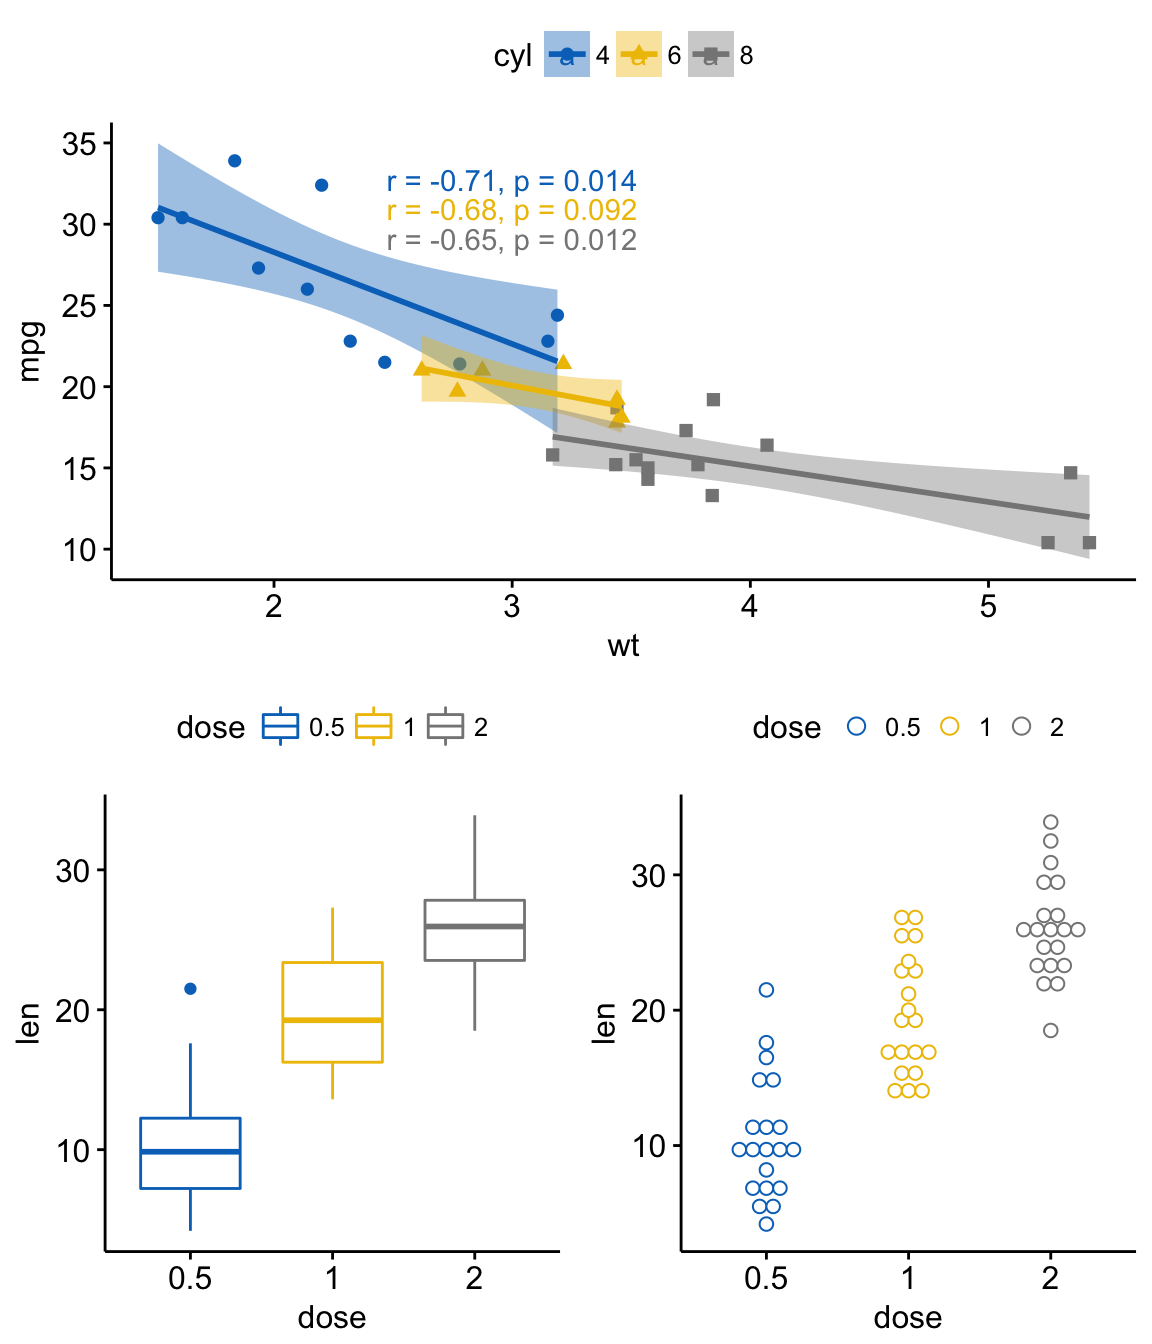
We’ll use nested ggarrange() functions to change column/row span of plots.

For example, using the R code below:

  • the scatter plot (sp) will live in the first row and spans over two columns
  • the box plot (bxp) and the dot plot (dp) will be first arranged and will live in the second row with two different columns
ggarrange(sp,                                                 # First row with scatter plot
          ggarrange(bxp, dp, ncol = 2, labels = c("B", "C")), # Second row with box and dot plots
          nrow = 2, 
          labels = "A"                                        # Labels of the scatter plot
          ) 
Arrange multiple ggplots on the same page

Arrange multiple ggplots on the same page

Use cowplot R package

The combination of the functions ggdraw() + draw_plot() + draw_plot_label() [in cowplot] can be used to place graphs at particular locations with a particular size.

ggdraw(). Initialize an empty drawing canvas:

ggdraw()

Note that, by default, coordinates run from 0 to 1, and the point (0, 0) is in the lower left corner of the canvas (see the figure below).

draw_plot

draw_plot(). Places a plot somewhere onto the drawing canvas:

draw_plot(plot, x = 0, y = 0, width = 1, height = 1)
  • plot: the plot to place (ggplot2 or a gtable)
  • x, y: The x/y location of the lower left corner of the plot.
  • width, height: the width and the height of the plot

draw_plot_label(). Adds a plot label to the upper left corner of a graph. It can handle vectors of labels with associated coordinates.

draw_plot_label(label, x = 0, y = 1, size = 16, ...)
  • label: a vector of labels to be drawn
  • x, y: Vector containing the x and y position of the labels, respectively.
  • size: Font size of the label to be drawn

For example, you can combine multiple plots, with particular locations and different sizes, as follow:

library("cowplot")
ggdraw() +
  draw_plot(bxp, x = 0, y = .5, width = .5, height = .5) +
  draw_plot(dp, x = .5, y = .5, width = .5, height = .5) +
  draw_plot(bp, x = 0, y = 0, width = 1, height = 0.5) +
  draw_plot_label(label = c("A", "B", "C"), size = 15,
                  x = c(0, 0.5, 0), y = c(1, 1, 0.5))
Arrange multiple ggplots on the same page

Arrange multiple ggplots on the same page

Use gridExtra R package

The function arrangeGrop() [in gridExtra] helps to change the row/column span of a plot.

For example, using the R code below:

  • the scatter plot (sp) will live in the first row and spans over two columns
  • the box plot (bxp) and the dot plot (dp) will live in the second row with two plots in two different columns
library("gridExtra")
grid.arrange(sp,                             # First row with one plot spaning over 2 columns
             arrangeGrob(bxp, dp, ncol = 2), # Second row with 2 plots in 2 different columns
             nrow = 2)                       # Number of rows
Arrange multiple ggplots on the same page

Arrange multiple ggplots on the same page

It’s also possible to use the argument layout_matrix in the grid.arrange() function, to create a complex layout.

In the R code below layout_matrix is a 2x2 matrix (2 columns and 2 rows). The first row is all 1s, that’s where the first plot lives, spanning the two columns; the second row contains plots 2 and 3 each occupying one column.

grid.arrange(bp,                                    # bar plot spaning two columns
             bxp, sp,                               # box plot and scatter plot
             ncol = 2, nrow = 2, 
             layout_matrix = rbind(c(1,1), c(2,3)))
Arrange multiple ggplots on the same page

Arrange multiple ggplots on the same page

Note that, it’s also possible to annotate the output of the grid.arrange() function using the helper function draw_plot_label() [in cowplot].

To easily annotate the grid.arrange() / arrangeGrob() output (a gtable), you should first transform it to a ggplot using the function as_ggplot() [in ggpubr ]. Next you can annotate it using the function draw_plot_label() [in cowplot].

library("gridExtra")
library("cowplot")
# Arrange plots using arrangeGrob
# returns a gtable (gt)
gt <- arrangeGrob(bp,                               # bar plot spaning two columns
             bxp, sp,                               # box plot and scatter plot
             ncol = 2, nrow = 2, 
             layout_matrix = rbind(c(1,1), c(2,3)))
# Add labels to the arranged plots
p <- as_ggplot(gt) +                                # transform to a ggplot
  draw_plot_label(label = c("A", "B", "C"), size = 15,
                  x = c(0, 0, 0.5), y = c(1, 0.5, 0.5)) # Add labels
p
Arrange multiple ggplots on the same page

Arrange multiple ggplots on the same page

In the above R code, we used arrangeGrob() instead of grid.arrange().

Note that, the main difference between these two functions is that, grid.arrange() draw automatically the output of the arranged plots.

As we want to annotate the arranged plots before drawing it, the function arrangeGrob() is preferred in this case.

Use grid R package

The grid R package can be used to create a complex layout with the help of the function grid.layout(). It provides also the helper function viewport() to define a region or a viewport on the layout. The function print() is used to place plots in a specified region.

The different steps can be summarized as follow :

  1. Create plots : p1, p2, p3, ….
  2. Move to a new page on a grid device using the function grid.newpage()
  3. Create a layout 2X2 - number of columns = 2; number of rows = 2
  4. Define a grid viewport : a rectangular region on a graphics device
  5. Print a plot into the viewport
library(grid)
# Move to a new page
grid.newpage()
# Create layout : nrow = 3, ncol = 2
pushViewport(viewport(layout = grid.layout(nrow = 3, ncol = 2)))
# A helper function to define a region on the layout
define_region <- function(row, col){
  viewport(layout.pos.row = row, layout.pos.col = col)
} 
# Arrange the plots
print(sp, vp = define_region(row = 1, col = 1:2))   # Span over two columns
print(bxp, vp = define_region(row = 2, col = 1))
print(dp, vp = define_region(row = 2, col = 2))
print(bp + rremove("x.text"), vp = define_region(row = 3, col = 1:2))
Arrange multiple ggplots on the same page

Arrange multiple ggplots on the same page

Use common legend for combined ggplots

To place a common unique legend in the margin of the arranged plots, the function ggarrange() [in ggpubr] can be used with the following arguments:

  • common.legend = TRUE: place a common legend in a margin
  • legend: specify the legend position. Allowed values include one of c(“top”, “bottom”, “left”, “right”)
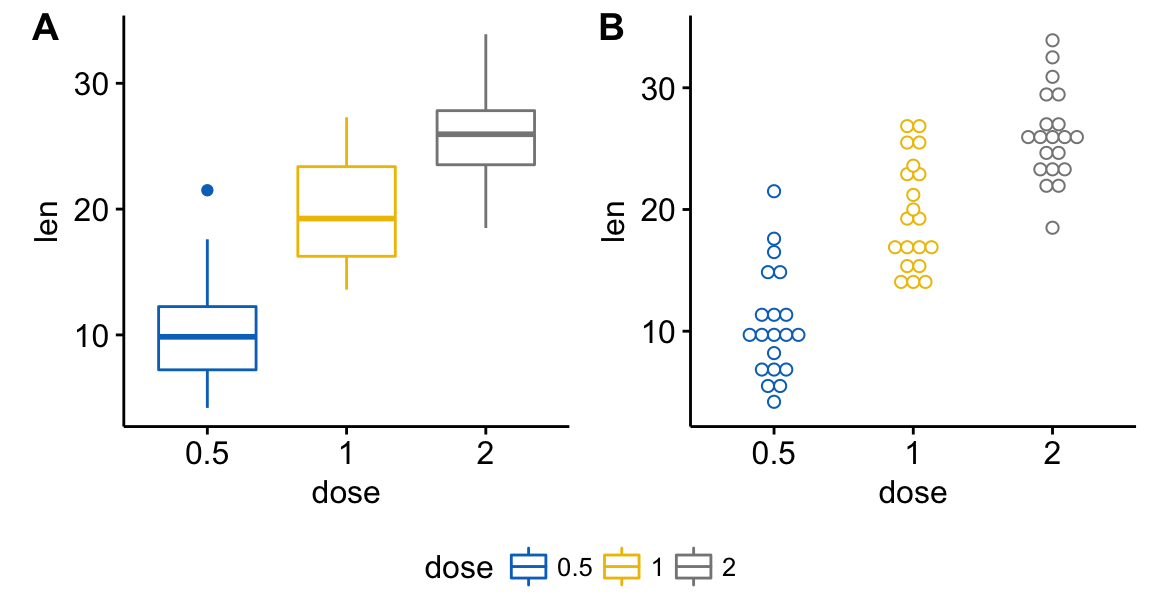
ggarrange(bxp, dp, labels = c("A", "B"),
          common.legend = TRUE, legend = "bottom")
Arrange multiple ggplots on the same page

Arrange multiple ggplots on the same page

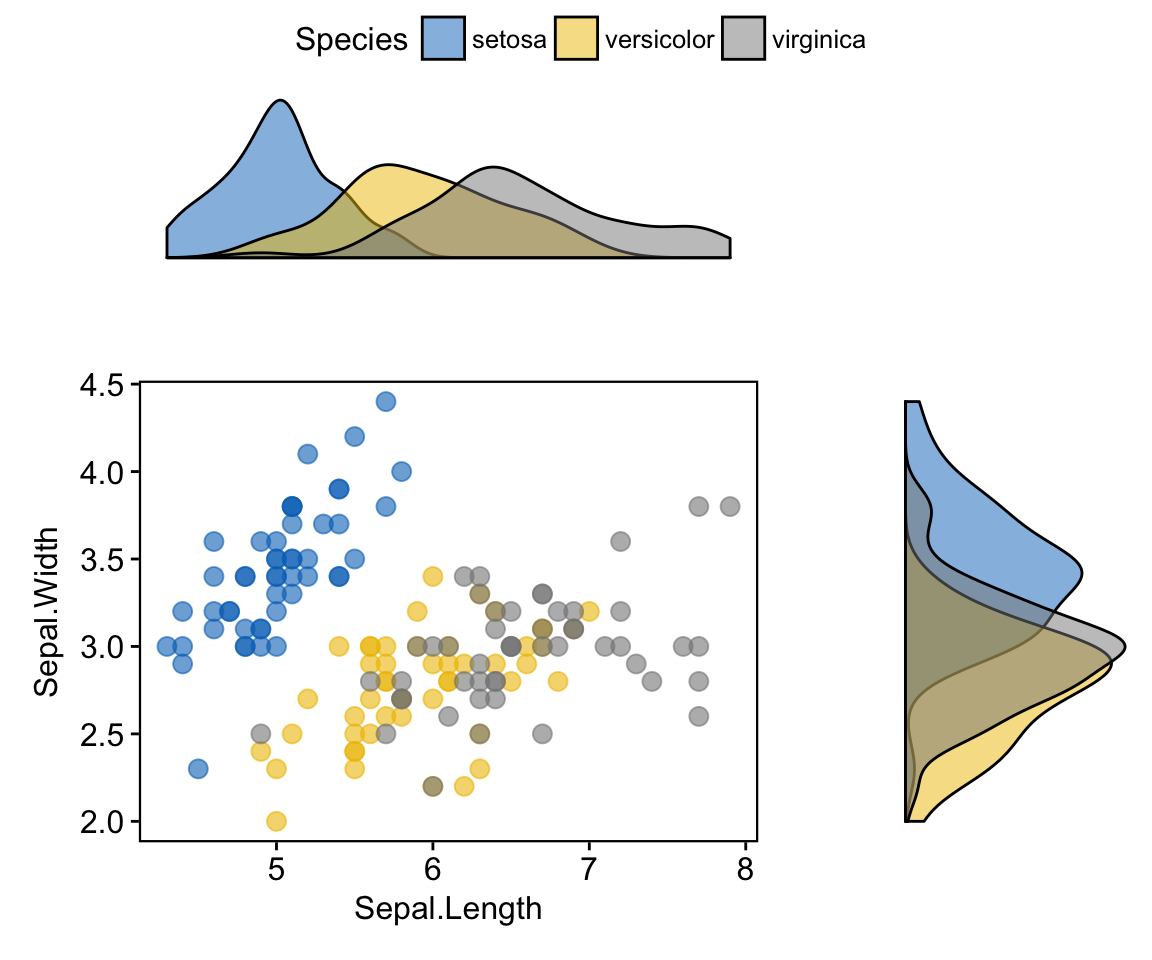
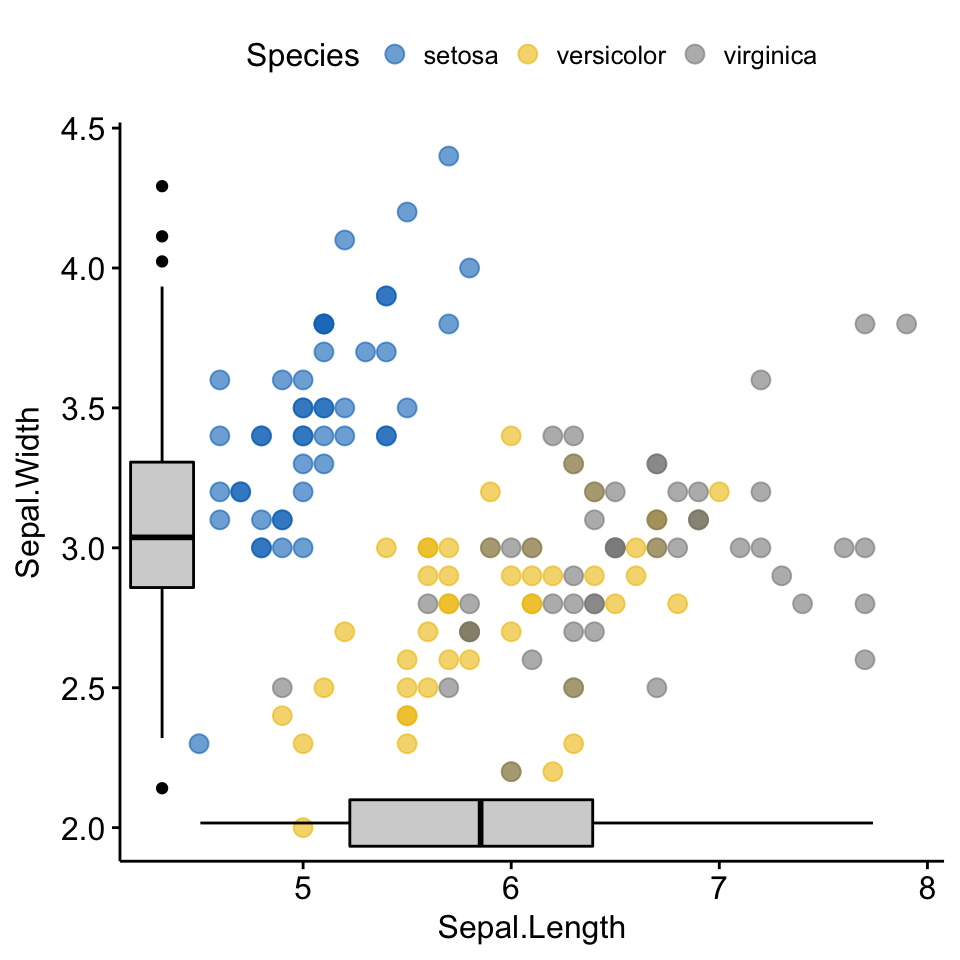
Scatter plot with marginal density plots

# Scatter plot colored by groups ("Species")
sp <- ggscatter(iris, x = "Sepal.Length", y = "Sepal.Width",
                color = "Species", palette = "jco",
                size = 3, alpha = 0.6)+
  border()                                         
# Marginal density plot of x (top panel) and y (right panel)
xplot <- ggdensity(iris, "Sepal.Length", fill = "Species",
                   palette = "jco")
yplot <- ggdensity(iris, "Sepal.Width", fill = "Species", 
                   palette = "jco")+
  rotate()
# Cleaning the plots
yplot <- yplot + clean_theme() 
xplot <- xplot + clean_theme()
# Arranging the plot
ggarrange(xplot, NULL, sp, yplot, 
          ncol = 2, nrow = 2,  align = "hv", 
          widths = c(2, 1), heights = c(1, 2),
          common.legend = TRUE)
Arrange multiple ggplots on the same page

Arrange multiple ggplots on the same page

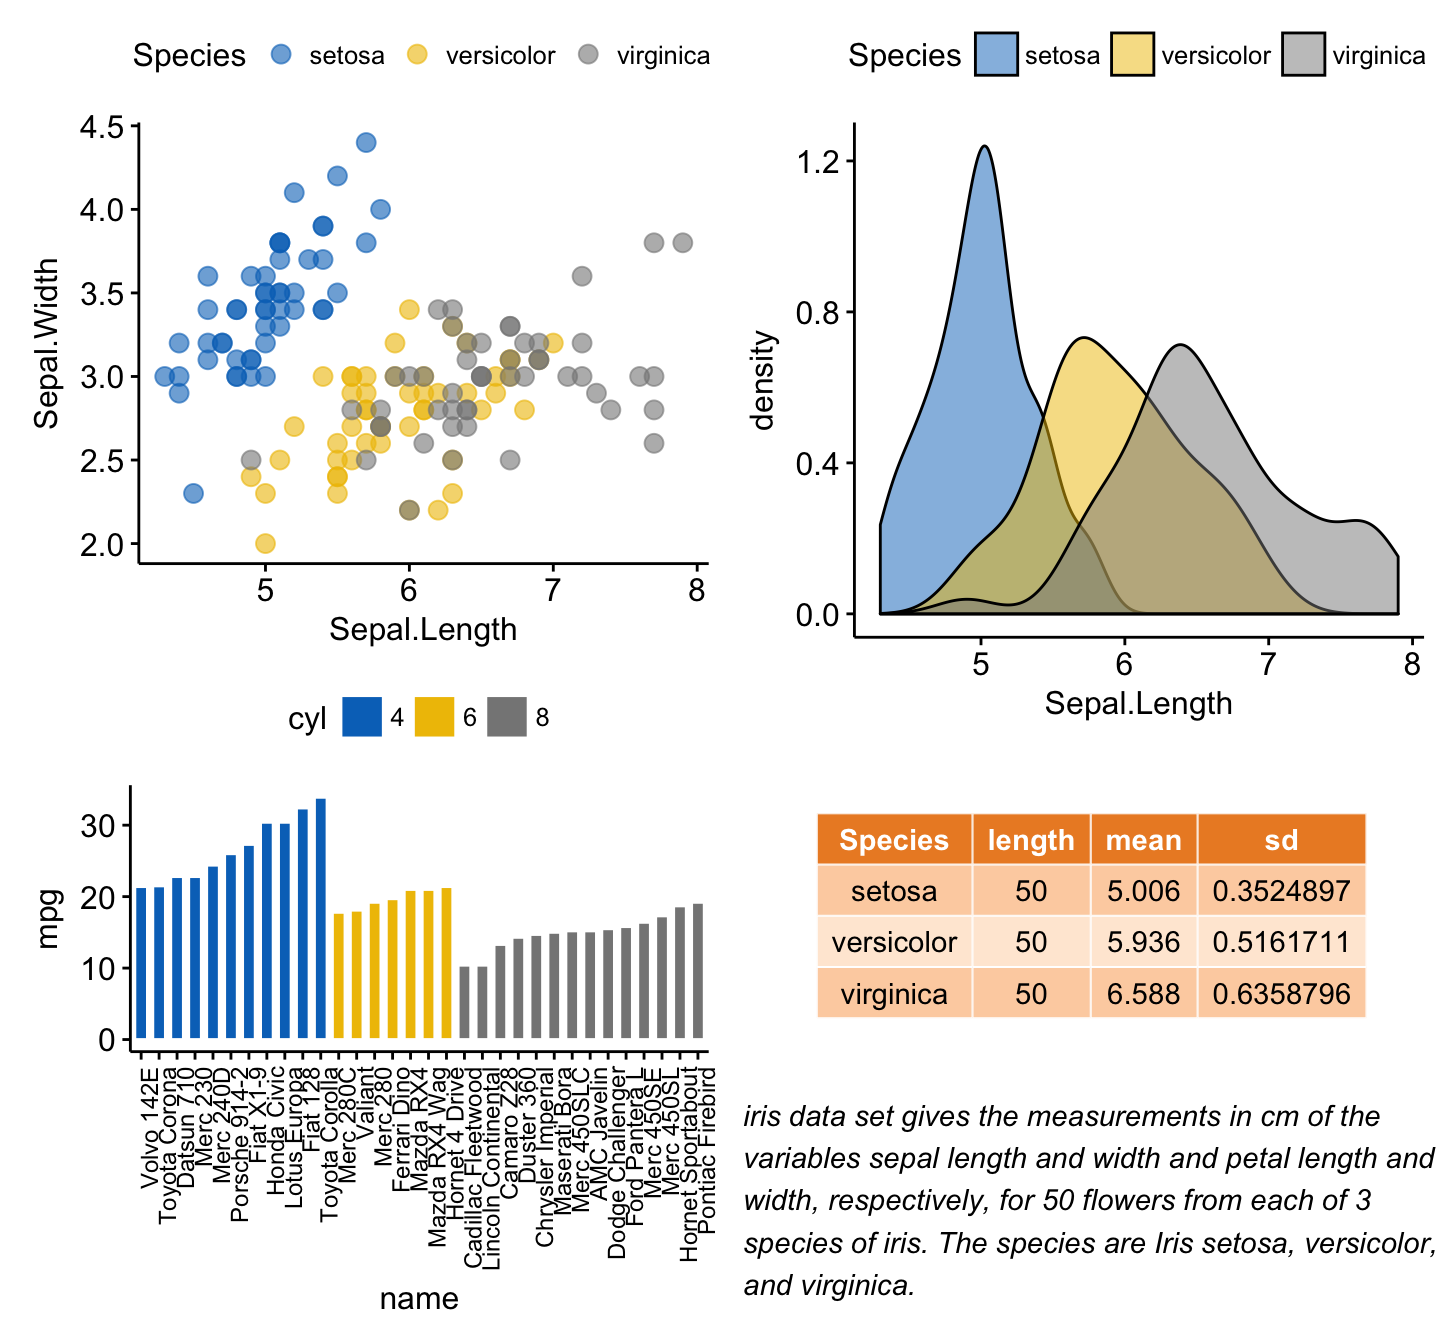
Mix table, text and ggplot2 graphs

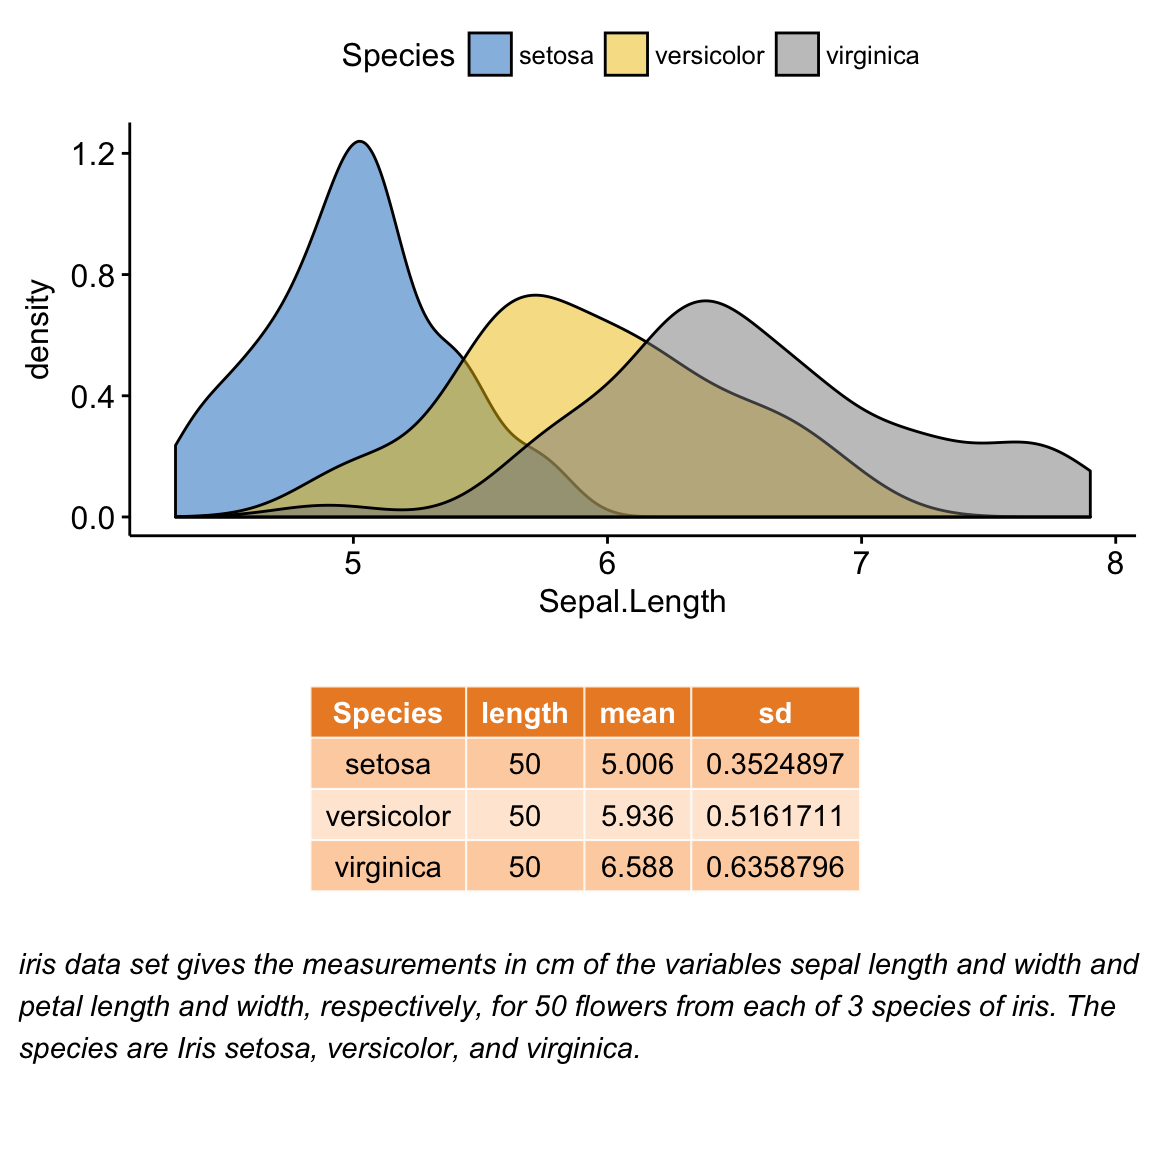
In this section, we’ll show how to plot a table and text alongside a chart. The iris data set will be used.

We start by creating the following plots:

  1. a density plot of the variable “Sepal.Length”. R function: ggdensity() [in ggpubr]
  2. a plot of the summary table containing the descriptive statistics (mean, sd, … ) of Sepal.Length.
    • R function for computing descriptive statistics: desc_statby() [in ggpubr].
    • R function to draw a textual table: ggtexttable() [in ggpubr].
  3. a plot of a text paragraph. R function: ggparagraph() [in ggpubr].

We finish by arranging/combining the three plots using the function ggarrange() [in ggpubr]

# Density plot of "Sepal.Length"
#::::::::::::::::::::::::::::::::::::::
density.p <- ggdensity(iris, x = "Sepal.Length", 
                       fill = "Species", palette = "jco")
# Draw the summary table of Sepal.Length
#::::::::::::::::::::::::::::::::::::::
# Compute descriptive statistics by groups
stable <- desc_statby(iris, measure.var = "Sepal.Length",
                      grps = "Species")
stable <- stable[, c("Species", "length", "mean", "sd")]
# Summary table plot, medium orange theme
stable.p <- ggtexttable(stable, rows = NULL, 
                        theme = ttheme("mOrange"))
# Draw text
#::::::::::::::::::::::::::::::::::::::
text <- paste("iris data set gives the measurements in cm",
              "of the variables sepal length and width",
              "and petal length and width, respectively,",
              "for 50 flowers from each of 3 species of iris.",
             "The species are Iris setosa, versicolor, and virginica.", sep = "")
text.p <- ggparagraph(text = text, face = "italic", size = 11, color = "black")
# Arrange the plots on the same page
ggarrange(density.p, stable.p, text.p, 
          ncol = 1, nrow = 3,
          heights = c(1, 0.5, 0.3))
Arrange multiple ggplots on the same page

Arrange multiple ggplots on the same page

Insert a graphical element inside a ggplot

The function annotation_custom() [in ggplot2] can be used for adding tables, plots or other grid-based elements within the plotting area of a ggplot. The simplified format is :

annotation_custom(grob, xmin, xmax, ymin, ymax)
  • grob: the external graphical element to display
  • xmin, xmax : x location in data coordinates (horizontal location)
  • ymin, ymax : y location in data coordinates (vertical location)

Place a table within a ggplot

We’ll use the plots - density.p and stable.p - created in the previous section (@ref(mix-table-text-and-ggplot)).

density.p + annotation_custom(ggplotGrob(stable.p),
                              xmin = 5.5, ymin = 0.7,
                              xmax = 8)
Arrange multiple ggplots on the same page

Arrange multiple ggplots on the same page

Place a box plot within a ggplot

  1. Create a scatter plot of y = “Sepal.Width” by x = “Sepal.Length” using the iris data set. R function ggscatter() [ggpubr]
  2. Create separately the box plot of x and y variables with transparent background. R function: ggboxplot() [ggpubr].
  3. Transform the box plots into graphical objects called a “grop” in Grid terminology. R function ggplotGrob() [ggplot2].
  4. Place the box plot grobs inside the scatter plot. R function: annotation_custom() [ggplot2].

As the inset box plot overlaps with some points, a transparent background is used for the box plots.

# Scatter plot colored by groups ("Species")
#::::::::::::::::::::::::::::::::::::::::::::::::::::::::::
sp <- ggscatter(iris, x = "Sepal.Length", y = "Sepal.Width",
                color = "Species", palette = "jco",
                size = 3, alpha = 0.6)
# Create box plots of x/y variables
#::::::::::::::::::::::::::::::::::::::::::::::::::::::::::
# Box plot of the x variable
xbp <- ggboxplot(iris$Sepal.Length, width = 0.3, fill = "lightgray") +
  rotate() +
  theme_transparent()
# Box plot of the y variable
ybp <- ggboxplot(iris$Sepal.Width, width = 0.3, fill = "lightgray") +
  theme_transparent()
# Create the external graphical objects
# called a "grop" in Grid terminology
xbp_grob <- ggplotGrob(xbp)
ybp_grob <- ggplotGrob(ybp)
# Place box plots inside the scatter plot
#::::::::::::::::::::::::::::::::::::::::::::::::::::::::::
xmin <- min(iris$Sepal.Length); xmax <- max(iris$Sepal.Length)
ymin <- min(iris$Sepal.Width); ymax <- max(iris$Sepal.Width)
yoffset <- (1/15)*ymax; xoffset <- (1/15)*xmax
# Insert xbp_grob inside the scatter plot
sp + annotation_custom(grob = xbp_grob, xmin = xmin, xmax = xmax, 
                       ymin = ymin-yoffset, ymax = ymin+yoffset) +
  # Insert ybp_grob inside the scatter plot
  annotation_custom(grob = ybp_grob,
                       xmin = xmin-xoffset, xmax = xmin+xoffset, 
                       ymin = ymin, ymax = ymax)
Arrange multiple ggplots on the same page

Arrange multiple ggplots on the same page

Add background image to ggplot2 graphs

Import the background image. Use either the function readJPEG() [in jpeg package] or the function readPNG() [in png package] depending on the format of the background image.

To test the example below, make sure that the png package is installed. You can install it using install.packages(“png”) R command.

# Import the image
img.file <- system.file(file.path("images", "background-image.png"),
                        package = "ggpubr")
img <- png::readPNG(img.file)

Combine a ggplot with the background image. R function: background_image() [in ggpubr].

library(ggplot2)
library(ggpubr)
ggplot(iris, aes(Species, Sepal.Length))+
  background_image(img)+
  geom_boxplot(aes(fill = Species), color = "white")+
  fill_palette("jco")
Arrange multiple ggplots on the same page

Arrange multiple ggplots on the same page

Change box plot fill color transparency by specifying the argument alpha. Value should be in [0, 1], where 0 is full transparency and 1 is no transparency.

library(ggplot2)
library(ggpubr)
ggplot(iris, aes(Species, Sepal.Length))+
  background_image(img)+
  geom_boxplot(aes(fill = Species), color = "white", alpha = 0.5)+
  fill_palette("jco")
Arrange multiple ggplots on the same page

Arrange multiple ggplots on the same page

Another example, overlaying the France map and a ggplot2:

mypngfile <- download.file("https://upload.wikimedia.org/wikipedia/commons/thumb/e/e4/France_Flag_Map.svg/612px-France_Flag_Map.svg.png", 
                           destfile = "france.png", mode = 'wb') 
img <- png::readPNG('france.png') 
ggplot(iris, aes(x = Sepal.Length, y = Sepal.Width)) +
  background_image(img)+
  geom_point(aes(color = Species), alpha = 0.6, size = 5)+
  color_palette("jco")+
  theme(legend.position = "top")
Arrange multiple ggplots on the same page

Arrange multiple ggplots on the same page

Arrange over multiple pages

If you have a long list of ggplots, say n = 20 plots, you may want to arrange the plots and to place them on multiple pages. With 4 plots per page, you need 5 pages to hold the 20 plots.

The function ggarrange() [in ggpubr] provides a convenient solution to arrange multiple ggplots over multiple pages. After specifying the arguments nrow and ncol, the function ggarrange() computes automatically the number of pages required to hold the list of the plots. It returns a list of arranged ggplots.

For example the following R code,

multi.page <- ggarrange(bxp, dp, bp, sp,
                        nrow = 1, ncol = 2)

returns a list of two pages with two plots per page. You can visualize each page as follow:

multi.page[[1]] # Visualize page 1
multi.page[[2]] # Visualize page 2

You can also export the arranged plots to a pdf file using the function ggexport() [in ggpubr]:

ggexport(multi.page, filename = "multi.page.ggplot2.pdf")

PDF file: Multi.page.ggplot2

Note that, it’s also possible to use the function marrangeGrob() [in gridExtra] to create a multi-pages output.

library(gridExtra)
res <- marrangeGrob(list(bxp, dp, bp, sp), nrow = 1, ncol = 2)
# Export to a pdf file
ggexport(res, filename = "multi.page.ggplot2.pdf")
# Visualize interactively
res

Nested layout with ggarrange()

We’ll arrange the plot created in section (@ref(mix-table-text-and-ggplot)) and (@ref(create-some-plots)).

p1 <- ggarrange(sp, bp + font("x.text", size = 9),
                ncol = 1, nrow = 2)
p2 <- ggarrange(density.p, stable.p, text.p, 
                ncol = 1, nrow = 3,
                heights = c(1, 0.5, 0.3))
ggarrange(p1, p2, ncol = 2, nrow = 1)
Arrange multiple ggplots on the same page

Arrange multiple ggplots on the same page

Export plots

R function: ggexport() [in ggpubr].

First, create a list of 4 ggplots corresponding to the variables Sepal.Length, Sepal.Width, Petal.Length and Petal.Width in the iris data set.

plots <- ggboxplot(iris, x = "Species",
                   y = c("Sepal.Length", "Sepal.Width", "Petal.Length", "Petal.Width"),
                   color = "Species", palette = "jco"
                   )
plots[[1]]  # Print the first plot
plots[[2]]  # Print the second plots and so on...

Next, you can export individual plots to a file (pdf, eps or png) (one plot per page). It’s also possible to arrange the plots (2 plot per page) when exporting them.

Export individual plots to a pdf file (one plot per page):

ggexport(plotlist = plots, filename = "test.pdf")

Arrange and export. Specify nrow and ncol to display multiple plots on the same page:

ggexport(plotlist = plots, filename = "test.pdf",
         nrow = 2, ncol = 1)

Acknoweledgment

We sincerely thank all developers for their efforts behind the packages that ggpubr depends on, namely:

Infos

This analysis has been performed using R software (ver. 3.3.2) and ggpubr (ver. 0.1.4.999).

F-Test: Compare Two Variances in R

$
0
0

F-test is used to assess whether the variances of two populations (A and B) are equal.


F-Test in R: Compare Two Sample Variances

Contents

When to you use F-test?

Comparing two variances is useful in several cases, including:

  • When you want to perform a two samples t-test to check the equality of the variances of the two samples

  • When you want to compare the variability of a new measurement method to an old one. Does the new method reduce the variability of the measure?

Research questions and statistical hypotheses

Typical research questions are:


  1. whether the variance of group A (\(\sigma^2_A\)) is equal to the variance of group B (\(\sigma^2_B\))?
  2. whether the variance of group A (\(\sigma^2_A\)) is less than the variance of group B (\(\sigma^2_B\))?
  3. whether the variance of group A (\(\sigma^2_A\)) is greather than the variance of group B (\(\sigma^2_B\))?


In statistics, we can define the corresponding null hypothesis (\(H_0\)) as follow:

  1. \(H_0: \sigma^2_A = \sigma^2_B\)
  2. \(H_0: \sigma^2_A \leq \sigma^2_B\)
  3. \(H_0: \sigma^2_A \geq \sigma^2_B\)

The corresponding alternative hypotheses (\(H_a\)) are as follow:

  1. \(H_a: \sigma^2_A \ne \sigma^2_B\) (different)
  2. \(H_a: \sigma^2_A > \sigma^2_B\) (greater)
  3. \(H_a: \sigma^2_A < \sigma^2_B\) (less)

Note that:

  • Hypotheses 1) are called two-tailed tests
  • Hypotheses 2) and 3) are called one-tailed tests

Formula of F-test

The test statistic can be obtained by computing the ratio of the two variances \(S_A^2\) and \(S_B^2\).

\[F = \frac{S_A^2}{S_B^2}\]

The degrees of freedom are \(n_A - 1\) (for the numerator) and \(n_B - 1\) (for the denominator).

Note that, the more this ratio deviates from 1, the stronger the evidence for unequal population variances.

Note that, the F-test requires the two samples to be normally distributed.

Compute F-test in R

R function

The R function var.test() can be used to compare two variances as follow:

# Method 1
var.test(values ~ groups, data, 
         alternative = "two.sided")
# or Method 2
var.test(x, y, alternative = "two.sided")

  • x,y: numeric vectors
  • alternative: the alternative hypothesis. Allowed value is one of “two.sided” (default), “greater” or “less”.


Import and check your data into R

To import your data, use the following R code:

# If .txt tab file, use this
my_data <- read.delim(file.choose())
# Or, if .csv file, use this
my_data <- read.csv(file.choose())

Here, we’ll use the built-in R data set named ToothGrowth:

# Store the data in the variable my_data
my_data <- ToothGrowth

To have an idea of what the data look like, we start by displaying a random sample of 10 rows using the function sample_n()[in dplyr package]:

library("dplyr")
sample_n(my_data, 10)
    len supp dose
43 23.6   OJ  1.0
28 21.5   VC  2.0
25 26.4   VC  2.0
56 30.9   OJ  2.0
46 25.2   OJ  1.0
7  11.2   VC  0.5
16 17.3   VC  1.0
4   5.8   VC  0.5
48 21.2   OJ  1.0
37  8.2   OJ  0.5

We want to test the equality of variances between the two groups OJ and VC in the column “supp”.

Preleminary test to check F-test assumptions

F-test is very sensitive to departure from the normal assumption. You need to check whether the data is normally distributed before using the F-test.

Shapiro-Wilk test can be used to test whether the normal assumption holds. It’s also possible to use Q-Q plot (quantile-quantile plot) to graphically evaluate the normality of a variable. Q-Q plot draws the correlation between a given sample and the normal distribution.

If there is doubt about normality, the better choice is to use Levene’s test or Fligner-Killeen test, which are less sensitive to departure from normal assumption.

Compute F-test

# F-test
res.ftest <- var.test(len ~ supp, data = my_data)
res.ftest

    F test to compare two variances
data:  len by supp
F = 0.6386, num df = 29, denom df = 29, p-value = 0.2331
alternative hypothesis: true ratio of variances is not equal to 1
95 percent confidence interval:
 0.3039488 1.3416857
sample estimates:
ratio of variances 
         0.6385951 

Interpretation of the result

The p-value of F-test is p = 0.2331433 which is greater than the significance level 0.05. In conclusion, there is no significant difference between the two variances.

Access to the values returned by var.test() function

The function var.test() returns a list containing the following components:


  • statistic: the value of the F test statistic.
  • parameter: the degrees of the freedom of the F distribution of the test statistic.
  • p.value: the p-value of the test.
  • conf.int: a confidence interval for the ratio of the population variances.
  • estimate: the ratio of the sample variances


The format of the R code to use for getting these values is as follow:

# ratio of variances
res.ftest$estimate
ratio of variances 
         0.6385951 
# p-value of the test
res.ftest$p.value
[1] 0.2331433

Infos

This analysis has been performed using R software (ver. 3.3.2).

Saving High-Resolution ggplots: How to Preserve Semi-Transparency

$
0
0


This article describes solutions for preserving semi-transparency when saving a ggplot2-based graphs into a high quality postscript (.eps) file format.

Saving High-Reslution ggplots

Contents:

Create a ggplot with semi-transparent color

To illustrate this, we start by creating ggplot2-based survival curves using the function ggsurvplot() in the survminer package. The ggsurvplot() function creates survival curves with the 95% confidence bands in a semi-transparent color.

First install (if needed) survminer as follow:

install.packages("survminer")

Then type, this:

# Fit survival curves
require("survival")
fit<- survfit(Surv(time, status) ~ sex, data = lung)

# Visualize
library("survminer")
p <- ggsurvplot(fit, data = lung,
         surv.median.line = "hv", # Add medians survival
         pval = TRUE,             # Add p-value and tervals
        
         conf.int = TRUE,        # Add the 95% confidence band
         risk.table = TRUE,      # Add risk table
         tables.height = 0.2,
         tables.theme = theme_cleantable(),
         palette = "jco",
         ggtheme = theme_bw()
    )
print(p)

In the plot above, the confidence band is semi-transparent. It can be saved to a PDF file without loosing the semi-transparent color.

If you try to export the picture as vector file (EPS or SVG, …), the 95% confidence interval will disappear and the saved plot looks as follow:

ggsurvplot in .eps format: confidence bands disapear

The problem is that EPS in R does not support transparency.

In the following sections, we’ll describe convenient solutions to save high-quality ggplots by preserving semi-transparency.

Save ggplots with semi-transparent colors

Use cairo-based postscript graphics devices

You can use the ggsave() function in [ggplot2] as follow:

ggsave(filename = "survival-curves.eps",
       plot = print(p),
       device = cairo_eps)

Or use this:

cairo_ps(filename = "survival-curves.eps",
         width = 7, height = 7, pointsize = 12,
         fallback_resolution = 300)

print(p)

dev.off()

Note that, the argument fallback_resolution is used to control the resolution in dpi at which semi-transparent areas are rasterized (the rest stays as vector format).

Export to powerpoint

You can export the plot to Powerpoint using the ReporteRs package. ReporteRs will give you a fully editable vector format with full support for transparency as well.

We previously described how to Create and format PowerPoint documents from R software using the ReporteRs package. We also described how to export an editable ggplot from R software to powerpoint.

Briefly, to export our survival curves from R to powerpoint, the script looks like this

library('ReporteRs')

# Create a new powerpoint document
doc <- pptx()

# Add a new slide into the ppt document 
doc <- addSlide(doc, slide.layout = "Two Content"  )

# Add a slide title
doc <- addTitle(doc, "Survival Curves: Editable Vector Graphics" )

# Print the survival curves in the powerpoint
doc <- addPlot(doc, function() print(p, newpage = FALSE), 
               vector.graphic = TRUE  # Make it editable
               )

# write the document to a file
writeDoc(doc, file = "editable-survival-curves.pptx")

The output looks like this:

Editable survival curves

Edit the plot in powerpoint. See the video below: Editing ggplots Exported with ReporteRs into PWPT

Infos

Elegant correlation table using xtable R package

$
0
0


Correlation matrix analysis is an important method to find dependence between variables. Computing correlation matrix and drawing correlogram is explained here. The aim of this article is to show you how to get the lower and the upper triangular part of a correlation matrix. We will also use the xtable R package to display a nice correlation table in html or latex formats.


Elegant correlation table using xtable R package


Note that online software is also available here to compute correlation matrix and to plot a correlogram without any installation.

Contents:

Correlation matrix analysis

The following R code computes a correlation matrix using mtcars data. Click here to read more.

mcor<-round(cor(mtcars),2)
mcor
       mpg   cyl  disp    hp  drat    wt  qsec    vs    am  gear  carb
mpg   1.00 -0.85 -0.85 -0.78  0.68 -0.87  0.42  0.66  0.60  0.48 -0.55
cyl  -0.85  1.00  0.90  0.83 -0.70  0.78 -0.59 -0.81 -0.52 -0.49  0.53
disp -0.85  0.90  1.00  0.79 -0.71  0.89 -0.43 -0.71 -0.59 -0.56  0.39
hp   -0.78  0.83  0.79  1.00 -0.45  0.66 -0.71 -0.72 -0.24 -0.13  0.75
drat  0.68 -0.70 -0.71 -0.45  1.00 -0.71  0.09  0.44  0.71  0.70 -0.09
wt   -0.87  0.78  0.89  0.66 -0.71  1.00 -0.17 -0.55 -0.69 -0.58  0.43
qsec  0.42 -0.59 -0.43 -0.71  0.09 -0.17  1.00  0.74 -0.23 -0.21 -0.66
vs    0.66 -0.81 -0.71 -0.72  0.44 -0.55  0.74  1.00  0.17  0.21 -0.57
am    0.60 -0.52 -0.59 -0.24  0.71 -0.69 -0.23  0.17  1.00  0.79  0.06
gear  0.48 -0.49 -0.56 -0.13  0.70 -0.58 -0.21  0.21  0.79  1.00  0.27
carb -0.55  0.53  0.39  0.75 -0.09  0.43 -0.66 -0.57  0.06  0.27  1.00

The result is a table of correlation coefficients between all possible pairs of variables.

Lower and upper triangular part of a correlation matrix

To get the lower or the upper part of a correlation matrix, the R function lower.tri() or upper.tri() can be used. The formats of the functions are :

lower.tri(x, diag = FALSE)
upper.tri(x, diag = FALSE)

- x : is the correlation matrix - diag : if TRUE the diagonal are not included in the result.

The two functions above, return a matrix of logicals which has the same size of a the correlation matrix. The entries is TRUE in the lower or upper triangle :

upper.tri(mcor)
       [,1]  [,2]  [,3]  [,4]  [,5]  [,6]  [,7]  [,8]  [,9] [,10] [,11]
 [1,] FALSE  TRUE  TRUE  TRUE  TRUE  TRUE  TRUE  TRUE  TRUE  TRUE  TRUE
 [2,] FALSE FALSE  TRUE  TRUE  TRUE  TRUE  TRUE  TRUE  TRUE  TRUE  TRUE
 [3,] FALSE FALSE FALSE  TRUE  TRUE  TRUE  TRUE  TRUE  TRUE  TRUE  TRUE
 [4,] FALSE FALSE FALSE FALSE  TRUE  TRUE  TRUE  TRUE  TRUE  TRUE  TRUE
 [5,] FALSE FALSE FALSE FALSE FALSE  TRUE  TRUE  TRUE  TRUE  TRUE  TRUE
 [6,] FALSE FALSE FALSE FALSE FALSE FALSE  TRUE  TRUE  TRUE  TRUE  TRUE
 [7,] FALSE FALSE FALSE FALSE FALSE FALSE FALSE  TRUE  TRUE  TRUE  TRUE
 [8,] FALSE FALSE FALSE FALSE FALSE FALSE FALSE FALSE  TRUE  TRUE  TRUE
 [9,] FALSE FALSE FALSE FALSE FALSE FALSE FALSE FALSE FALSE  TRUE  TRUE
[10,] FALSE FALSE FALSE FALSE FALSE FALSE FALSE FALSE FALSE FALSE  TRUE
[11,] FALSE FALSE FALSE FALSE FALSE FALSE FALSE FALSE FALSE FALSE FALSE
# Hide upper triangle
upper<-mcor
upper[upper.tri(mcor)]<-""
upper<-as.data.frame(upper)
upper
       mpg   cyl  disp    hp  drat    wt  qsec    vs   am gear carb
mpg      1                                                         
cyl  -0.85     1                                                   
disp -0.85   0.9     1                                             
hp   -0.78  0.83  0.79     1                                       
drat  0.68  -0.7 -0.71 -0.45     1                                 
wt   -0.87  0.78  0.89  0.66 -0.71     1                           
qsec  0.42 -0.59 -0.43 -0.71  0.09 -0.17     1                     
vs    0.66 -0.81 -0.71 -0.72  0.44 -0.55  0.74     1               
am     0.6 -0.52 -0.59 -0.24  0.71 -0.69 -0.23  0.17    1          
gear  0.48 -0.49 -0.56 -0.13   0.7 -0.58 -0.21  0.21 0.79    1     
carb -0.55  0.53  0.39  0.75 -0.09  0.43 -0.66 -0.57 0.06 0.27    1
#Hide lower triangle
lower<-mcor
lower[lower.tri(mcor, diag=TRUE)]<-""
lower<-as.data.frame(lower)
lower
     mpg   cyl  disp    hp  drat    wt  qsec    vs    am  gear  carb
mpg      -0.85 -0.85 -0.78  0.68 -0.87  0.42  0.66   0.6  0.48 -0.55
cyl              0.9  0.83  -0.7  0.78 -0.59 -0.81 -0.52 -0.49  0.53
disp                  0.79 -0.71  0.89 -0.43 -0.71 -0.59 -0.56  0.39
hp                         -0.45  0.66 -0.71 -0.72 -0.24 -0.13  0.75
drat                             -0.71  0.09  0.44  0.71   0.7 -0.09
wt                                     -0.17 -0.55 -0.69 -0.58  0.43
qsec                                          0.74 -0.23 -0.21 -0.66
vs                                                  0.17  0.21 -0.57
am                                                        0.79  0.06
gear                                                            0.27
carb                                                                

Use xtable R package to display nice correlation table in html format

library(xtable)
print(xtable(upper), type="html")
mpg cyl disp hp drat wt qsec vs am gear carb
mpg 1
cyl -0.85 1
disp -0.85 0.9 1
hp -0.78 0.83 0.79 1
drat 0.68 -0.7 -0.71 -0.45 1
wt -0.87 0.78 0.89 0.66 -0.71 1
qsec 0.42 -0.59 -0.43 -0.71 0.09 -0.17 1
vs 0.66 -0.81 -0.71 -0.72 0.44 -0.55 0.74 1
am 0.6 -0.52 -0.59 -0.24 0.71 -0.69 -0.23 0.17 1
gear 0.48 -0.49 -0.56 -0.13 0.7 -0.58 -0.21 0.21 0.79 1
carb -0.55 0.53 0.39 0.75 -0.09 0.43 -0.66 -0.57 0.06 0.27 1

Combine matrix of correlation coefficients and significance levels

Custom function corstars() is used to combine the correlation coefficients and the level of significance. The R code of the function is provided at the end of this article. It requires 2 packages :

Before continuing with the following exercises, you should first copy and paste the source code the function corstars(), which you can find at the bottom of this article.

corstars(mtcars[,1:7], result="html")
mpg cyl disp hp drat wt
mpg
cyl -0.85****
disp -0.85**** 0.90****
hp -0.78**** 0.83**** 0.79****
drat 0.68**** -0.70**** -0.71**** -0.45**
wt -0.87**** 0.78**** 0.89**** 0.66**** -0.71****
qsec 0.42* -0.59*** -0.43* -0.71**** 0.09 -0.17

p < .0001 ‘****’; p < .001 ‘***’, p < .01 ‘**’, p < .05 ‘*’

The code of corstars function (The code is adapted from the one posted on this forum and on this blog ):

# x is a matrix containing the data
# method : correlation method. "pearson"" or "spearman"" is supported
# removeTriangle : remove upper or lower triangle
# results :  if "html" or "latex"
  # the results will be displayed in html or latex format
corstars <-function(x, method=c("pearson", "spearman"), removeTriangle=c("upper", "lower"),
                     result=c("none", "html", "latex")){
    #Compute correlation matrix
    require(Hmisc)
    x <- as.matrix(x)
    correlation_matrix<-rcorr(x, type=method[1])
    R <- correlation_matrix$r # Matrix of correlation coeficients
    p <- correlation_matrix$P # Matrix of p-value 
    
    ## Define notions for significance levels; spacing is important.
    mystars <- ifelse(p < .0001, "****", ifelse(p < .001, "*** ", ifelse(p < .01, "**  ", ifelse(p < .05, "*   ", "    "))))
    
    ## trunctuate the correlation matrix to two decimal
    R <- format(round(cbind(rep(-1.11, ncol(x)), R), 2))[,-1]
    
    ## build a new matrix that includes the correlations with their apropriate stars
    Rnew <- matrix(paste(R, mystars, sep=""), ncol=ncol(x))
    diag(Rnew) <- paste(diag(R), " ", sep="")
    rownames(Rnew) <- colnames(x)
    colnames(Rnew) <- paste(colnames(x), "", sep="")
    
    ## remove upper triangle of correlation matrix
    if(removeTriangle[1]=="upper"){
      Rnew <- as.matrix(Rnew)
      Rnew[upper.tri(Rnew, diag = TRUE)] <- ""
      Rnew <- as.data.frame(Rnew)
    }
    
    ## remove lower triangle of correlation matrix
    else if(removeTriangle[1]=="lower"){
      Rnew <- as.matrix(Rnew)
      Rnew[lower.tri(Rnew, diag = TRUE)] <- ""
      Rnew <- as.data.frame(Rnew)
    }
    
    ## remove last column and return the correlation matrix
    Rnew <- cbind(Rnew[1:length(Rnew)-1])
    if (result[1]=="none") return(Rnew)
    else{
      if(result[1]=="html") print(xtable(Rnew), type="html")
      else print(xtable(Rnew), type="latex") 
    }
} 

Conclusions

  • Use cor() function to compute correlation matrix.
  • Use lower.tri() and upper.tri() functions to get the lower or upper part of the correlation matrix
  • Use xtable R function to display a nice correlation matrix in latex or html format.

Infos

This analysis was performed using R (ver. 3.3.2).

simplyR

$
0
0

simplyR is a web space where we’ll be posting practical and easy guides for solving real important problems using R programming language.

As we aren’t fans of unnecessary complications, we’ll keep the content of our tutorials / R codes as simple as possible.

Many tutorials are coming soon.

Topics we love include:

  • R programming
  • Biostatistics
  • Genomic data analysis
  • Survival analysis
  • Machine/statistical learning
  • Data visualization

Samples of our recent publications, on R & Data Science, are:

If you want to contribute, read this: http://www.sthda.com/english/pages/contribute-to-sthda


Practical Guide to Principal Component Methods in R

$
0
0

Introduction

Although there are several good books on principal component methods (PCMs) and related topics, we felt that many of them are either too theoretical or too advanced.

This book provides a solid practical guidance to summarize, visualize and interpret the most important information in a large multivariate data sets, using principal component methods in R.

Where to find the book:


The following figure illustrates the type of analysis to be performed depending on the type of variables contained in the data set.

Principal component methods

There are a number of R packages implementing principal component methods. These packages include: FactoMineR, ade4, stats, ca, MASS and ExPosition.

However, the result is presented differently depending on the used package.

To help in the interpretation and in the visualization of multivariate analysis - such as cluster analysis and principal component methods - we developed an easy-to-use R package named factoextra (official online documentation: http://www.sthda.com/english/rpkgs/factoextra).

No matter which package you decide to use for computing principal component methods, the factoextra R package can help to extract easily, in a human readable data format, the analysis results from the different packages mentioned above. factoextra provides also convenient solutions to create ggplot2-based beautiful graphs.

Methods, which outputs can be visualized using the factoextra package are shown in the figure below:

Principal component methods and clustering methods supported by the factoextra R package

In this book, we’ll use mainly:

  • the FactoMineR package to compute principal component methods;
  • and the factoextra package for extracting, visualizing and interpreting the results.

The other packages - ade4, ExPosition, etc - will be also presented briefly.

How this book is organized

This book contains 4 parts.

Principal Component Methods book structure

Part I provides a quick introduction to R and presents the key features of FactoMineR and factoextra.

Key features of FactoMineR and factoextra for multivariate analysis

Part II describes classical principal component methods to analyze data sets containing, predominantly, either continuous or categorical variables. These methods include:

  • Principal Component Analysis (PCA, for continuous variables),
  • Simple correspondence analysis (CA, for large contingency tables formed by two categorical variables)
  • Multiple correspondence analysis (MCA, for a data set with more than 2 categorical variables).

In Part III, you’ll learn advanced methods for analyzing a data set containing a mix of variables (continuous and categorical) structured or not into groups:

  • Factor Analysis of Mixed Data (FAMD) and,
  • Multiple Factor Analysis (MFA).

Part IV covers hierarchical clustering on principal components (HCPC), which is useful for performing clustering with a data set containing only categorical variables or with a mixed data of categorical and continuous variables

Key features of this book

This book presents the basic principles of the different methods and provide many examples in R. This book offers solid guidance in data mining for students and researchers.

Key features:

  • Covers principal component methods and implementation in R
  • Highlights the most important information in your data set using ggplot2-based elegant visualization
  • Short, self-contained chapters with tested examples that allow for flexibility in designing a course and for easy reference

At the end of each chapter, we present R lab sections in which we systematically work through applications of the various methods discussed in that chapter. Additionally, we provide links to other resources and to our hand-curated list of videos on principal component methods for further learning.

Examples of plots

Some examples of plots generated in this book are shown hereafter. You’ll learn how to create, customize and interpret these plots.

  1. Eigenvalues/variances of principal components. Proportion of information retained by each principal component.

  1. PCA - Graph of variables:
  • Control variable colors using their contributions to the principal components.

  • Highlight the most contributing variables to each principal dimension:

  1. PCA - Graph of individuals:
  • Control automatically the color of individuals using the cos2 (the quality of the individuals on the factor map)

  • Change the point size according to the cos2 of the corresponding individuals:

  1. PCA - Biplot of individuals and variables

  1. Correspondence analysis. Association between categorical variables.

  1. FAMD/MFA - Analyzing mixed and structured data

  1. Clustering on principal components

Book preview

Download the preview of the book at: Principal Component Methods in R (Book preview)

Order now


About the author

Alboukadel Kassambara is a PhD in Bioinformatics and Cancer Biology. He works since many years on genomic data analysis and visualization (read more: http://www.alboukadel.com/).

He has work experiences in statistical and computational methods to identify prognostic and predictive biomarker signatures through integrative analysis of large-scale genomic and clinical data sets.

He created a bioinformatics web-tool named GenomicScape (www.genomicscape.com) which is an easy-to-use web tool for gene expression data analysis and visualization.

He developed also a training website on data science, named STHDA (Statistical Tools for High-throughput Data Analysis, www.sthda.com/english), which contains many tutorials on data analysis and visualization using R software and packages.

He is the author of many popular R packages for:

Recently, he published three books on data analysis and visualization:

  1. Practical Guide to Cluster Analysis in R (https://goo.gl/DmJ5y5)
  2. Guide to Create Beautiful Graphics in R (https://goo.gl/vJ0OYb).
  3. Complete Guide to 3D Plots in R (https://goo.gl/v5gwl0).

The Ultimate Guide To Partitioning Clustering

$
0
0

In this first volume of symplyR, we are excited to share our Practical Guides to Partioning Clustering.

Partitioning clustering methods

The course materials contain 3 chapters organized as follow:

K-Means Clustering Essentials

Contents:

  • K-means basic ideas
  • K-means algorithm
  • Computing k-means clustering in R
    • Data
    • Required R packages and functions: stats::kmeans()
    • Estimating the optimal number of clusters: factoextra::fviz_nbclust()
    • Computing k-means clustering
    • Accessing to the results of kmeans() function
    • Visualizing k-means clusters: factoextra::fviz_cluster()
  • K-means clustering advantages and disadvantages
  • Alternative to k-means clustering

K-Medoids Essentials: PAM clustering

Contents:

  • PAM concept
  • PAM algorithm
  • Computing PAM in R
    • Data
    • Required R packages and functions: cluster::pam() or fpc::pamk()
    • Estimating the optimal number of clusters: factoextra::fviz_nbclust()
    • Computing PAM clustering
    • Accessing to the results of the pam() function
    • Visualizing PAM clusters: factoextra::fviz_cluster()

CLARA - Clustering Large Applications

Contents:

  • CLARA concept
  • CLARA Algorithm
  • Computing CLARA in R
    • Data format and preparation
    • Required R packages and functions: cluster::clara()
    • Estimating the optimal number of clusters: factoextra::fviz_nbclust()
    • Computing CLARA
    • Visualizing CLARA clusters: factoextra::fviz_cluster()

Example of plots:

K means clustering plots


Licence: Licence Creative Commons

ggpubr: Create Easily Publication Ready Plots

$
0
0

The ggpubr R package facilitates the creation of beautiful ggplot2-based graphs for researcher with non-advanced programming backgrounds.

The current material presents a collection of articles for simply creating and customizing publication-ready plots using ggpubr. To see some examples of plots created with ggpubr click the following link: ggpubr examples.

ggpubr Key features:

  • Wrapper around the ggplot2 package with a less opaque syntax for beginners in R programming.
  • Helps researchers, with non-advanced R programming skills, to create easily publication-ready plots.
  • Makes it possible to automatically add p-values and significance levels to box plots, bar plots, line plots, and more.
  • Makes it easy to arrange and annotate multiple plots on the same page.
  • Makes it easy to change grahical parameters such as colors and labels.

Official online documentation: http://www.sthda.com/english/rpkgs/ggpubr.

ggpubr: publication ready plots

Install and load ggpubr

  • Install from CRAN as follow:
install.packages("ggpubr")
  • Or, install the latest version from GitHub as follow:
# Install
if(!require(devtools)) install.packages("devtools")
devtools::install_github("kassambara/ggpubr")
  • Load ggpubr:
library("ggpubr")

Regression Analysis Essentials For Machine Learning

$
0
0

Regression analysis consists of a set of machine learning methods that allow us to predict a continuous outcome variable (y) based on the value of one or multiple predictor variables (x).

Briefly, the goal of regression model is to build a mathematical equation that defines y as a function of the x variables. Next, this equation can be used to predict the outcome (y) on the basis of new values of the predictor variables (x).

Linear regression is the most simple and popular technique for predicting a continuous variable. It assumes a linear relationship between the outcome and the predictor variables.

The linear regression equation can be written as y = b0 + b*x + e, where:

  • b0 is the intercept,
  • b is the regression weight or coefficient associated with the predictor variable x.
  • e is the residual error

Technically, the linear regression coefficients are detetermined so that the error in predicting the outcome value is minimized. This method of computing the beta coefficients is called the Ordinary Least Squares method.

When you have multiple predictor variables, say x1 and x2, the regression equation can be written as y = b0 + b1*x1 + b2*x2 +e. In some situations, there might be an interaction effect between some predictors, that is for example, increasing the value of a predictor variable x1 may increase the effectiveness of the predictor x2 in explaining the variation in the outcome variable.

Note also that, linear regression models can incorporate both continuous and categorical predictor variables.

When you build the linear regression model, you need to diagnostic whether linear model is suitable for your data.

In some cases, the relationship between the outcome and the predictor variables is not linear. In these situations, you need to build a non-linear regression, such as polynomial and spline regression.

When you have multiple predictors in the regression model, you might want to select the best combination of predictor variables to build an optimal predictive model. This process called model selection, consists of comparing multiple models containing different sets of predictors in order to select the best performing model that minimize the prediction error. Linear model selection approaches include best subsets regression and stepwise regression

In some situations, such as in genomic fields, you might have a large multivariate data set containing some correlated predictors. In this case, the information, in the original data set, can be summarized into few new variables (called principal components) that are a linear combination of the original variables. This few principal components can be used to build a linear model, which might be more performant for your data. This approach is know as principal component-based methods, which include: principal component regression and partial least squares regression.

An alternative method to simplify a large multivariate model is to use penalized regression, which penalizes the model for having too many variables. The most well known penalized regression include ridge regression and the lasso regression.

You can apply all these different regression models on your data, compare the models and finally select the best approach that explains well your data. To do so, you need some statistical metrics to compare the performance of the different models in explaining your data and in predicting the outcome of new test data.

The best model is defined as the model that has the lowest prediction error. The most popular metrics for comparing regression models, include:

  • Root Mean Squared Error, which measures the model prediction error. It corresponds to the average difference between the observed known values of the outcome and the predicted value by the model. RMSE is computed as RMSE = mean((observeds - predicteds)^2) %>% sqrt(). The lower the RMSE, the better the model.
  • Adjusted R-square, representing the proportion of variation (i.e., information), in your data, explained by the model. This corresponds to the overall quality of the model. The higher the adjusted R2, the better the model

Note that, the above mentioned metrics should be computed on a new test data that has not been used to train (i.e. build) the model. If you have a large data set, with many records, you can randomly split the data into training set (80% for building the predictive model) and test set or validation set (20% for evaluating the model performance).

One of the most robust and popular approach for estimating a model performance is k-fold cross-validation. It can be applied even on a small data set. k-fold cross-validation works as follow:

  1. Randomly split the data set into k-subsets (or k-fold) (for example 5 subsets)
  2. Reserve one subset and train the model on all other subsets
  3. Test the model on the reserved subset and record the prediction error
  4. Repeat this process until each of the k subsets has served as the test set.
  5. Compute the average of the k recorded errors. This is called the cross-validation error serving as the performance metric for the model.

Taken together, the best model is the model that has the lowest cross-validation error, RMSE.

In this Part, you will learn different methods for regression analysis and we’ll provide practical example in R.

The content is organized as follow:

  1. Regression Analysis
  2. Regression Model Diagnostics
  3. Regression Model Validation
  4. Model Selection Essentials in R

ggplot2 barplots : Quick start guide - R software and data visualization

$
0
0


This R tutorial describes how to create a barplot using R software and ggplot2 package.

The function geom_bar() can be used.

ggplot2 barplot - R software and data visualization


Basic barplots

Data

Data derived from ToothGrowth data sets are used. ToothGrowth describes the effect of Vitamin C on Tooth growth in Guinea pigs.

df <- data.frame(dose=c("D0.5", "D1", "D2"),
                len=c(4.2, 10, 29.5))
head(df)
##   dose  len
## 1 D0.5  4.2
## 2   D1 10.0
## 3   D2 29.5
  • len : Tooth length
  • dose : Dose in milligrams (0.5, 1, 2)

Create barplots

library(ggplot2)
# Basic barplot
p<-ggplot(data=df, aes(x=dose, y=len)) +
  geom_bar(stat="identity")
p
   
# Horizontal bar plot
p + coord_flip()

ggplot2 barplot - R software and data visualizationggplot2 barplot - R software and data visualization

Change the width and the color of bars :

# Change the width of bars
ggplot(data=df, aes(x=dose, y=len)) +
  geom_bar(stat="identity", width=0.5)
# Change colors
ggplot(data=df, aes(x=dose, y=len)) +
  geom_bar(stat="identity", color="blue", fill="white")
# Minimal theme + blue fill color
p<-ggplot(data=df, aes(x=dose, y=len)) +
  geom_bar(stat="identity", fill="steelblue")+
  theme_minimal()
p

ggplot2 barplot - R software and data visualizationggplot2 barplot - R software and data visualizationggplot2 barplot - R software and data visualization

Choose which items to display :

p + scale_x_discrete(limits=c("D0.5", "D2"))

ggplot2 barplot - R software and data visualization

Bar plot with labels

# Outside bars
ggplot(data=df, aes(x=dose, y=len)) +
  geom_bar(stat="identity", fill="steelblue")+
  geom_text(aes(label=len), vjust=-0.3, size=3.5)+
  theme_minimal()
# Inside bars
ggplot(data=df, aes(x=dose, y=len)) +
  geom_bar(stat="identity", fill="steelblue")+
  geom_text(aes(label=len), vjust=1.6, color="white", size=3.5)+
  theme_minimal()

ggplot2 barplot - R software and data visualizationggplot2 barplot - R software and data visualization

Barplot of counts

In the R code above, we used the argument stat = “identity” to make barplots. Note that, the default value of the argument stat is “bin”. In this case, the height of the bar represents the count of cases in each category.

To make a barplot of counts, we will use the mtcars data sets :

head(mtcars)
##                    mpg cyl disp  hp drat    wt  qsec vs am gear carb
## Mazda RX4         21.0   6  160 110 3.90 2.620 16.46  0  1    4    4
## Mazda RX4 Wag     21.0   6  160 110 3.90 2.875 17.02  0  1    4    4
## Datsun 710        22.8   4  108  93 3.85 2.320 18.61  1  1    4    1
## Hornet 4 Drive    21.4   6  258 110 3.08 3.215 19.44  1  0    3    1
## Hornet Sportabout 18.7   8  360 175 3.15 3.440 17.02  0  0    3    2
## Valiant           18.1   6  225 105 2.76 3.460 20.22  1  0    3    1
# Don't map a variable to y
ggplot(mtcars, aes(x=factor(cyl)))+
  geom_bar(stat="bin", width=0.7, fill="steelblue")+
  theme_minimal()

ggplot2 barplot - R software and data visualization

Change barplot colors by groups

Change outline colors

Barplot outline colors can be automatically controlled by the levels of the variable dose :

# Change barplot line colors by groups
p<-ggplot(df, aes(x=dose, y=len, color=dose)) +
  geom_bar(stat="identity", fill="white")
p

ggplot2 barplot - R software and data visualization

It is also possible to change manually barplot line colors using the functions :

  • scale_color_manual() : to use custom colors
  • scale_color_brewer() : to use color palettes from RColorBrewer package
  • scale_color_grey() : to use grey color palettes
# Use custom color palettes
p+scale_color_manual(values=c("#999999", "#E69F00", "#56B4E9"))
# Use brewer color palettes
p+scale_color_brewer(palette="Dark2")
# Use grey scale
p + scale_color_grey() + theme_classic()

ggplot2 barplot - R software and data visualizationggplot2 barplot - R software and data visualizationggplot2 barplot - R software and data visualization

Read more on ggplot2 colors here : ggplot2 colors

Change fill colors

In the R code below, barplot fill colors are automatically controlled by the levels of dose :

# Change barplot fill colors by groups
p<-ggplot(df, aes(x=dose, y=len, fill=dose)) +
  geom_bar(stat="identity")+theme_minimal()
p

ggplot2 barplot - R software and data visualization

It is also possible to change manually barplot fill colors using the functions :

  • scale_fill_manual() : to use custom colors
  • scale_fill_brewer() : to use color palettes from RColorBrewer package
  • scale_fill_grey() : to use grey color palettes
# Use custom color palettes
p+scale_fill_manual(values=c("#999999", "#E69F00", "#56B4E9"))
# use brewer color palettes
p+scale_fill_brewer(palette="Dark2")
# Use grey scale
p + scale_fill_grey()

ggplot2 barplot - R software and data visualizationggplot2 barplot - R software and data visualizationggplot2 barplot - R software and data visualization

Use black outline color :

ggplot(df, aes(x=dose, y=len, fill=dose))+
geom_bar(stat="identity", color="black")+
scale_fill_manual(values=c("#999999", "#E69F00", "#56B4E9"))+
  theme_minimal()

ggplot2 barplot - R software and data visualization

Read more on ggplot2 colors here : ggplot2 colors

Change the legend position

# Change bar fill colors to blues
p <- p+scale_fill_brewer(palette="Blues")
p + theme(legend.position="top")
p + theme(legend.position="bottom")
# Remove legend
p + theme(legend.position="none")

ggplot2 barplot - R software and data visualizationggplot2 barplot - R software and data visualizationggplot2 barplot - R software and data visualization

The allowed values for the arguments legend.position are : “left”,“top”, “right”, “bottom”.

Read more on ggplot legend : ggplot2 legend

Change the order of items in the legend

The function scale_x_discrete can be used to change the order of items to “2”, “0.5”, “1” :

p + scale_x_discrete(limits=c("D2", "D0.5", "D1"))

ggplot2 barplot - R software and data visualization

Barplot with multiple groups

Data

Data derived from ToothGrowth data sets are used. ToothGrowth describes the effect of Vitamin C on tooth growth in Guinea pigs. Three dose levels of Vitamin C (0.5, 1, and 2 mg) with each of two delivery methods [orange juice (OJ) or ascorbic acid (VC)] are used :

df2 <- data.frame(supp=rep(c("VC", "OJ"), each=3),
                dose=rep(c("D0.5", "D1", "D2"),2),
                len=c(6.8, 15, 33, 4.2, 10, 29.5))
head(df2)
##   supp dose  len
## 1   VC D0.5  6.8
## 2   VC   D1 15.0
## 3   VC   D2 33.0
## 4   OJ D0.5  4.2
## 5   OJ   D1 10.0
## 6   OJ   D2 29.5
  • len : Tooth length
  • dose : Dose in milligrams (0.5, 1, 2)
  • supp : Supplement type (VC or OJ)

Create barplots

A stacked barplot is created by default. You can use the function position_dodge() to change this. The barplot fill color is controlled by the levels of dose :

# Stacked barplot with multiple groups
ggplot(data=df2, aes(x=dose, y=len, fill=supp)) +
  geom_bar(stat="identity")
# Use position=position_dodge()
ggplot(data=df2, aes(x=dose, y=len, fill=supp)) +
geom_bar(stat="identity", position=position_dodge())

ggplot2 barplot - R software and data visualizationggplot2 barplot - R software and data visualization

Change the color manually :

# Change the colors manually
p <- ggplot(data=df2, aes(x=dose, y=len, fill=supp)) +
geom_bar(stat="identity", color="black", position=position_dodge())+
  theme_minimal()
# Use custom colors
p + scale_fill_manual(values=c('#999999','#E69F00'))
# Use brewer color palettes
p + scale_fill_brewer(palette="Blues")

ggplot2 barplot - R software and data visualizationggplot2 barplot - R software and data visualization

Add labels

Add labels to a dodged barplot :

ggplot(data=df2, aes(x=dose, y=len, fill=supp)) +
  geom_bar(stat="identity", position=position_dodge())+
  geom_text(aes(label=len), vjust=1.6, color="white",
            position = position_dodge(0.9), size=3.5)+
  scale_fill_brewer(palette="Paired")+
  theme_minimal()

ggplot2 barplot - R software and data visualization

Add labels to a stacked barplot : 3 steps are required

  1. Sort the data by dose and supp : the package plyr is used
  2. Calculate the cumulative sum of the variable len for each dose
  3. Create the plot
library(plyr)
# Sort by dose and supp
df_sorted <- arrange(df2, dose, supp) 
head(df_sorted)
##   supp dose  len
## 1   OJ D0.5  4.2
## 2   VC D0.5  6.8
## 3   OJ   D1 10.0
## 4   VC   D1 15.0
## 5   OJ   D2 29.5
## 6   VC   D2 33.0
# Calculate the cumulative sum of len for each dose
df_cumsum <- ddply(df_sorted, "dose",
                   transform, label_ypos=cumsum(len))
head(df_cumsum)
##   supp dose  len label_ypos
## 1   OJ D0.5  4.2        4.2
## 2   VC D0.5  6.8       11.0
## 3   OJ   D1 10.0       10.0
## 4   VC   D1 15.0       25.0
## 5   OJ   D2 29.5       29.5
## 6   VC   D2 33.0       62.5
# Create the barplot
ggplot(data=df_cumsum, aes(x=dose, y=len, fill=supp)) +
  geom_bar(stat="identity")+
  geom_text(aes(y=label_ypos, label=len), vjust=1.6, 
            color="white", size=3.5)+
  scale_fill_brewer(palette="Paired")+
  theme_minimal()

ggplot2 barplot - R software and data visualization

If you want to place the labels at the middle of bars, you have to modify the cumulative sum as follow :

df_cumsum <- ddply(df_sorted, "dose",
                   transform, 
                   label_ypos=cumsum(len) - 0.5*len)
# Create the barplot
ggplot(data=df_cumsum, aes(x=dose, y=len, fill=supp)) +
  geom_bar(stat="identity")+
  geom_text(aes(y=label_ypos, label=len), vjust=1.6, 
            color="white", size=3.5)+
  scale_fill_brewer(palette="Paired")+
  theme_minimal()

ggplot2 barplot - R software and data visualization

Barplot with a numeric x-axis

If the variable on x-axis is numeric, it can be useful to treat it as a continuous or a factor variable depending on what you want to do :

# Create some data
df2 <- data.frame(supp=rep(c("VC", "OJ"), each=3),
                dose=rep(c("0.5", "1", "2"),2),
                len=c(6.8, 15, 33, 4.2, 10, 29.5))
head(df2)
##   supp dose  len
## 1   VC  0.5  6.8
## 2   VC    1 15.0
## 3   VC    2 33.0
## 4   OJ  0.5  4.2
## 5   OJ    1 10.0
## 6   OJ    2 29.5
# x axis treated as continuous variable
df2$dose <- as.numeric(as.vector(df2$dose))
ggplot(data=df2, aes(x=dose, y=len, fill=supp)) +
  geom_bar(stat="identity", position=position_dodge())+
  scale_fill_brewer(palette="Paired")+
  theme_minimal()
# Axis treated as discrete variable
df2$dose<-as.factor(df2$dose)
ggplot(data=df2, aes(x=dose, y=len, fill=supp)) +
  geom_bar(stat="identity", position=position_dodge())+
  scale_fill_brewer(palette="Paired")+
  theme_minimal()

ggplot2 barplot - R software and data visualizationggplot2 barplot - R software and data visualization

Barplot with error bars

The helper function below will be used to calculate the mean and the standard deviation, for the variable of interest, in each group :

#+++++++++++++++++++++++++
# Function to calculate the mean and the standard deviation
  # for each group
#+++++++++++++++++++++++++
# data : a data frame
# varname : the name of a column containing the variable
  #to be summariezed
# groupnames : vector of column names to be used as
  # grouping variables
data_summary <- function(data, varname, groupnames){
  require(plyr)
  summary_func <- function(x, col){
    c(mean = mean(x[[col]], na.rm=TRUE),
      sd = sd(x[[col]], na.rm=TRUE))
  }
  data_sum<-ddply(data, groupnames, .fun=summary_func,
                  varname)
  data_sum <- rename(data_sum, c("mean" = varname))
 return(data_sum)
}

Summarize the data :

df3 <- data_summary(ToothGrowth, varname="len", 
                    groupnames=c("supp", "dose"))
# Convert dose to a factor variable
df3$dose=as.factor(df3$dose)
head(df3)
##   supp dose   len       sd
## 1   OJ  0.5 13.23 4.459709
## 2   OJ    1 22.70 3.910953
## 3   OJ    2 26.06 2.655058
## 4   VC  0.5  7.98 2.746634
## 5   VC    1 16.77 2.515309
## 6   VC    2 26.14 4.797731

The function geom_errorbar() can be used to produce a bar graph with error bars :

# Standard deviation of the mean as error bar
p <- ggplot(df3, aes(x=dose, y=len, fill=supp)) + 
   geom_bar(stat="identity", position=position_dodge()) +
  geom_errorbar(aes(ymin=len-sd, ymax=len+sd), width=.2,
                 position=position_dodge(.9))
  
p + scale_fill_brewer(palette="Paired") + theme_minimal()

ggplot2 barplot - R software and data visualization

Customized barplots

# Change color by groups
# Add error bars
p + labs(title="Plot of length  per dose", 
         x="Dose (mg)", y = "Length")+
   scale_fill_manual(values=c('black','lightgray'))+
   theme_classic()

ggplot2 barplot - R software and data visualization

Change fill colors manually :

# Greens
p + scale_fill_brewer(palette="Greens") + theme_minimal()
# Reds
p + scale_fill_brewer(palette="Reds") + theme_minimal()

ggplot2 barplot - R software and data visualizationggplot2 barplot - R software and data visualization

Infos

This analysis has been performed using R software (ver. 3.1.2) and ggplot2 (ver. 1.0.0)

ggplot2 title : main, axis and legend titles

$
0
0


The aim of this tutorial is to describe how to modify plot titles (main title, axis labels and legend titles) using R software and ggplot2 package.

The functions below can be used :

ggtitle(label) # for the main title
xlab(label) # for the x axis label
ylab(label) # for the y axis label
labs(...) # for the main title, axis labels and legend titles

The argument label is the text to be used for the main title or for the axis labels.


Prepare the data

ToothGrowth data is used in the following examples.

# convert dose column from a numeric to a factor variable
ToothGrowth$dose <- as.factor(ToothGrowth$dose)
head(ToothGrowth)
##    len supp dose
## 1  4.2   VC  0.5
## 2 11.5   VC  0.5
## 3  7.3   VC  0.5
## 4  5.8   VC  0.5
## 5  6.4   VC  0.5
## 6 10.0   VC  0.5

Make sure that the variable dose is converted as a factor using the above R script.

Example of plot

library(ggplot2)
p <- ggplot(ToothGrowth, aes(x=dose, y=len)) + geom_boxplot()
p

ggplot2 title, axis labels, legend titles, R programming

Change the main title and axis labels

Change plot titles by using the functions ggtitle(), xlab() and ylab() :

p + ggtitle("Plot of length \n by dose") +
  xlab("Dose (mg)") + ylab("Teeth length")

ggplot2 title, axis labels, legend titles, R programming

Note that, you can use \n to split long title into multiple lines.

Change plot titles using the function labs() as follow :

p +labs(title="Plot of length \n by dose",
        x ="Dose (mg)", y = "Teeth length")

ggplot2 title, axis labels, legend titles, R programming

It is also possible to change legend titles using the function labs():

# Default plot
p <- ggplot(ToothGrowth, aes(x=dose, y=len, fill=dose))+
  geom_boxplot()
p
# Modify legend titles
p + labs(fill = "Dose (mg)")

ggplot2 title, axis labels, legend titles, R programmingggplot2 title, axis labels, legend titles, R programming

Change the appearance of the main title and axis labels

Main title and, x and y axis labels can be customized using the functions theme() and element_text() as follow :

# main title
p + theme(plot.title = element_text(family, face, colour, size))
# x axis title 
p + theme(axis.title.x = element_text(family, face, colour, size))
# y axis title
p + theme(axis.title.y = element_text(family, face, colour, size))

The arguments below can be used for the function element_text() to change the appearance of the text :


  • family : font family
  • face : font face. Possible values are “plain”, “italic”, “bold” and “bold.italic”
  • colour : text color
  • size : text size in pts
  • hjust : horizontal justification (in [0, 1])
  • vjust : vertical justification (in [0, 1])
  • lineheight : line height. In multi-line text, the lineheight argument is used to change the spacing between lines.
  • color : an alias for colour


# Default plot
p <- ggplot(ToothGrowth, aes(x=dose, y=len)) + geom_boxplot() +
  ggtitle("Plot of length \n by dose") +
  xlab("Dose (mg)") + ylab("Teeth length")
p
# Change the color, the size and the face of
# the main title, x and y axis labels
p + theme(
plot.title = element_text(color="red", size=14, face="bold.italic"),
axis.title.x = element_text(color="blue", size=14, face="bold"),
axis.title.y = element_text(color="#993333", size=14, face="bold")
)

ggplot2 title, axis labels, legend titles, R programmingggplot2 title, axis labels, legend titles, R programming

Remove x and y axis labels

It’s possible to hide the main title and axis labels using the function element_blank() as follow :

# Hide the main title and axis titles
p + theme(
  plot.title = element_blank(),
  axis.title.x = element_blank(),
  axis.title.y = element_blank())

ggplot2 title, axis labels, legend titles, R programming

Infos

This analysis has been performed using R software (ver. 3.1.2) and ggplot2 (ver. )

ggplot2 colors : How to change colors automatically and manually?

$
0
0


The goal of this article is to describe how to change the color of a graph generated using R software and ggplot2 package. A color can be specified either by name (e.g.: “red”) or by hexadecimal code (e.g. : “#FF1234”). The different color systems available in R are described at this link : colors in R.

In this R tutorial, you will learn how to :

  • change colors by groups (automatically and manually)
  • use RColorBrewer and Wes Anderson color palettes
  • use gradient colors

ggplot2 color, graph, R software


Prepare the data

ToothGrowth and mtcars data sets are used in the examples below.

# Convert dose and cyl columns from numeric to factor variables
ToothGrowth$dose <- as.factor(ToothGrowth$dose)
mtcars$cyl <- as.factor(mtcars$cyl)
head(ToothGrowth)
##    len supp dose
## 1  4.2   VC  0.5
## 2 11.5   VC  0.5
## 3  7.3   VC  0.5
## 4  5.8   VC  0.5
## 5  6.4   VC  0.5
## 6 10.0   VC  0.5
head(mtcars)
##                    mpg cyl disp  hp drat    wt  qsec vs am gear carb
## Mazda RX4         21.0   6  160 110 3.90 2.620 16.46  0  1    4    4
## Mazda RX4 Wag     21.0   6  160 110 3.90 2.875 17.02  0  1    4    4
## Datsun 710        22.8   4  108  93 3.85 2.320 18.61  1  1    4    1
## Hornet 4 Drive    21.4   6  258 110 3.08 3.215 19.44  1  0    3    1
## Hornet Sportabout 18.7   8  360 175 3.15 3.440 17.02  0  0    3    2
## Valiant           18.1   6  225 105 2.76 3.460 20.22  1  0    3    1

Make sure that the columns dose and cyl are converted as factor variables using the R script above.

Simple plots

library(ggplot2)
# Box plot
ggplot(ToothGrowth, aes(x=dose, y=len)) +geom_boxplot()
# scatter plot
ggplot(mtcars, aes(x=wt, y=mpg)) + geom_point()

ggplot2 color, graph, R softwareggplot2 color, graph, R software

Use a single color

# box plot
ggplot(ToothGrowth, aes(x=dose, y=len)) +
  geom_boxplot(fill='#A4A4A4', color="darkred")
# scatter plot
ggplot(mtcars, aes(x=wt, y=mpg)) + 
  geom_point(color='darkblue')

ggplot2 color, graph, R softwareggplot2 color, graph, R software

Change colors by groups

Default colors

The following R code changes the color of the graph by the levels of dose :

# Box plot
bp<-ggplot(ToothGrowth, aes(x=dose, y=len, fill=dose)) +
  geom_boxplot()
bp
# Scatter plot
sp<-ggplot(mtcars, aes(x=wt, y=mpg, color=cyl)) + geom_point()
sp

ggplot2 color, graph, R softwareggplot2 color, graph, R software

The lightness (l) and the chroma (c, intensity of color) of the default (hue) colors can be modified using the functions scale_hue as follow :

# Box plot
bp + scale_fill_hue(l=40, c=35)
# Scatter plot
sp + scale_color_hue(l=40, c=35)

ggplot2 color, graph, R softwareggplot2 color, graph, R software

Note that, the default values for l and c are : l = 65, c = 100.

Change colors manually

A custom color palettes can be specified using the functions :

  • scale_fill_manual() for box plot, bar plot, violin plot, etc
  • scale_color_manual() for lines and points
# Box plot
bp + scale_fill_manual(values=c("#999999", "#E69F00", "#56B4E9"))
# Scatter plot
sp + scale_color_manual(values=c("#999999", "#E69F00", "#56B4E9"))

ggplot2 color, graph, R softwareggplot2 color, graph, R software

Note that, the argument breaks can be used to control the appearance of the legend. This holds true also for the other scale_xx() functions.

# Box plot
bp + scale_fill_manual(breaks = c("2", "1", "0.5"), 
                       values=c("red", "blue", "green"))
# Scatter plot
sp + scale_color_manual(breaks = c("8", "6", "4"),
                        values=c("red", "blue", "green"))

ggplot2 color, graph, R softwareggplot2 color, graph, R software

The built-in color names and a color code chart are described here : color in R.

Use RColorBrewer palettes

The color palettes available in the RColorBrewer package are described here : color in R.

# Box plot
bp + scale_fill_brewer(palette="Dark2")
# Scatter plot
sp + scale_color_brewer(palette="Dark2")

ggplot2 color, graph, R softwareggplot2 color, graph, R software

The available color palettes in the RColorBrewer package are :

RColorBrewer palettes

Use Wes Anderson color palettes

Install and load the color palettes as follow :

# Install
install.packages("wesanderson")
# Load
library(wesanderson)

The available color palettes are :

wesanderson-color palettes

library(wesanderson)
# Box plot
bp+scale_fill_manual(values=wes_palette(n=3, name="GrandBudapest"))
# Scatter plot
sp+scale_color_manual(values=wes_palette(n=3, name="GrandBudapest"))

ggplot2 color, graph, R softwareggplot2 color, graph, R software

Use gray colors

The functions to use are :

  • scale_colour_grey() for points, lines, etc
  • scale_fill_grey() for box plot, bar plot, violin plot, etc
# Box plot
bp + scale_fill_grey() + theme_classic()
# Scatter plot
sp + scale_color_grey() + theme_classic()

ggplot2 color, graph, R softwareggplot2 color, graph, R software

Change the gray value at the low and the high ends of the palette :

# Box plot
bp + scale_fill_grey(start=0.8, end=0.2) + theme_classic()
# Scatter plot
sp + scale_color_grey(start=0.8, end=0.2) + theme_classic()

ggplot2 color, graph, R softwareggplot2 color, graph, R software

Note that, the default value for the arguments start and end are : start = 0.2, end = 0.8

Continuous colors

The graph can be colored according to the values of a continuous variable using the functions :

  • scale_color_gradient(), scale_fill_gradient() for sequential gradients between two colors
  • scale_color_gradient2(), scale_fill_gradient2() for diverging gradients
  • scale_color_gradientn(), scale_fill_gradientn() for gradient between n colors

Gradient colors for scatter plots

The graphs are colored using the qsec continuous variable :

# Color by qsec values
sp2<-ggplot(mtcars, aes(x=wt, y=mpg, color=qsec)) + geom_point()
sp2
# Change the low and high colors
# Sequential color scheme
sp2+scale_color_gradient(low="blue", high="red")
# Diverging color scheme
mid<-mean(mtcars$qsec)
sp2+scale_color_gradient2(midpoint=mid, low="blue", mid="white",
                     high="red", space ="Lab" )

ggplot2 color, graph, R softwareggplot2 color, graph, R softwareggplot2 color, graph, R software

Gradient colors for histogram plots

set.seed(1234)
x <- rnorm(200)
# Histogram
hp<-qplot(x =x, fill=..count.., geom="histogram") 
hp
# Sequential color scheme
hp+scale_fill_gradient(low="blue", high="red")

ggplot2 color, graph, R softwareggplot2 color, graph, R software

Note that, the functions scale_color_continuous() and scale_fill_continuous() can be used also to set gradient colors.

Gradient between n colors

# Scatter plot
# Color points by the mpg variable
sp3<-ggplot(mtcars, aes(x=wt, y=mpg, color=mpg)) + geom_point()
sp3
# Gradient between n colors
sp3+scale_color_gradientn(colours = rainbow(5))

ggplot2 color, graph, R softwareggplot2 color, graph, R software

Infos

This analysis has been performed using R software (ver. 3.1.2) and ggplot2 (ver. 1.0.0)


ggplot2 axis ticks : A guide to customize tick marks and labels

$
0
0


The goal of this tutorial is to describe how to customize axis tick marks and labels in R software using ggplot2 package.


Data

ToothGrowth data is used in the examples hereafter.

# Convert dose column from numeric to factor variable
ToothGrowth$dose <- as.factor(ToothGrowth$dose)
head(ToothGrowth)
##    len supp dose
## 1  4.2   VC  0.5
## 2 11.5   VC  0.5
## 3  7.3   VC  0.5
## 4  5.8   VC  0.5
## 5  6.4   VC  0.5
## 6 10.0   VC  0.5

Make sure that dose column are converted as a factor using the above R script.

Example of plots

library(ggplot2)
p <- ggplot(ToothGrowth, aes(x=dose, y=len)) + geom_boxplot()
p

ggplot2 axis ticks, axis tick labels, R programming

Change the appearance of the axis tick mark labels

The color, the font size and the font face of axis tick mark labels can be changed using the functions theme() and element_text() as follow :

# x axis tick mark labels
p + theme(axis.text.x= element_text(family, face, colour, size))
# y axis tick mark labels
p + theme(axis.text.y = element_text(family, face, colour, size))

The following arguments can be used for the function element_text() to change the appearance of the text :


  • family : font family
  • face : font face. Possible values are “plain”, “italic”, “bold” and “bold.italic”
  • colour : text color
  • size : text size in pts
  • angle : angle (in [0, 360])


# Change the appearance and the orientation angle
# of axis tick labels
p + theme(axis.text.x = element_text(face="bold", color="#993333", 
                           size=14, angle=45),
          axis.text.y = element_text(face="bold", color="#993333", 
                           size=14, angle=45))

ggplot2 axis ticks, axis tick labels, R programming

Hide x and y axis tick mark labels

axis ticks and tick mark labels can be removed using the function element_blank() as follow :

# Hide x an y axis tick mark labels
p + theme(
  axis.text.x = element_blank(),
  axis.text.y = element_blank())
# Remove axis ticks and tick mark labels
p + theme(
  axis.text.x = element_blank(),
  axis.text.y = element_blank(),
  axis.ticks = element_blank())

ggplot2 axis ticks, axis tick labels, R programmingggplot2 axis ticks, axis tick labels, R programming

Change axis lines

Axis lines can be changed using the function element_line() as follow :

p + theme(axis.line = element_line(colour, size, linetype,
                                   lineend, color))

The arguments of element_line() are :


  • colour, color : line color
  • size : line size
  • linetype : line type. Line type can be specified using either text (“blank”, “solid”, “dashed”, “dotted”, “dotdash”, “longdash”, “twodash”) or number (0, 1, 2, 3, 4, 5, 6). Note that linetype = “solid” is identical to linetype=1. The available line types in R are described in this post : Line type in R software
  • lineend : line end. Allowed values for line end are : “round”, “butt” or “square”


# Change the line type and color of axis lines
p + theme( axis.line = element_line(colour = "darkblue", 
                      size = 1, linetype = "solid"))

ggplot2 axis ticks, axis tick labels, R programming

Set axis ticks for discrete and continuous axes

x or y axis can be discrete or continuous. In each of these two cases, the functions to be used for setting axis ticks are different.

Customize a discrete axis

The functions scale_x_discrete() and scale_y_discrete() are used to customize discrete x and y axis, respectively.

It is possible to use these functions to change the following x or y axis parameters :

  • axis titles
  • axis limits (data range to display)
  • choose where tick marks appear
  • manually label tick marks

The simplified formats of scale_x_discrete() and scale_y_discrete() are :

scale_x_discrete(name, breaks, labels, limits)
scale_y_discrete(name, breaks, labels, limits)

  • name : x or y axis labels
  • breaks : control the breaks in the guide (axis ticks, grid lines, …). Among the possible values, there are :
    • NULL : hide all breaks
    • waiver() : the default break computation
    • a character or numeric vector specifying which breaks to display
  • labels : labels of axis tick marks. Allowed values are :
    • NULL for no labels
    • waiver() for the default labels
    • character vector to be used for break labels
  • limits : a character vector indicating the data range


Note that, in the examples below, we’ll use only the functions scale_x_discrete() and xlim() to customize x axis tick marks. The same kind of examples can be applied to a discrete y axis using the functions scale_y_discrete() and ylim().

Change the order of items

The argument limits is used to change the order of the items :

# default plot
p
# Change the order of items
# Change the x axis name
p + scale_x_discrete(name ="Dose (mg)", 
                    limits=c("2","1","0.5"))

ggplot2 axis ticks, axis tick labels, R programmingggplot2 axis ticks, axis tick labels, R programming

Change tick mark labels

The name of tick mark texts can be changed as follow :

# Solution 1
p + scale_x_discrete(breaks=c("0.5","1","2"),
        labels=c("Dose 0.5", "Dose 1", "Dose 2"))
# Solution 2 : same plot as solution 1
p + scale_x_discrete(labels=c("0.5" = "Dose 0.5", "1" = "Dose 1",
                              "2" = "Dose 2"))

ggplot2 axis ticks, axis tick labels, R programmingggplot2 axis ticks, axis tick labels, R programming

Choose which items to display

The R code below shows the box plot for the first item (dose = 0.5) and the last item (dose = 2) :

# Solution 1
p + scale_x_discrete(limits=c("0.5", "2"))
# Solution 2 : same result as solution 1
p + xlim("0.5", "2")

ggplot2 axis ticks, axis tick labels, R programmingggplot2 axis ticks, axis tick labels, R programming

Customize a continuous axis

The functions scale_x_continuous() and scale_y_continuous() are used to customize continuous x and y axis, respectively.

Using these two functions, the following x or y axis parameters can be modified :

  • axis titles
  • axis limits (set the minimum and the maximum)
  • choose where tick marks appear
  • manually label tick marks

The simplified formats of scale_x_continuous() and scale_y_continuous() are :

scale_x_continuous(name, breaks, labels, limits, trans)
scale_y_continuous(name, breaks, labels, limits, trans)

  • name : x or y axis labels
  • breaks : control the breaks in the guide (axis ticks, grid lines, …). Among the possible values, there are :
    • NULL : hide all breaks
    • waiver() : the default break computation
    • a character or numeric vector specifying the breaks to display
  • labels : labels of axis tick marks. Allowed values are :
    • NULL for no labels
    • waiver() for the default labels
    • character vector to be used for break labels
  • limits : a numeric vector specifying x or y axis limits (min, max)
  • trans for axis transformations. Possible values are “log2”, “log10”, “sqrt”, etc


These functions can be used as follow :

# scatter plot
sp<-ggplot(cars, aes(x = speed, y = dist)) + geom_point()
sp
# Change x and y axis labels, and limits
sp + scale_x_continuous(name="Speed of cars", limits=c(0, 30)) +
  scale_y_continuous(name="Stopping distance", limits=c(0, 150))

ggplot2 axis ticks, axis tick labels, R programmingggplot2 axis ticks, axis tick labels, R programming

Set the position of tick marks

The R code below set the position of tick marks on the y axis of the box plot. The function scale_y_continuous() and the argument breaks are used to choose where the tick marks appear :

# Set tick marks on y axis
# a tick mark is shown on every 5
p + scale_y_continuous(breaks=seq(0,40,5))
# Tick marks can be spaced randomly
p + scale_y_continuous(breaks=c(5,7.5, 20, 25))
                     
# Remove tick mark labels and gridlines
p + scale_y_continuous(breaks=NULL)

ggplot2 axis ticks, axis tick labels, R programmingggplot2 axis ticks, axis tick labels, R programmingggplot2 axis ticks, axis tick labels, R programming

Format the text of tick mark labels

Tick mark labels can be formatted to be viewed as percents, dollars or scientific notation. The package scales is required.

library(scales)
# Format labels as percents
p + scale_y_continuous(labels = percent)
# Format labels as scientific
p + scale_y_continuous(labels = scientific)

ggplot2 axis ticks, axis tick labels, R programmingggplot2 axis ticks, axis tick labels, R programming

Possible values for labels are comma, percent, dollar and scientific. For more examples, read the documentation of the package scales : ?scales::trans_new

Infos

This analysis has been performed using R software (ver. 3.1.2) and ggplot2 (ver. )

ggplot2 box plot : Quick start guide - R software and data visualization

$
0
0


This R tutorial describes how to create a box plot using R software and ggplot2 package.

The function geom_boxplot() is used. A simplified format is :

geom_boxplot(outlier.colour="black", outlier.shape=16,
             outlier.size=2, notch=FALSE)
  • outlier.colour, outlier.shape, outlier.size : The color, the shape and the size for outlying points
  • notch : logical value. If TRUE, make a notched box plot. The notch displays a confidence interval around the median which is normally based on the median +/- 1.58*IQR/sqrt(n). Notches are used to compare groups; if the notches of two boxes do not overlap, this is a strong evidence that the medians differ.

ggplot2 box plot - R software and data visualization


Prepare the data

ToothGrowth data sets are used :

# Convert the variable dose from a numeric to a factor variable
ToothGrowth$dose <- as.factor(ToothGrowth$dose)
head(ToothGrowth)
##    len supp dose
## 1  4.2   VC  0.5
## 2 11.5   VC  0.5
## 3  7.3   VC  0.5
## 4  5.8   VC  0.5
## 5  6.4   VC  0.5
## 6 10.0   VC  0.5

Make sure that the variable dose is converted as a factor variable using the above R script.

Basic box plots

library(ggplot2)
# Basic box plot
p <- ggplot(ToothGrowth, aes(x=dose, y=len)) + 
  geom_boxplot()
p
# Rotate the box plot
p + coord_flip()
# Notched box plot
ggplot(ToothGrowth, aes(x=dose, y=len)) + 
  geom_boxplot(notch=TRUE)
# Change outlier, color, shape and size
ggplot(ToothGrowth, aes(x=dose, y=len)) + 
  geom_boxplot(outlier.colour="red", outlier.shape=8,
                outlier.size=4)

ggplot2 box plot - R software and data visualizationggplot2 box plot - R software and data visualizationggplot2 box plot - R software and data visualizationggplot2 box plot - R software and data visualization

The function stat_summary() can be used to add mean points to a box plot :

# Box plot with mean points
p + stat_summary(fun.y=mean, geom="point", shape=23, size=4)

ggplot2 box plot - R software and data visualization

Choose which items to display :

p + scale_x_discrete(limits=c("0.5", "2"))

ggplot2 box plot - R software and data visualization

Box plot with dots

Dots (or points) can be added to a box plot using the functions geom_dotplot() or geom_jitter() :

# Box plot with dot plot
p + geom_dotplot(binaxis='y', stackdir='center', dotsize=1)
# Box plot with jittered points
# 0.2 : degree of jitter in x direction
p + geom_jitter(shape=16, position=position_jitter(0.2))

ggplot2 box plot - R software and data visualizationggplot2 box plot - R software and data visualization

Change box plot colors by groups

Change box plot line colors

Box plot line colors can be automatically controlled by the levels of the variable dose :

# Change box plot line colors by groups
p<-ggplot(ToothGrowth, aes(x=dose, y=len, color=dose)) +
  geom_boxplot()
p

ggplot2 box plot - R software and data visualization

It is also possible to change manually box plot line colors using the functions :

  • scale_color_manual() : to use custom colors
  • scale_color_brewer() : to use color palettes from RColorBrewer package
  • scale_color_grey() : to use grey color palettes
# Use custom color palettes
p+scale_color_manual(values=c("#999999", "#E69F00", "#56B4E9"))
# Use brewer color palettes
p+scale_color_brewer(palette="Dark2")
# Use grey scale
p + scale_color_grey() + theme_classic()

ggplot2 box plot - R software and data visualizationggplot2 box plot - R software and data visualizationggplot2 box plot - R software and data visualization

Read more on ggplot2 colors here : ggplot2 colors

Change box plot fill colors

In the R code below, box plot fill colors are automatically controlled by the levels of dose :

# Use single color
ggplot(ToothGrowth, aes(x=dose, y=len)) +
  geom_boxplot(fill='#A4A4A4', color="black")+
  theme_classic()
# Change box plot colors by groups
p<-ggplot(ToothGrowth, aes(x=dose, y=len, fill=dose)) +
  geom_boxplot()
p

ggplot2 box plot - R software and data visualizationggplot2 box plot - R software and data visualization

It is also possible to change manually box plot fill colors using the functions :

  • scale_fill_manual() : to use custom colors
  • scale_fill_brewer() : to use color palettes from RColorBrewer package
  • scale_fill_grey() : to use grey color palettes
# Use custom color palettes
p+scale_fill_manual(values=c("#999999", "#E69F00", "#56B4E9"))
# use brewer color palettes
p+scale_fill_brewer(palette="Dark2")
# Use grey scale
p + scale_fill_grey() + theme_classic()

ggplot2 box plot - R software and data visualizationggplot2 box plot - R software and data visualizationggplot2 box plot - R software and data visualization

Read more on ggplot2 colors here : ggplot2 colors

Change the legend position

p + theme(legend.position="top")
p + theme(legend.position="bottom")
p + theme(legend.position="none") # Remove legend

ggplot2 box plot - R software and data visualizationggplot2 box plot - R software and data visualizationggplot2 box plot - R software and data visualization

The allowed values for the arguments legend.position are : “left”,“top”, “right”, “bottom”.

Read more on ggplot legend : ggplot2 legend

Change the order of items in the legend

The function scale_x_discrete can be used to change the order of items to “2”, “0.5”, “1” :

p + scale_x_discrete(limits=c("2", "0.5", "1"))

ggplot2 box plot - R software and data visualization

Box plot with multiple groups

# Change box plot colors by groups
ggplot(ToothGrowth, aes(x=dose, y=len, fill=supp)) +
  geom_boxplot()
# Change the position
p<-ggplot(ToothGrowth, aes(x=dose, y=len, fill=supp)) +
  geom_boxplot(position=position_dodge(1))
p

ggplot2 box plot - R software and data visualizationggplot2 box plot - R software and data visualization

Change box plot colors and add dots :

# Add dots
p + geom_dotplot(binaxis='y', stackdir='center',
                 position=position_dodge(1))
# Change colors
p+scale_fill_manual(values=c("#999999", "#E69F00", "#56B4E9"))

ggplot2 box plot - R software and data visualizationggplot2 box plot - R software and data visualization

Customized box plots

# Basic box plot
ggplot(ToothGrowth, aes(x=dose, y=len)) + 
  geom_boxplot(fill="gray")+
  labs(title="Plot of length per dose",x="Dose (mg)", y = "Length")+
  theme_classic()
# Change  automatically color by groups
bp <- ggplot(ToothGrowth, aes(x=dose, y=len, fill=dose)) + 
  geom_boxplot()+
  labs(title="Plot of length  per dose",x="Dose (mg)", y = "Length")
bp + theme_classic()

ggplot2 box plot - R software and data visualizationggplot2 box plot - R software and data visualization

Change fill colors manually :

# Continuous colors
bp + scale_fill_brewer(palette="Blues") + theme_classic()
# Discrete colors
bp + scale_fill_brewer(palette="Dark2") + theme_minimal()
# Gradient colors
bp + scale_fill_brewer(palette="RdBu") + theme_minimal()

ggplot2 box plot - R software and data visualizationggplot2 box plot - R software and data visualizationggplot2 box plot - R software and data visualization

Read more on ggplot2 colors here : ggplot2 colors

Infos

This analysis has been performed using R software (ver. 3.1.2) and ggplot2 (ver. 1.0.0)

ggplot2 legend : Easy steps to change the position and the appearance of a graph legend in R software

$
0
0


The goal of this R tutorial is to describe how to change the legend of a graph generated using ggplot2 package.


Data

ToothGrowth data is used in the examples below :

# Convert the variable dose from numeric to factor variable
ToothGrowth$dose <- as.factor(ToothGrowth$dose)
head(ToothGrowth)
##    len supp dose
## 1  4.2   VC  0.5
## 2 11.5   VC  0.5
## 3  7.3   VC  0.5
## 4  5.8   VC  0.5
## 5  6.4   VC  0.5
## 6 10.0   VC  0.5

Make sure that the variable dose is converted as a factor variable using the above R script.

Example of plot

library(ggplot2)
p <- ggplot(ToothGrowth, aes(x=dose, y=len, fill=dose)) + 
  geom_boxplot()
p

ggplot2 legend, graph, R software

Change the legend position

The position of the legend can be changed using the function theme() as follow :

p + theme(legend.position="top")
p + theme(legend.position="bottom")

ggplot2 legend, graph, R softwareggplot2 legend, graph, R software

The allowed values for the arguments legend.position are : “left”,“top”, “right”, “bottom”.

Note that, the argument legend.position can be also a numeric vector c(x,y). In this case it is possible to position the legend inside the plotting area. x and y are the coordinates of the legend box. Their values should be between 0 and 1. c(0,0) corresponds to the “bottom left” and c(1,1) corresponds to the “top right” position.

p + theme(legend.position = c(0.8, 0.2))

ggplot2 legend, graph, R software

Change the legend title and text font styles

# legend title
p + theme(legend.title = element_text(colour="blue", size=10, 
                                      face="bold"))
# legend labels
p + theme(legend.text = element_text(colour="blue", size=10, 
                                     face="bold"))

ggplot2 legend, graph, R softwareggplot2 legend, graph, R software

Change the background color of the legend box

# legend box background color
p + theme(legend.background = element_rect(fill="lightblue", 
                                  size=0.5, linetype="solid"))
p + theme(legend.background = element_rect(fill="lightblue",
                                  size=0.5, linetype="solid", 
                                  colour ="darkblue"))

ggplot2 legend, graph, R softwareggplot2 legend, graph, R software

Change the order of legend items

To change the order of items to “2”, “0.5”, “1” :

p + scale_x_discrete(limits=c("2", "0.5", "1"))

ggplot2 legend, graph, R software

Remove the plot legend

# Remove only the legend title
p + theme(legend.title = element_blank())
# Remove the plot legend
p + theme(legend.position='none')

ggplot2 legend, graph, R softwareggplot2 legend, graph, R software

Remove slashes in the legend of a bar plot

# Default plot
ggplot(data=ToothGrowth, aes(x=dose, fill=dose)) + geom_bar()
# Change bar plot border color, 
# but slashes are added in the legend
ggplot(data=ToothGrowth, aes(x=dose, fill=dose)) +
  geom_bar(colour="black")
# Hide the slashes: 
  #1. plot the bars with no border color,
  #2. plot the bars again with border color, but with a blank legend.
ggplot(data=ToothGrowth, aes(x=dose, fill=dose))+ 
  geom_bar() + 
  geom_bar(colour="black", show_guide=FALSE)

ggplot2 legend, graph, R softwareggplot2 legend, graph, R softwareggplot2 legend, graph, R software

guides() : set or remove the legend for a specific aesthetic

It’s possible to use the function guides() to set or remove the legend of a particular aesthetic(fill, color, size, shape, etc).

mtcars data sets are used :

# Prepare the data : convert cyl and gear to factor variables
mtcars$cyl<-as.factor(mtcars$cyl)
mtcars$gear <- as.factor(mtcars$gear)
head(mtcars)
##                    mpg cyl disp  hp drat    wt  qsec vs am gear carb
## Mazda RX4         21.0   6  160 110 3.90 2.620 16.46  0  1    4    4
## Mazda RX4 Wag     21.0   6  160 110 3.90 2.875 17.02  0  1    4    4
## Datsun 710        22.8   4  108  93 3.85 2.320 18.61  1  1    4    1
## Hornet 4 Drive    21.4   6  258 110 3.08 3.215 19.44  1  0    3    1
## Hornet Sportabout 18.7   8  360 175 3.15 3.440 17.02  0  0    3    2
## Valiant           18.1   6  225 105 2.76 3.460 20.22  1  0    3    1

Default plot without guide specification

The R code below creates a scatter plot. The color and the shape of the points are determined by the factor variables cyl and gear, respectively. The size of the points are controlled by the variable qsec.

p <- ggplot(data = mtcars, 
    aes(x=mpg, y=wt, color=cyl, size=qsec, shape=gear))+
    geom_point()
# Print the plot without guide specification
p

ggplot2 legend, graph, R software

Change the legend position for multiple guides

# Change the legend position
p +theme(legend.position="bottom")

ggplot2 legend, graph, R software

# Horizontal legend box
p +theme(legend.position="bottom", legend.box = "horizontal")

ggplot2 legend, graph, R software

Change the order for multiple guides

The function guide_legend() is used :

p+guides(color = guide_legend(order=1),
         size = guide_legend(order=2),
         shape = guide_legend(order=3))

ggplot2 legend, graph, R software

If a continuous color is used, the order of the color guide can be changed using the function guide_colourbar() :

qplot(data = mpg, x = displ, y = cty, size = hwy,
      colour = cyl, shape = drv) +
  guides(colour = guide_colourbar(order = 1),
         alpha = guide_legend(order = 2),
         size = guide_legend(order = 3))

ggplot2 legend, graph, R software

Remove a legend for a particular aesthetic

The R code below removes the legend for the aesthetics color and size :

p+guides(color = FALSE, size = FALSE)

ggplot2 legend, graph, R software

Removing a particular legend can be done also when using the functions scale_xx. In this case the argument guide is used as follow :

# Remove legend for the point shape
p+scale_shape(guide=FALSE)
# Remove legend for size
p +scale_size(guide=FALSE)
# Remove legend for color
p + scale_color_manual(values=c('#999999','#E69F00','#56B4E9'),
                       guide=FALSE)

ggplot2 legend, graph, R softwareggplot2 legend, graph, R softwareggplot2 legend, graph, R software

Infos

This analysis has been performed using R software (ver. 3.1.0) and ggplot2 (ver. 1.0.0)

ggplot2 histogram plot : Quick start guide - R software and data visualization

$
0
0


This R tutorial describes how to create a histogram plot using R software and ggplot2 package.

The function geom_histogram() is used. You can also add a line for the mean using the function geom_vline.

ggplot2 histogram plot - R software and data visualization


Prepare the data

The data below will be used :

set.seed(1234)
df <- data.frame(
  sex=factor(rep(c("F", "M"), each=200)),
  weight=round(c(rnorm(200, mean=55, sd=5), rnorm(200, mean=65, sd=5)))
  )
head(df)
##   sex weight
## 1   F     49
## 2   F     56
## 3   F     60
## 4   F     43
## 5   F     57
## 6   F     58

Basic histogram plots

library(ggplot2)
# Basic histogram
ggplot(df, aes(x=weight)) + geom_histogram()
# Change the width of bins
ggplot(df, aes(x=weight)) + 
  geom_histogram(binwidth=1)
# Change colors
p<-ggplot(df, aes(x=weight)) + 
  geom_histogram(color="black", fill="white")
p

ggplot2 histogram plot - R software and data visualizationggplot2 histogram plot - R software and data visualizationggplot2 histogram plot - R software and data visualization

Add mean line and density plot on the histogram

  • The histogram is plotted with density instead of count on y-axis
  • Overlay with transparent density plot. The value of alpha controls the level of transparency
# Add mean line
p+ geom_vline(aes(xintercept=mean(weight)),
            color="blue", linetype="dashed", size=1)
# Histogram with density plot
ggplot(df, aes(x=weight)) + 
 geom_histogram(aes(y=..density..), colour="black", fill="white")+
 geom_density(alpha=.2, fill="#FF6666") 

ggplot2 histogram plot - R software and data visualizationggplot2 histogram plot - R software and data visualization

Read more on ggplot2 line types : ggplot2 line types

Change histogram plot line types and colors

# Change line color and fill color
ggplot(df, aes(x=weight))+
  geom_histogram(color="darkblue", fill="lightblue")
# Change line type
ggplot(df, aes(x=weight))+
  geom_histogram(color="black", fill="lightblue",
                 linetype="dashed")

ggplot2 histogram plot - R software and data visualizationggplot2 histogram plot - R software and data visualization

Change histogram plot colors by groups

Calculate the mean of each group :

The package plyr is used to calculate the average weight of each group :

library(plyr)
mu <- ddply(df, "sex", summarise, grp.mean=mean(weight))
head(mu)
##   sex grp.mean
## 1   F    54.70
## 2   M    65.36

Change line colors

Histogram plot line colors can be automatically controlled by the levels of the variable sex.

Note that, you can change the position adjustment to use for overlapping points on the layer. Possible values for the argument position are “identity”, “stack”, “dodge”. Default value is “stack”.

# Change histogram plot line colors by groups
ggplot(df, aes(x=weight, color=sex)) +
  geom_histogram(fill="white")
# Overlaid histograms
ggplot(df, aes(x=weight, color=sex)) +
  geom_histogram(fill="white", alpha=0.5, position="identity")

ggplot2 histogram plot - R software and data visualizationggplot2 histogram plot - R software and data visualization

# Interleaved histograms
ggplot(df, aes(x=weight, color=sex)) +
  geom_histogram(fill="white", position="dodge")+
  theme(legend.position="top")
# Add mean lines
p<-ggplot(df, aes(x=weight, color=sex)) +
  geom_histogram(fill="white", position="dodge")+
  geom_vline(data=mu, aes(xintercept=grp.mean, color=sex),
             linetype="dashed")+
  theme(legend.position="top")
p

ggplot2 histogram plot - R software and data visualizationggplot2 histogram plot - R software and data visualization

It is also possible to change manually histogram plot line colors using the functions :

  • scale_color_manual() : to use custom colors
  • scale_color_brewer() : to use color palettes from RColorBrewer package
  • scale_color_grey() : to use grey color palettes
# Use custom color palettes
p+scale_color_manual(values=c("#999999", "#E69F00", "#56B4E9"))
# Use brewer color palettes
p+scale_color_brewer(palette="Dark2")
# Use grey scale
p + scale_color_grey() + theme_classic() +
  theme(legend.position="top")

ggplot2 histogram plot - R software and data visualizationggplot2 histogram plot - R software and data visualizationggplot2 histogram plot - R software and data visualization

Read more on ggplot2 colors here : ggplot2 colors

Change fill colors

Histogram plot fill colors can be automatically controlled by the levels of sex :

# Change histogram plot fill colors by groups
ggplot(df, aes(x=weight, fill=sex, color=sex)) +
  geom_histogram(position="identity")
# Use semi-transparent fill
p<-ggplot(df, aes(x=weight, fill=sex, color=sex)) +
  geom_histogram(position="identity", alpha=0.5)
p
# Add mean lines
p+geom_vline(data=mu, aes(xintercept=grp.mean, color=sex),
             linetype="dashed")

ggplot2 histogram plot - R software and data visualizationggplot2 histogram plot - R software and data visualizationggplot2 histogram plot - R software and data visualization

It is also possible to change manually histogram plot fill colors using the functions :

  • scale_fill_manual() : to use custom colors
  • scale_fill_brewer() : to use color palettes from RColorBrewer package
  • scale_fill_grey() : to use grey color palettes
# Use custom color palettes
p+scale_color_manual(values=c("#999999", "#E69F00", "#56B4E9"))+
  scale_fill_manual(values=c("#999999", "#E69F00", "#56B4E9"))
# use brewer color palettes
p+scale_color_brewer(palette="Dark2")+
  scale_fill_brewer(palette="Dark2")
# Use grey scale
p + scale_color_grey()+scale_fill_grey() +
  theme_classic()

ggplot2 histogram plot - R software and data visualizationggplot2 histogram plot - R software and data visualizationggplot2 histogram plot - R software and data visualization

Read more on ggplot2 colors here : ggplot2 colors

Change the legend position

p + theme(legend.position="top")
p + theme(legend.position="bottom")
# Remove legend
p + theme(legend.position="none")

ggplot2 histogram plot - R software and data visualizationggplot2 histogram plot - R software and data visualizationggplot2 histogram plot - R software and data visualization

The allowed values for the arguments legend.position are : “left”,“top”, “right”, “bottom”.

Read more on ggplot legends : ggplot2 legends

Use facets

Split the plot into multiple panels :

p<-ggplot(df, aes(x=weight))+
  geom_histogram(color="black", fill="white")+
  facet_grid(sex ~ .)
p
# Add mean lines
p+geom_vline(data=mu, aes(xintercept=grp.mean, color="red"),
             linetype="dashed")

ggplot2 histogram plot - R software and data visualizationggplot2 histogram plot - R software and data visualization

Read more on facets : ggplot2 facets

Customized histogram plots

# Basic histogram
ggplot(df, aes(x=weight, fill=sex)) +
  geom_histogram(fill="white", color="black")+
  geom_vline(aes(xintercept=mean(weight)), color="blue",
             linetype="dashed")+
  labs(title="Weight histogram plot",x="Weight(kg)", y = "Count")+
  theme_classic()
# Change line colors by groups
ggplot(df, aes(x=weight, color=sex, fill=sex)) +
  geom_histogram(position="identity", alpha=0.5)+
  geom_vline(data=mu, aes(xintercept=grp.mean, color=sex),
             linetype="dashed")+
  scale_color_manual(values=c("#999999", "#E69F00", "#56B4E9"))+
  scale_fill_manual(values=c("#999999", "#E69F00", "#56B4E9"))+
  labs(title="Weight histogram plot",x="Weight(kg)", y = "Count")+
  theme_classic()

ggplot2 histogram plot - R software and data visualizationggplot2 histogram plot - R software and data visualization

Combine histogram and density plots :

# Change line colors by groups
ggplot(df, aes(x=weight, color=sex, fill=sex)) +
geom_histogram(aes(y=..density..), position="identity", alpha=0.5)+
geom_density(alpha=0.6)+
geom_vline(data=mu, aes(xintercept=grp.mean, color=sex),
           linetype="dashed")+
scale_color_manual(values=c("#999999", "#E69F00", "#56B4E9"))+
scale_fill_manual(values=c("#999999", "#E69F00", "#56B4E9"))+
labs(title="Weight histogram plot",x="Weight(kg)", y = "Density")+
theme_classic()

ggplot2 histogram plot - R software and data visualization

Change line colors manually :

p<-ggplot(df, aes(x=weight, color=sex)) +
  geom_histogram(fill="white", position="dodge")+
  geom_vline(data=mu, aes(xintercept=grp.mean, color=sex),
             linetype="dashed")
# Continuous colors
p + scale_color_brewer(palette="Paired") + 
  theme_classic()+theme(legend.position="top")
# Discrete colors
p + scale_color_brewer(palette="Dark2") +
  theme_minimal()+theme_classic()+theme(legend.position="top")
# Gradient colors
p + scale_color_brewer(palette="Accent") + 
  theme_minimal()+theme(legend.position="top")

ggplot2 histogram plot - R software and data visualizationggplot2 histogram plot - R software and data visualizationggplot2 histogram plot - R software and data visualization

Read more on ggplot2 colors here : ggplot2 colors

Infos

This analysis has been performed using R software (ver. 3.1.2) and ggplot2 (ver. 1.0.0)

ggplot2 scatter plots : Quick start guide - R software and data visualization

$
0
0


This article describes how create a scatter plot using R software and ggplot2 package. The function geom_point() is used.


Prepare the data

mtcars data sets are used in the examples below.

# Convert cyl column from a numeric to a factor variable
mtcars$cyl <- as.factor(mtcars$cyl)
head(mtcars)
##                    mpg cyl disp  hp drat    wt  qsec vs am gear carb
## Mazda RX4         21.0   6  160 110 3.90 2.620 16.46  0  1    4    4
## Mazda RX4 Wag     21.0   6  160 110 3.90 2.875 17.02  0  1    4    4
## Datsun 710        22.8   4  108  93 3.85 2.320 18.61  1  1    4    1
## Hornet 4 Drive    21.4   6  258 110 3.08 3.215 19.44  1  0    3    1
## Hornet Sportabout 18.7   8  360 175 3.15 3.440 17.02  0  0    3    2
## Valiant           18.1   6  225 105 2.76 3.460 20.22  1  0    3    1

Basic scatter plots

Simple scatter plots are created using the R code below. The color, the size and the shape of points can be changed using the function geom_point() as follow :

geom_point(size, color, shape)
library(ggplot2)
# Basic scatter plot
ggplot(mtcars, aes(x=wt, y=mpg)) + geom_point()
# Change the point size, and shape
ggplot(mtcars, aes(x=wt, y=mpg)) +
  geom_point(size=2, shape=23)

Note that, the size of the points can be controlled by the values of a continuous variable as in the example below.

# Change the point size
ggplot(mtcars, aes(x=wt, y=mpg)) + 
  geom_point(aes(size=qsec))

Read more on point shapes : ggplot2 point shapes

Label points in the scatter plot

The function geom_text() can be used :

ggplot(mtcars, aes(x=wt, y=mpg)) +
  geom_point() + 
  geom_text(label=rownames(mtcars))

Read more on text annotations : ggplot2 - add texts to a plot

Add regression lines

The functions below can be used to add regression lines to a scatter plot :

  • geom_smooth() and stat_smooth()
  • geom_abline()

geom_abline() has been already described at this link : ggplot2 add straight lines to a plot.

Only the function geom_smooth() is covered in this section.

A simplified format is :

geom_smooth(method="auto", se=TRUE, fullrange=FALSE, level=0.95)

  • method : smoothing method to be used. Possible values are lm, glm, gam, loess, rlm.
    • method = “loess”: This is the default value for small number of observations. It computes a smooth local regression. You can read more about loess using the R code ?loess.
    • method =“lm”: It fits a linear model. Note that, it’s also possible to indicate the formula as formula = y ~ poly(x, 3) to specify a degree 3 polynomial.
  • se : logical value. If TRUE, confidence interval is displayed around smooth.
  • fullrange : logical value. If TRUE, the fit spans the full range of the plot
  • level : level of confidence interval to use. Default value is 0.95


# Add the regression line
ggplot(mtcars, aes(x=wt, y=mpg)) + 
  geom_point()+
  geom_smooth(method=lm)
# Remove the confidence interval
ggplot(mtcars, aes(x=wt, y=mpg)) + 
  geom_point()+
  geom_smooth(method=lm, se=FALSE)
# Loess method
ggplot(mtcars, aes(x=wt, y=mpg)) + 
  geom_point()+
  geom_smooth()

Change the appearance of points and lines

This section describes how to change :

  • the color and the shape of points
  • the line type and color of the regression line
  • the fill color of the confidence interval
# Change the point colors and shapes
# Change the line type and color
ggplot(mtcars, aes(x=wt, y=mpg)) + 
  geom_point(shape=18, color="blue")+
  geom_smooth(method=lm, se=FALSE, linetype="dashed",
             color="darkred")
# Change the confidence interval fill color
ggplot(mtcars, aes(x=wt, y=mpg)) + 
  geom_point(shape=18, color="blue")+
  geom_smooth(method=lm,  linetype="dashed",
             color="darkred", fill="blue")

Note that a transparent color is used, by default, for the confidence band. This can be changed by using the argument alpha : geom_smooth(fill=“blue”, alpha=1)

Read more on point shapes : ggplot2 point shapes

Read more on line types : ggplot2 line types

Scatter plots with multiple groups

This section describes how to change point colors and shapes automatically and manually.

Change the point color/shape/size automatically

In the R code below, point shapes, colors and sizes are controlled by the levels of the factor variable cyl :

# Change point shapes by the levels of cyl
ggplot(mtcars, aes(x=wt, y=mpg, shape=cyl)) +
  geom_point()
# Change point shapes and colors
ggplot(mtcars, aes(x=wt, y=mpg, shape=cyl, color=cyl)) +
  geom_point()
# Change point shapes, colors and sizes
ggplot(mtcars, aes(x=wt, y=mpg, shape=cyl, color=cyl, size=cyl)) +
  geom_point()

Add regression lines

Regression lines can be added as follow :

# Add regression lines
ggplot(mtcars, aes(x=wt, y=mpg, color=cyl, shape=cyl)) +
  geom_point() + 
  geom_smooth(method=lm)
# Remove confidence intervals
# Extend the regression lines
ggplot(mtcars, aes(x=wt, y=mpg, color=cyl, shape=cyl)) +
  geom_point() + 
  geom_smooth(method=lm, se=FALSE, fullrange=TRUE)

Note that, you can also change the line type of the regression lines by using the aesthetic linetype = cyl.

The fill color of confidence bands can be changed as follow :

ggplot(mtcars, aes(x=wt, y=mpg, color=cyl, shape=cyl)) +
  geom_point() + 
  geom_smooth(method=lm, aes(fill=cyl))

Change the point color/shape/size manually

The functions below are used :

  • scale_shape_manual() for point shapes
  • scale_color_manual() for point colors
  • scale_size_manual() for point sizes
# Change point shapes and colors manually
ggplot(mtcars, aes(x=wt, y=mpg, color=cyl, shape=cyl)) +
  geom_point() + 
  geom_smooth(method=lm, se=FALSE, fullrange=TRUE)+
  scale_shape_manual(values=c(3, 16, 17))+ 
  scale_color_manual(values=c('#999999','#E69F00', '#56B4E9'))+
  theme(legend.position="top")
  
# Change the point sizes manually
ggplot(mtcars, aes(x=wt, y=mpg, color=cyl, shape=cyl))+
  geom_point(aes(size=cyl)) + 
  geom_smooth(method=lm, se=FALSE, fullrange=TRUE)+
  scale_shape_manual(values=c(3, 16, 17))+ 
  scale_color_manual(values=c('#999999','#E69F00', '#56B4E9'))+
  scale_size_manual(values=c(2,3,4))+
  theme(legend.position="top")

It is also possible to change manually point and line colors using the functions :

  • scale_color_brewer() : to use color palettes from RColorBrewer package
  • scale_color_grey() : to use grey color palettes
p <- ggplot(mtcars, aes(x=wt, y=mpg, color=cyl, shape=cyl)) +
  geom_point() + 
  geom_smooth(method=lm, se=FALSE, fullrange=TRUE)+
  theme_classic()
# Use brewer color palettes
p+scale_color_brewer(palette="Dark2")
# Use grey scale
p + scale_color_grey()

Read more on ggplot2 colors here : ggplot2 colors

Add marginal rugs to a scatter plot

The function geom_rug() can be used :

geom_rug(sides ="bl")

sides : a string that controls which sides of the plot the rugs appear on. Allowed value is a string containing any of “trbl”, for top, right, bottom, and left.

# Add marginal rugs
ggplot(mtcars, aes(x=wt, y=mpg)) +
  geom_point() + geom_rug()
# Change colors
ggplot(mtcars, aes(x=wt, y=mpg, color=cyl)) +
  geom_point() + geom_rug()
# Add marginal rugs using faithful data
ggplot(faithful, aes(x=eruptions, y=waiting)) +
  geom_point() + geom_rug()

Scatter plots with the 2d density estimation

The functions geom_density_2d() or stat_density_2d() can be used :

# Scatter plot with the 2d density estimation
sp <- ggplot(faithful, aes(x=eruptions, y=waiting)) +
  geom_point()
sp + geom_density_2d()
# Gradient color
sp + stat_density_2d(aes(fill = ..level..), geom="polygon")
# Change the gradient color
sp + stat_density_2d(aes(fill = ..level..), geom="polygon")+
  scale_fill_gradient(low="blue", high="red")

Read more on ggplot2 colors here : ggplot2 colors

Scatter plots with ellipses

The function stat_ellipse() can be used as follow:

# One ellipse arround all points
ggplot(faithful, aes(waiting, eruptions))+
  geom_point()+
  stat_ellipse()
# Ellipse by groups
p <- ggplot(faithful, aes(waiting, eruptions, color = eruptions > 3))+
  geom_point()
p + stat_ellipse()
# Change the type of ellipses: possible values are "t", "norm", "euclid"
p + stat_ellipse(type = "norm")

Scatter plots with rectangular bins

The number of observations is counted in each bins and displayed using any of the functions below :

  • geom_bin2d() for adding a heatmap of 2d bin counts
  • stat_bin_2d() for counting the number of observation in rectangular bins
  • stat_summary_2d() to apply function for 2D rectangular bins

The simplified formats of these functions are :

plot + geom_bin2d(...)
plot+stat_bin_2d(geom=NULL, bins=30)
plot + stat_summary_2d(geom = NULL, bins = 30, fun = mean)
  • geom : geometrical object to display the data
  • bins : Number of bins in both vertical and horizontal directions. The default value is 30
  • fun : function for summary

The data sets diamonds from ggplot2 package is used :

head(diamonds)
##   carat       cut color clarity depth table price    x    y    z
## 1  0.23     Ideal     E     SI2  61.5    55   326 3.95 3.98 2.43
## 2  0.21   Premium     E     SI1  59.8    61   326 3.89 3.84 2.31
## 3  0.23      Good     E     VS1  56.9    65   327 4.05 4.07 2.31
## 4  0.29   Premium     I     VS2  62.4    58   334 4.20 4.23 2.63
## 5  0.31      Good     J     SI2  63.3    58   335 4.34 4.35 2.75
## 6  0.24 Very Good     J    VVS2  62.8    57   336 3.94 3.96 2.48
# Plot
p <- ggplot(diamonds, aes(carat, price))
p + geom_bin2d()

Change the number of bins :

# Change the number of bins
p + geom_bin2d(bins=10)

Or specify the width of bins :

# Or specify the width of bins
p + geom_bin2d(binwidth=c(1, 1000))

Scatter plot with marginal density distribution plot

Step 1/3. Create some data :

set.seed(1234)
x <- c(rnorm(500, mean = -1), rnorm(500, mean = 1.5))
y <- c(rnorm(500, mean = 1), rnorm(500, mean = 1.7))
group <- as.factor(rep(c(1,2), each=500))
df <- data.frame(x, y, group)
head(df)
##             x          y group
## 1 -2.20706575 -0.2053334     1
## 2 -0.72257076  1.3014667     1
## 3  0.08444118 -0.5391452     1
## 4 -3.34569770  1.6353707     1
## 5 -0.57087531  1.7029518     1
## 6 -0.49394411 -0.9058829     1

Step 2/3. Create the plots :

# scatter plot of x and y variables
# color by groups
scatterPlot <- ggplot(df,aes(x, y, color=group)) + 
  geom_point() + 
  scale_color_manual(values = c('#999999','#E69F00')) + 
  theme(legend.position=c(0,1), legend.justification=c(0,1))
scatterPlot
# Marginal density plot of x (top panel)
xdensity <- ggplot(df, aes(x, fill=group)) + 
  geom_density(alpha=.5) + 
  scale_fill_manual(values = c('#999999','#E69F00')) + 
  theme(legend.position = "none")
xdensity
# Marginal density plot of y (right panel)
ydensity <- ggplot(df, aes(y, fill=group)) + 
  geom_density(alpha=.5) + 
  scale_fill_manual(values = c('#999999','#E69F00')) + 
  theme(legend.position = "none")
ydensity

Create a blank placeholder plot :

blankPlot <- ggplot()+geom_blank(aes(1,1))+
  theme(plot.background = element_blank(), 
   panel.grid.major = element_blank(),
   panel.grid.minor = element_blank(), 
   panel.border = element_blank(),
   panel.background = element_blank(),
   axis.title.x = element_blank(),
   axis.title.y = element_blank(),
   axis.text.x = element_blank(), 
   axis.text.y = element_blank(),
   axis.ticks = element_blank()
     )

Step 3/3. Put the plots together:

To put multiple plots on the same page, the package gridExtra can be used. Install the package as follow :

install.packages("gridExtra")

Arrange ggplot2 with adapted height and width for each row and column :

library("gridExtra")
grid.arrange(xdensity, blankPlot, scatterPlot, ydensity, 
        ncol=2, nrow=2, widths=c(4, 1.4), heights=c(1.4, 4))

Read more on how to arrange multiple ggplots in one page : ggplot2 - Easy way to mix multiple graphs on the same page

Customized scatter plots

# Basic scatter plot
ggplot(mtcars, aes(x=wt, y=mpg)) + 
  geom_point()+
  geom_smooth(method=lm, color="black")+
  labs(title="Miles per gallon \n according to the weight",
       x="Weight (lb/1000)", y = "Miles/(US) gallon")+
  theme_classic()  
# Change color/shape by groups
# Remove confidence bands
p <- ggplot(mtcars, aes(x=wt, y=mpg, color=cyl, shape=cyl)) + 
  geom_point()+
  geom_smooth(method=lm, se=FALSE, fullrange=TRUE)+
  labs(title="Miles per gallon \n according to the weight",
       x="Weight (lb/1000)", y = "Miles/(US) gallon")
p + theme_classic()  

Change colors manually :

# Continuous colors
p + scale_color_brewer(palette="Paired") + theme_classic()
# Discrete colors
p + scale_color_brewer(palette="Dark2") + theme_minimal()
# Gradient colors
p + scale_color_brewer(palette="Accent") + theme_minimal()

Read more on ggplot2 colors here : ggplot2 colors

Infos

This analysis has been performed using R software (ver. 3.2.4) and ggplot2 (ver. 2.1.0)

Viewing all 183 articles
Browse latest View live


<script src="https://jsc.adskeeper.com/r/s/rssing.com.1596347.js" async> </script>